 Open Access Article
Creative Commons Attribution 3.0 Unported Licence
Guidance of growth mode and structural character in organic–inorganic hybrid materials – a comparative study
K. B.
Klepper
*,
O.
Nilsen
,
S.
Francis
and
H.
Fjellvåg
Department of Chemistry and Centre for Materials Science and Nanotechnology, University of Oslo, P.O. Box 1033, Blindern, Oslo N-0315, Norway. E-mail: k.b.klepper@kjemi.uio.no
First published on 18th December 2013
Abstract
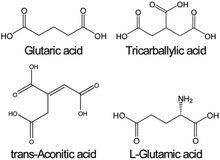
A main goal in the construction of thin films is to control film growth in all aspects. Accurate control of the building blocks and their reaction sites is one way to achieve that. This is a key feature of the atomic layer deposition (ALD) technique. The aim of this study is to achieve such growth control of organic–inorganic thin films. The organic building blocks consist of the linear carboxylic acids: glutaric, tricarballylic, and trans-aconitic acid and the amino acid L-glutamic acid. All of these are based on five carbon long backbones. The acids were linked by aluminium using trimethylaluminum (TMA). These precursors made it possible to study the effect of the functionality of the organic acid backbone on growth rate, reaction modes, and the material properties of the deposited materials. The growth dynamics were investigated by in situ characterization using a quartz crystal microbalance (QCM). QCM revealed that all systems are of a self-limiting ALD-type. Ideal ALD growth was found for the tricarballylic acid–TMA system. For the other systems, the growth rate decreased with increasing temperature. The growth rates ranged from 0.05 to 2 nm per cycle. Analysis by Fourier transform infrared spectroscopy (FTIR) verified the hybrid character of the films and the presence of two different growth modes. The films were X-ray amorphous as deposited, with the exception of the L-glutamic–TMA system. Surface roughness and topography of the films was investigated by atomic force microscopy (AFM). Optical and surface wetting properties of the films were investigated by UV-Vis spectroscopy and the goniometer method for sessile drops, respectively. All films were stable in contact with water and generally had very low surface roughness. The present work has shown that the ALD technique can offer controlled growth of functionalized hybrid materials. It is likely that specifically chosen functionalized precursors can be employed to obtain specific structural designs and properties. The first sign of this was found for the L-glutamic–TMA system. The diffraction features of the as-deposited films of this system indicate the presence of sheet-like ordering within the material. This is one of the first observations of this kind by ALD.
Introduction
Within the last few years, surface-functionalized organic–inorganic hybrid materials have been developed using the atomic layer deposition (ALD) technique or the closely related molecular layer deposition (MLD) technique.1–18 Previously, the main focus has been on deposition of organic–inorganic hybrid materials using cations of aluminium, titanium and zinc in combination with mainly carboxylic acids, amines and alcohols.1–18 This recent class of ALD materials represents a type of metal–organic compound. However, little is known regarding their detailed atomic arrangement, whether it is molecular, layered or 3-dimensional, dense or open. These materials may be ascribed to the group of coordination networks. A well-known subgroup of coordination networks is the metal–organic framework (MOF) materials. These materials are associated with large pores and surface areas. Consequently, they have been synthesized and intensively studied during the last decade. The field of MOF materials as thin films is fairly new,19,20 and it is a field where the ALD technique has yet to demonstrate its versatility.Although surface-functionalized hybrid materials can be deposited by the ALD technique, at the current stage, such thin film materials only resemble MOF materials. It has not yet been possible to demonstrate the same porosity and well defined structure as coatings. Still, hybrid materials as thin films have found applications within several areas like optical devices,21 photoluminescence,22–24 protective coatings,25 catalysis,21 sensors,21 optoelectronic devices,26–32 field-effect transistors,27,33–36 electroluminescence,37 and light emitting diodes.34
The ALD technique is traditionally considered as a slow technique. However, the growth rates of organic–inorganic hybrid materials produced by ALD are generally notably higher than their corresponding oxides. This enables efficient deposition and facilitates scale-up.
The extensive research performed on MOF materials has shown that the material properties are highly dependent on the type and nature of the organic linker. The current work explores how variations in similar linkers affect the growth, while preserving a backbone of five carbons. Prior to this contribution, a systematic study has been performed on the growth of similar hybrid materials based on ligands with certain functionalities: carboxylic acids with aromatic stabilization and rigid backbones,7 flexible linear carboxylic acid chains,8 and introduction of stabilization of the backbone in the linear carboxylic acid chains and investigation of subsequent cis- and trans-functionality.9 In the present contribution, we compare the results obtained for glutaric acid in ref. 8 with the effect of introducing steric hindrance, multiple reaction centers, varying the rigidness of the backbone, and new types of functional groups on the chain which can enter the reaction. These results can serve as guidelines for designing new organic–inorganic hybrid materials by ALD, thereby reducing the gap towards depositing highly structured MOF thin film materials by ALD.
Results
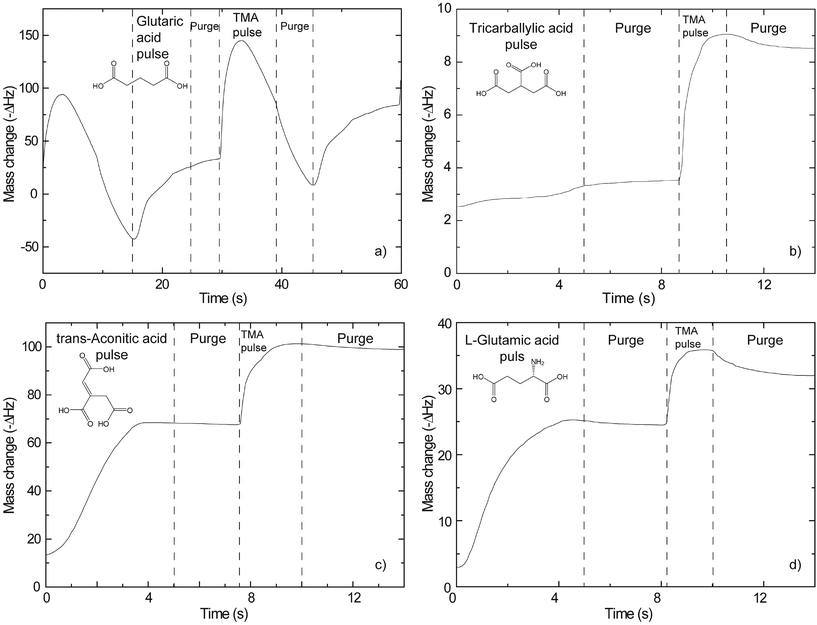
A QCM device is a tool which can offer in situ information on growth dynamics and greatly help in assessing suitable pulse and purge parameters for new systems. Such an analysis relies on the Sauerbrey equation.40 It states a linear relationship between the change in resonance frequency of the crystal and the mass of the deposited material.The results from such investigations are presented in Fig. 1. Regular signs of self-limiting growth are found for the trans-aconitic and L-glutamic acid–TMA systems. What appears to be more complex growth dynamics is observed for the glutaric and tricarballylic acid–TMA systems. The variations in mass in Fig. 1 have not been converted from ΔHz to Δng due to the lack of an adequate calibration sample. The interpretations are therefore based on relative mass variations. The growth parameters extracted from Fig. 1 and the adopted sublimation temperatures for the organic precursors are given in Table 1.
| Pulse/purge (s) | Pulse/purge TMA (s) | T precursor (°C) | |
|---|---|---|---|
| Glutaric acid | 4/1.5 | 1/2 | 115 |
| Tricarballylic acid | 3/0.5 | 0.2/1 | 135 |
| trans-Aconitic acid | 1.2/0.75 | 0.2/0.75 | 114 |
| L-Glutamic acid | 3.5/0.5 | 0.3/0.5 | 165 |
Using the pulse and purge parameters in Table 1, the growth rates of the different systems were investigated as a function of deposition temperature (Fig. 2). The tricarballylic acid–TMA system exhibits a large, temperature independent ALD window in the entire examined growth range (150–350 °C). The growth rates for the L-glutamic, trans-aconitic, and glutaric acid–TMA systems are dependent on the deposition temperature: the growth rates decrease as the deposition temperature increases.
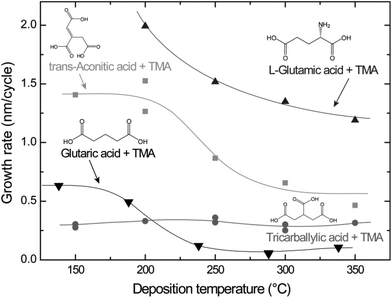 | ||
| Fig. 2 Growth rates as a function of deposition temperature for the L-glutamic, trans-aconitic, glutaric and tricarballylic acid–TMA systems. The data for the glutaric acid–TMA system are obtained from ref. 8. | ||
The variation in density as a function of deposition temperature was calculated based on XRR measurements. The densities show minor variations and remain rather constant upon increasing the deposition temperature (Fig. 3). A slightly elevated density is observed for the tricarballylic–TMA system deposited at 150 °C. It should be noted that the density measurements performed by XRR are associated with some uncertainties due to sensitivity to sample alignment.
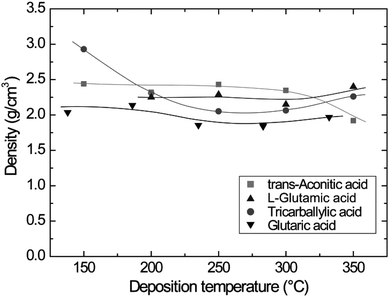 | ||
| Fig. 3 Film density as a function of deposition temperature for the carboxylic acid–TMA systems. The data for the glutaric acid–TMA system are obtained from ref. 8. | ||
The presence of aluminum in the deposited films was verified by XRF measurements.
FTIR analysis of the deposited films may reveal the bonding mode between the functional groups of the organic acids and the aluminium cation. Ex situ analysis may also reveal potential uptake of water from the atmosphere as a function of time or potential gas absorption in porous materials. The absorption characteristics of the FTIR analysis performed in this study are shown in Fig. 5.
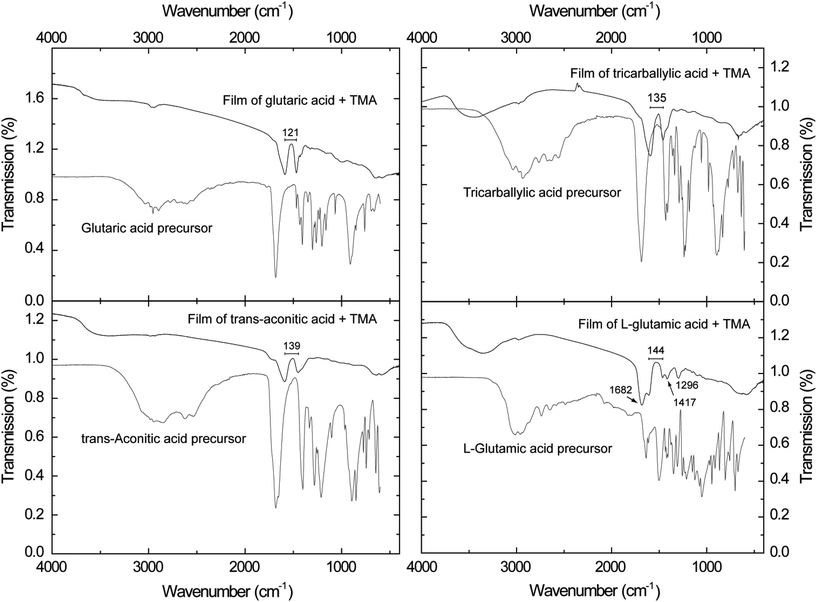 | ||
| Fig. 4 FTIR spectra of hybrid films of the carboxylic acid–TMA systems. The wave number splitting (cm−1) between the asymmetric and symmetric carboxylate bands are given. | ||
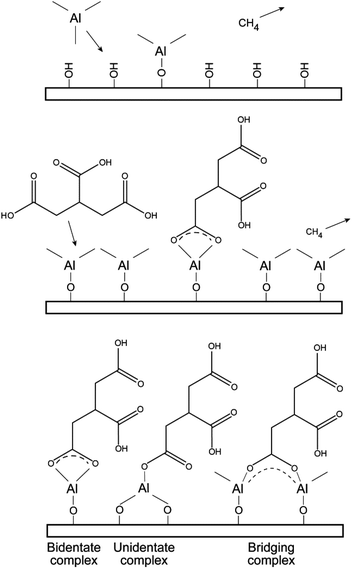 | ||
| Fig. 5 Illustration of possible reaction schemes and resulting bonding situations from the deposition process of the tricarballylic–TMA films. | ||
Broad absorption bands in the range 3700–3000 cm−1 are observed in all films, although rather weak for the glutaric acid–TMA system. These bands are related to OH stretching modes.41,42 The absorption bands are typically quite broad in transmission measurements of solid state samples. In the case of the L-glutamic acid–TMA system, there are also additional stretching bands of the protonated amine group (NH+3) which overlap with the bands from OH stretching modes. In addition, bending bands of the NH+3 can be found at 1682 cm−1 in this system. The small bands found around 3000 cm−1 are related to stretching modes of CH2. Bending modes of this group can be found around 1420 cm−1. In our study this seems to overlap with the symmetric stretch of the carboxylate group, thus leading to peak broadening.41,42
Absorption bands consistent with carboxylate groups are visible in all spectra, i.e. the asymmetric stretch around 1600 cm−1 and the symmetric stretch around 1450 cm−1.41,42 The splitting between the asymmetric and symmetric carboxylate bands is indicated in the respective graphs (Fig. 5). This splitting can offer valuable information on the bonding mode between the functional organic groups and the aluminium cation. A splitting between these bands in the range Δ = 50–150 cm−1 is typical of bidentate complexes, unidentate complexes have a splitting of Δ > 200 cm−1, and bridging complexes have splitting in the range of Δ = 130–200 cm−1.43 Given these guidelines, the glutaric acid–TMA system is likely to be of bidentate complexing type mode. The tricarballylic, trans-aconitic and L-glutamic acid–TMA systems show splitting in the overlapping range between the bidentate and bridging complexes, and hence one bonding mode cannot be excluded at the expense of the other. The CCO stretching mode can be detected around 1300 cm−1, however, this is most clearly pronounced for the L-glutamic–TMA system.
Some possible reaction intermediates and bonding schemes between carboxylic acids and aluminum cations are given in Fig. 5.
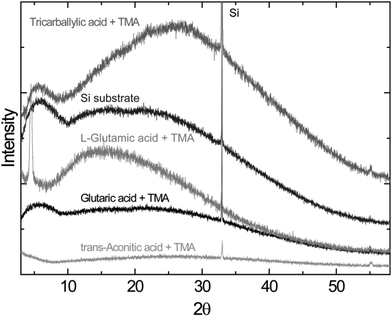
The X-ray diffraction analysis, using the standard θ − 2θ diffraction mode, indicates that the as-deposited films are amorphous, with the exception of the L-glutamic–TMA system. This system exhibits a reflection at ca. 4.5°, Fig. 6.
Most of the deposited films exhibit low surface roughness as measured by AFM. The roughness typically ranges from 0.2 to 0.3 nm (RMS) (Fig. 7), independent of film thickness. This is typical of growth of amorphous materials. On the other hand, the L-glutamic acid–TMA system deposited at 200 °C exhibits rather high surface roughness in comparison.
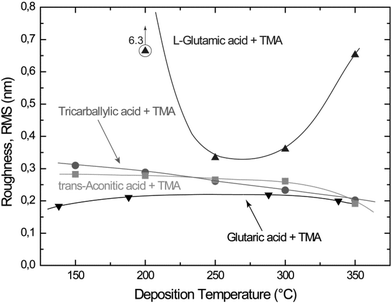 | ||
| Fig. 7 Surface roughness (root mean square, RMS) of thin films with thicknesses from 9 to 80 nm as a function of deposition temperature for the carboxylic acid–TMA systems. The glutaric, tricarballylic acid–TMA systems were deposited during 80 cycles, and the trans-aconitic, L-glutamic acid–TMA systems during 40 cycles. The data for the glutaric acid–TMA system are as presented earlier in ref. 8. | ||
Surface topographies were measured for selected films as-deposited on Si(111) in the temperature range 186–250 °C (Fig. 8). The trans-aconitic, L-glutamic acid–TMA systems deposited at 250 °C show somewhat larger surface features, typically of around 40–60 nm in width, Fig. 8(c) and (d). However, these features may be dependent on the film thickness. Despite this, all systems display smooth surfaces with little surface distinction.
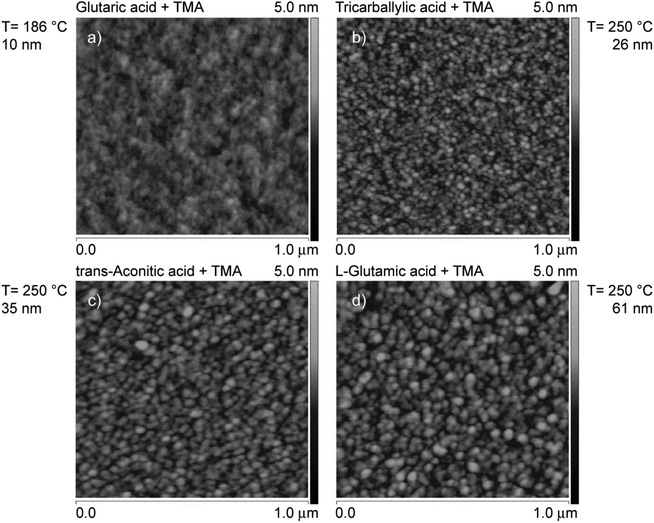 | ||
| Fig. 8 Topography as measured by AFM of films deposited on Si(111) based on TMA and (a) glutaric acid, (b) tricarballylic acid, (c) trans-aconitic acid, and (d) L-glutamic acid. The results of the glutaric acid–TMA system are reproduced from ref. 8. | ||
All films appear to be stable in air. They do not exhibit any measurable changes in thickness as measured by XRR, nor in transparency, color as observed visibly, or in FTIR characteristics, after being exposed to air for one week and also after one year.
The physical properties of the films were investigated via contact angle and UV-Vis spectroscopy measurements. Contact angles of droplets of type 2 water are given in Table 2. Wetting on an aluminum oxide film and a silicon substrate with a native SiOx layer were measured for comparison (Table 2). The aluminum oxide film can be regarded as the inorganic counterpart of these deposited hybrid films. It has a terminating layer of hydrophilic hydroxyl groups, which is assumed to resemble the terminating layer of the organic acids in the deposition processes in this work. The amorphous SiOx layer represents the starting point before deposition of the film. The contact angle is measured in the interior of the water droplet. The tangent is calculated analytically by the circular curve fit of a number of profile points closest to the base line. This is illustrated for the trans-aconitic acid–TMA system in Fig. 9.
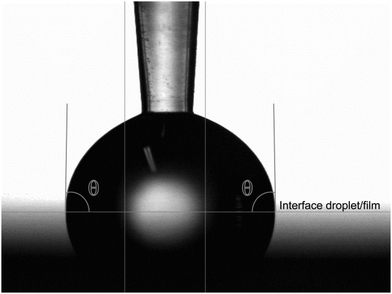 | ||
| Fig. 9 Contact angle between water and the trans-aconitic acid–TMA thin film. The horizontal line indicates the interface between the water droplet and the film surface. | ||
The hydrophobicity of the reported systems seems to be located around the juncture between a hydrophobic and a hydrophilic surface. The hydrophobicity of the L-glutamic acid–TMA system appears to be more shifted towards a hydrophobic surface than the other systems studied. The increased hydrophobicity may be due to the hydrophobic backbone facing outwards from the surface. A potentially contributing factor is the increased surface roughness of these films. Depending on the crystallite orientation within the film with respect to the droplet on the surface, the contact angle can become smaller or larger as compared to a flat surface of the same material. However, such effects are not easily determined.
UV-Vis transmission measurements of films deposited on thin soda-lime glass substrates showed that the glutaric and L-glutamic acid–TMA systems were transparent in the range 200–1000 nm. The tricarballylic and trans-aconitic acid–TMA systems were weakly absorbing in the range 300–400 nm, Fig. 10. The absorbance in the UV-Vis range seems to increase with branching and presence of unsaturated bonds (Fig. 10). However, the addition of a different functional group like an amine group did not affect the adsorption in the UV-Vis range.
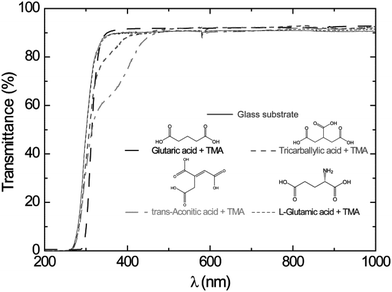 | ||
| Fig. 10 UV-Vis transmission characteristics of as-deposited films on thin soda-lime glass substrates as a function of wavelength. Data for the bare glass substrate are included. The results for the glutaric acid–TMA system are as presented in ref. 8. | ||
Discussion
Growth rates
Typical self-hindered growth can be observed for the trans-aconitic and L-glutamic acid–TMA systems by QCM investigations (Fig. 1). The apparent loss in mass found for the glutaric acid–TMA system has already been discussed in ref. 38. The etching observed for TMA pulse times above 1 s and for glutaric acid pulse times exceeding 4 s is suggested to be the result of the formation of volatile complexes. In the case of the tricarballylic acid–TMA system, the pulse–purge stages progress normally for TMA, while the pulse stage of tricarballylic acid consists of step-wise saturations. Pulse parameters for the tricarballylic acid were chosen based on the first stage of saturation. With these parameters, linear ALD growth was examined and achieved based on observations of up to 300 consecutive deposition cycles. In the same way, linear ALD growth was explored and found for the glutaric acid–TMA system in Fig. 1a.With respect to growth rates, the tricarballylic acid–TMA system shows a temperature independent, stable growth rate throughout a wide ALD window (150–350 °C). The glutaric acid, trans-aconitic, and L-glutamic acid–TMA systems show non-typical ALD windows, where the growth rates depend on the deposition temperature. The decrease in growth rates at higher temperatures may stem from multiple reactions and the formation of volatile complexes that etch the surface, as described in ref. 8. Alternatively, the increased thermal motion of the precursor molecules at higher temperatures may induce increased steric hindrance of the active sites and thereby reduced growth rates. The density of the deposited films is relatively constant (2.0–2.5 g cm−3) for all systems throughout the ALD-window (Fig. 3). This may indicate that the materials generally maintain an amorphous structure throughout the studied temperature range.
Topography
The surface roughness is fairly constant for all systems, but with a slight decrease with increasing deposition temperature. An exception is the L-glutamic acid–TMA system deposited at 200 °C (Fig. 7). The measured topographies by AFM do not show any distinct surface features, except for a slightly increased crystallite size for the trans-aconitic and L-glutamic acid–TMA systems. However, this may be a result of the increased film thickness as compared to the other films displayed in Fig. 8. The generally low and fairly constant surface roughness and lack of distinct surface features correspond to with the overall amorphous character observed by XRD.Structure
The FTIR spectrum of the glutaric acid–TMA system shows very weak OH absorption bands in the range 3700–3200 cm−1 (Fig. 4). OH bands absorb strongly in the IR-range, and hence, the technique is a sensitive detection tool for such groups. The low signal from the OH bands and the observed carboxylate group signals in this system indicate that most of the OH groups in the carboxylic acid have undergone reactions with TMA. The current observation of weak OH bands could alternatively be ascribed to some absorbed water in the films upon exposure to air. However, this cannot be resolved due to the resolution of the spectra. The FTIR spectra for the tricarballylic and trans-aconitic acid–TMA systems show, however, significant OH bands in the range 3700–3000 cm−1 (Fig. 4). These acids have three acid groups available. The stronger OH absorption bands, as compared to the non-branched glutaric acid, could indicate still unreacted acid groups, most likely caused by steric hindrance. However, there are no strong absorption bands around 1710–1690 cm−1, where one expects to find absorption due to unreacted carboxylic acids.42 Nor is there any observable correlation with the absorption bands found for the unreacted acid precursors given as a reference. An alternative explanation could be absorbed water upon air exposure; however, no significant increase in thickness or density was observed by XRR.The FTIR spectrum of the L-glutamic–TMA system increases slightly in complexity due to the introduction of the amine group. The observed absorption bands are somewhat more resolved than for the other systems, allowing for more careful peak assignments. The observed signal from protonated amine groups (NH+3) can be due to the formation of hydrogen bonds with unreacted OH groups on the surface. It can also be a result of bonds formed with absorbed water from the atmosphere. There is also the possibility that the amine group could enter reaction with the Al cation. However, given the absorption intensities and resolution of the bands in these spectra, it is not possible to identify absorption bands from neither Al–O bonds nor Al–N bonds. The acid group is potentially more reactive towards the cation than the amine group. Additionally, the peak positions of the carboxylate groups in the amino acid system are very similar to what is found for carboxylic acids materials. Given these findings, it is likely to conclude that the acid groups are the preferred reaction sites for reaction with the cation.
A special situation occurs when the L-glutamic acid–TMA system is deposited at 200 °C, with a growth rate of 2.0 nm per cycle. The length of the L-glutamic acid and aluminium cation is only approximately 1 nm in total. This means that a dimerization of the L-glutamic acid or a type of complexation or stacking of two acid molecules within one layer is necessary to explain the observed growth rate. However, dimerization bands are not likely to be intense enough to be observed in these spectra. The observed peak at approximately 4.5° in the θ − 2θ X-ray diffraction pattern for a sample deposited at 200 °C is interesting. This corresponds to a d-value of 19.9 Å, indicating an Al–Al sheet distance which is surprisingly close to the observed growth rate per cycle. The observed surface roughness for this system at 200 °C is also high as measured by AFM. All these observations taken together suggest the formation of a sheet-like structure within the film with an interplanary sheet distance of 20 Å when this system is deposited at 200 °C. This could be one of the first organic–inorganic hybrid materials deposited by ALD to show a type of ordered structure as-deposited.
Experimental
Thin films were deposited in an F-120 Sat reactor (ASM Microchemistry Ltd) using TMA (Witco, 98%) and the linear carboxylic and amino acids: glutaric (Aldrich, ≥99%), tricarballylic (Aldrich, 99%), trans-aconitic (Aldrich, 98%), and L-glutamic acids (Fluka, ≥99.0%) as precursors (Fig. 11). The glutaric acid–TMA system reported in ref. 38 is also included here for systematic comparisons.During the ALD depositions, a background pressure of ca. 3 mbar was maintained by applying a N2 carrier gas flow of 300 cm3 min−1. The inert gas was produced in a Schmidlin UHPN3001 N2 purifier with a claimed purity of 99.999% with respect to N2 and Ar content.
The films were deposited on soda-lime glass and Si(111) single crystal substrates (SVMI Inc.). The Si(111) substrates were used as obtained from the manufacturer, whereas the soda-lime glass substrates were cleaned with ethanol.
The growth dynamics were examined by means of quartz crystal microbalance (QCM) measurements using a Maxtek TM400 unit and homemade crystal holders. In order to increase the accuracy of the QCM measurements, the data were post-processed by averaging 16 succeeding deposition cycles. The growth was studied as a function of deposition temperature for the relevant deposition windows of the organic precursors. In total, the range of 138–350 °C was covered.
The crystallinity of the films was examined by X-ray diffraction (XRD) using a Siemens D5000 diffractometer equipped with a single crystal Ge monochromator (Johannson-type). This setup provides high purity Cu Kα1 radiation for conventional θ − 2θ diffraction. X-ray reflectivity (XRR) was also measured using a Siemens D5000 diffractometer. This diffractometer is equipped with a Göbel-mirror which provides parallel, high intensity Cu Kα radiation. X-ray fluorescence (XRF) was used to validate the presence of aluminium in the films. The measurements were performed on a Philips PW2400, and the measured XRF-intensities were analyzed using the UniQuant software.39
Selected films deposited on Si(111) substrates were analysed with Fourier transform infrared (FTIR) transmission spectroscopy using a Bruker VERTEX 80 FTIR spectrometer. For these measurements, an uncoated Si(111) substrate was used as a reference. On occasions where the film functioned as an anti-reflection coating, transmissions above 100% were observed.
The topography of a representative selection of films was studied with atomic force microscopy (AFM) in tapping mode using a Dimension 3100 with a Nanoscope IIIa controller and NSC35/AlBS Si 10 nm tips from Micromasch. Contact angle measurements were performed using a ramé-hart Contact Angle Goniometer with the DROPimage analysis program (standard edition) version 2.4. The measurements were performed using the static sessile drop method and repeated at three different positions on each sample. At each spot, 1 μL of water was pulsed out 12–15 times. This ensured error values of less than 0.1° for each measurement. The samples were treated in the same way with regard to exposure time to air and measurements were done at room temperature. UV-Vis transmission measurements were performed using a Shimadzu UV-3600 spectrophotometer.
Conclusions
Thin films of organic–inorganic hybrid materials were successfully grown using glutaric, tricarballylic, trans-aconitic, and L-glutamic linear carboxylic and amino acids and trimethylaluminum (TMA). Some effects related to branching and addition of double bonds and different types of functional groups to the linear acids were explored. The QCM measurements indicate self-limiting growth dynamics. An ideal ALD window was observed for the tricarballylic acid–TMA system. Temperature dependent ALD windows were found for the glutaric, trans-aconitic, and L-glutamic–TMA systems. The films are generally X-ray amorphous, smooth and stable in contact with water. However, the L-glutamic–TMA system displayed signs of formation of a sheet-like structure when deposited at 200 °C.This study has investigated a potential route to gain structural control in organic–inorganic hybrid thin film materials. The introduction of branching or double bonds seems to push the reaction mode from bidentate more towards bridge-complexing mode. It also seems likely that this introduces more stiffness in the material, which may affect the structural and surface properties of the material. Combinations of different functional groups, here amine and acid groups, seem to induce higher structural order in the material, as observed by both XRD and FTIR, and more pronounced surface properties. In the L-glutamic acid–TMA system, the degree of hydrophobicity of the surface is approaching Gore-Tex®. It may be one of the first organic–inorganic hybrid materials deposited by ALD to show a type of ordered structure.
Acknowledgements
This work has received financial support from the FUNMAT@UiO effort and the Centre for Materials Science and Nanotechnology, University of Oslo, Norway. The authors are indebted to Professor Claus Jørgen Nielsen (University of Oslo) and Ingvil Gausemel (GE Healthcare) for help and discussions concerning FTIR measurements, and Professor Finn Knut Hansen (University of Oslo) for aid with contact angle measurements.Notes and references
- A. I. Abdulagatov, R. A. Hall, J. L. Sutherland, B. H. Lee, A. S. Cavanagh and S. M. George, Chem. Mater., 2012, 24, 2854–2863 CrossRef CAS.
- A. A. Dameron, D. Seghete, B. B. Burton, S. D. Davidson, A. S. Cavanagh, J. A. Bertrand and S. M. George, Chem. Mater., 2008, 20, 3315–3326 CrossRef CAS.
- S. M. George, B. H. Lee, B. Yoon, A. I. Abdulagatov and R. A. Hall, J. Nanosci. Nanotechnol., 2011, 11, 7948–7955 CrossRef CAS PubMed.
- S. M. George, B. Yoon and A. A. Dameron, Acc. Chem. Res., 2009, 42, 498–508 CrossRef CAS PubMed.
- B. Gong, Q. Peng and G. N. Parsons, J. Phys. Chem. B, 2011, 115, 5930–5938 CrossRef CAS PubMed.
- S. Ishchuk, D. H. Taffa, O. Hazut, N. Kaynan and R. Yerushalmi, ACS Nano, 2012, 6, 7263–7269 CrossRef CAS PubMed.
- K. B. Klepper, O. Nilsen and H. Fjellvag, Dalton Trans., 2010, 39, 11628–11635 RSC.
- K. B. Klepper, O. Nilsen, P.-A. Hansen and H. Fjellvag, Dalton Trans., 2011, 40, 4636–4646 RSC.
- K. B. Klepper, O. Nilsen, T. Levy and H. Fjellvag, Eur. J. Inorg. Chem., 2011, 34, 5305–5312 CrossRef.
- X. Liang, D. M. King, P. Li, S. M. George and A. W. Weimer, AIChE J., 2009, 55, 1030–1039 CrossRef CAS.
- O. Nilsen and H. Fjellvåg, WO2006071126, 2006 Search PubMed.
- O. Nilsen, K. B. Klepper, H. Ø. Nielsen and H. Fjellvåg, ECS Trans., 2008, 16, 3–14 CAS.
- Q. Peng, B. Gong, R. M. VanGundy and G. N. Parsons, Chem. Mater., 2009, 21, 820–830 CrossRef CAS.
- A. Sood, P. Sundberg, J. Malm and M. Karppinen, Appl. Surf. Sci., 2011, 257, 6435–6439 CrossRef CAS PubMed.
- B. Yoon, J. L. O'Patchen, D. Seghete, A. S. Cavanagh and S. M. George, Chem. Vapor Depos., 2009, 15, 112–121 CrossRef CAS.
- B. Yoon, D. Seghete, A. S. Cavanagh and S. M. George, Chem. Mater., 2009, 21, 5365–5374 CrossRef CAS.
- A. Sood, P. Sundberg and M. Karppinen, Dalton Trans., 2013, 42, 3869–3875 RSC.
- L. D. Salmi, M. J. Heikkilä, E. Puukilainen, T. Sajavaara, D. Grosso and M. Ritala, Microporous Mesoporous Mater., 2013, 182, 147–154 CrossRef CAS PubMed.
- D. Bradshaw, Chem. Soc. Rev., 2012, 41, 2344 RSC.
- O. Shekhah, J. Liu, R. A. Fischer and C. Wöll, Chem. Soc. Rev., 2011, 40, 1081 RSC.
- A. Bétard and R. A. Fischer, Chem. Rev., 2012, 112, 1055–1083 CrossRef PubMed.
- D. Bersani, P. P. Lottici, M. Casalboni, A. Bétard, R. A. Fischer and P. Prosposito, Mater. Lett., 2001, 51, 208–212 CrossRef CAS.
- Y. H. Li, H. J. Zhang, S. B. Wang, Q. G. Meng, H. R. Li and X. H. Chuai, Thin Solid Films, 2001, 385, 205–208 CrossRef CAS.
- Z. Y. Cheng, H. F. Wang, Z. W. Quan, C. K. Lin, J. Lin and Y. C. Han, J. Cryst. Growth, 2005, 285, 352–357 CrossRef CAS PubMed.
- K. H. Haas, S. Amberg-Schwab, K. Rose and G. Schottner, Surf. Coat. Technol., 1999, 111, 72–79 CrossRef CAS.
- Z.-L. Xiao, H.-Z. Chen, M.-M. Shi, G. Wu, R.-J. Zhou, Z.-S. Yang, M. Wang and B.-Z. Tang, Mater. Sci. Eng., B, 2005, 117, 313–316 CrossRef PubMed.
- C. R. Kagan, D. B. Mitzi and C. D. Dimitrakopoulos, Science, 1999, 286, 945–947 CrossRef CAS.
- C.-C. Chang and W.-C. Chen, Chem. Mater., 2002, 14, 4242–4248 CrossRef CAS.
- A. Kobayashi, H. Naito, Y. Matsuura, K. Matsukawa, S. Nihonyanagi and Y. Kanemitsu, J. Non-Cryst. Solids, 2002, 299–302, 1052–1056 CrossRef CAS.
- E. J. Nassar, R. R. Gonçalves, M. Ferrari, Y. Messaddeq and S. J. L. Ribeiro, J. Alloys Compd., 2002, 344, 221–225 CrossRef CAS.
- B. Darracq, F. Chaput, K. Lahlil, J.-P. Boilot, Y. Levy, V. Alain, L. Ventelon and M. Blanchard-Desce, Opt. Mater., 1998, 9, 265–270 CrossRef CAS.
- M. Minelli, M. G. De Angelis, F. Doghieri, M. Marini, M. Toselli and F. Pilati, Eur. Polym. J., 2008, 44, 2581–2588 CrossRef CAS PubMed.
- B. H. Lee, K. H. Lee, S. Im and M. M. Sung, J. Nanosci. Nanotechnol., 2009, 9, 6962–6967 CAS.
- K. Chondroudis and D. B. Mitzi, Chem. Mater., 1999, 11, 3028–3030 CrossRef CAS.
- D. B. Mitzi, C. D. Dimitrakopoulos and L. L. Kosbar, Chem. Mater., 2001, 13, 3728–3740 CrossRef CAS.
- D. B. Mitzi, K. Chondroudis and C. R. Kagan, Inorg. Chem., 1999, 38, 6246–6256 CrossRef CAS PubMed.
- M. Era, S. Morimoto, T. Tsutsui and S. Saito, Appl. Phys. Lett., 1994, 65, 676–678 CrossRef CAS PubMed.
- K. B. Klepper, O. Nilsen, P.-A. Hansen and H. Fjellvag, Dalton Trans., 2011, 40, 4636–4646 RSC.
- UniQuant, Omega Data Systems, NL-5505 Veldhoven, The Netherlands, 1994 Search PubMed.
- G. Sauerbrey, Z. Phys., 1959, 155, 206–222 CrossRef CAS.
- R. M. Silverstein, F. X. Webster and D. J. Kiemle, in Spectrometric Identification of Organic Compounds, ed. S. Wolfman-Robichaud, John Wiley & Sons Inc., Hoboken, NJ, 7th edn, 2005, pp. 72–126 Search PubMed.
- H. F. Shurvell, in Handbook of Vibrational Spectroscopy - Sample Characterisation and Spectral Data Processing, ed. J. M. Chalmers and P. R. Griffiths, John Wiley & Sons Ltd, Chichester, UK, 2002, vol. 3, pp. 1783–1816 Search PubMed.
- F. Verpoort, T. Haemers, P. Roose and J. P. Maes, Appl. Spectrosc., 1999, 53, 1528–1534 CrossRef CAS.
- R. M. Pashley and M. E. Karaman, Applied Colloid and Surface Chemistry, John Wiley & Sons Ltd., Chichester, UK, 2004, pp. 28–33 Search PubMed.
| This journal is © The Royal Society of Chemistry 2014 |

