 Open Access Article
Creative Commons Attribution 3.0 Unported Licence
Poly(lactic acid) nanoparticles of the lead anticancer ruthenium compound KP1019 and its surfactant-mediated activation
Britta
Fischer
a,
Petra
Heffeter
bc,
Kushtrim
Kryeziu
bc,
Lars
Gille
d,
Samuel M.
Meier
ac,
Walter
Berger
bc,
Christian R.
Kowol
*ac and
Bernhard K.
Keppler
ac
aInstitute of Inorganic Chemistry, University of Vienna, Waehringer Str. 42, 1090 Vienna, Austria. E-mail: christian.kowol@univie.ac.at; Fax: +43-1-4277-52680; Tel: +43-1-4277-52609
bInstitute for Cancer Research and Comprehensive Cancer Center, Medical University Vienna, Borschkegasse 8a, 1090 Vienna, Austria
cResearch Platform “Translational Cancer Therapy Research”, University of Vienna and Medical University of Vienna, Vienna, Austria
dMolecular Pharmacology and Toxicology Unit, Department of Biomedical Sciences, University of Veterinary Medicine Vienna, Veterinaerplatz 1, 1210 Vienna, Austria
First published on 11th October 2013
Abstract
Nanoparticle formulations offer besides the advantage of passive drug targeting also the opportunity to increase the stability of drugs. KP1019 is a lead ruthenium(III) compound which has been successfully tested in a clinical phase I trial. However, it is characterized by low stability in aqueous solution especially at physiological pH. To overcome this limitation, poly(lactic acid) (PLA) nanoparticles of KP1019 with two different surfactants (Pluronic F68 and Tween 80) were prepared by a single oil-in-water (o/w) emulsion. Cytotoxicity measurements comparing different aged Tween 80 nanoparticles revealed that the color change from brown to green was associated with an up to 20 fold increased activity compared to “free” KP1019. Further investigations suggested that this is based on the formation of enhanced intracellular reactive oxygen species levels. Additional studies revealed that the origin of the green color is a reaction between KP1019 and Tween 80. Kinetic studies of this reaction mixture using UV-Vis, ESI-MS and ESR spectroscopy indicated on the one hand a coordination of Tween 80 to KP1019, and on the other hand, the color change was found to correlate with a reduction of the Ru(III) center by the surfactant. Together, the results provide a first experimental approach to stabilize a biologically active Ru(II) species of KP1019 in aqueous solution, which probably can be also used to selectively generate this activated species in the tumor tissue via delivery of KP1019 using Tween 80 nanoparticles.
Introduction
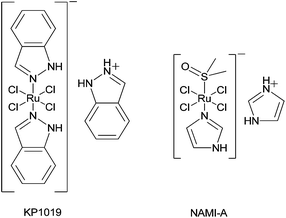
Ruthenium compounds are the most promising non-platinum candidates for metal-based cancer therapy due to their multiple accessible oxidation states and slow ligand exchange kinetics, which are similar to platinum.1,2 Currently, there are two ruthenium drugs under clinical evaluation as anticancer agents: NAMI-A (imidazolium trans-[tetrachlorido(1H-imidazole)(S-dimethylsulfoxide)-ruthenate(III)]) and KP1019/KP1339 (indazolium/sodium trans-[tetrachloridobis(1H-indazole)ruthenate(III)]) (Fig. 1).Notably, NAMI-A was shown to exhibit mainly anti-metastatic potential, while being widely ineffective against primary tumors.3 In contrast, KP1019 possesses excellent antitumor activity against primary tumors. In a pilot phase I study treatment with KP1019 resulted in disease stabilization for 8–10 weeks in five of six patients with only mild treatment-related toxicities.4,5 With regard to the mode of action of KP1019, it is assumed that once administered intravenously the ruthenium drug tightly binds to plasma proteins (albumin and transferrin) which transport the drug into the solid tumor tissue. There it is activated by reduction resulting in the active Ru(II) species, which features a high reactivity towards biomolecules.6 However, also in its +III oxidation state KP1019 possesses a high general reactivity with regard to the M–Cl bond, which results in low stability in aqueous solution, especially at physiological pH. Consequently, it is of high interest to develop new KP1019 formulations with improved stability.
Nanoparticle formulations offer besides high stability also the advantage of facilitated uptake into cells by endocytosis and passive targeting of the malignant tissue by the enhanced permeability and retention (EPR) effect.7 This enhanced accumulation of nanoparticles is based on leaky, defective, and abnormal blood vessels originating from tumor cell-induced angiogenesis together with an absent or defective lymphatic drainage.8
The requirements for an ideal polymer-based drug carrier are: biodegradability, biocompatibility, and the lack of toxicity. Thus, the most frequently used synthetic polymers are poly(lactic acid) (PLA), poly(glycolic acid) (PGA) and their copolymer, poly(lactide-co-glycolide) (PLGA).9 In the body, PLA and PGA are hydrolyzed and decomposed to their monomeric components lactic acid and glycolic acid. Since these monomers occur also physiologically as by-products of several metabolic pathways, there is no systemic toxicity associated with their use as nanoparticulate drug delivery systems.10 As a consequence, both polymers have already been approved by the US Food and Drug Administration (FDA) as therapeutic drug carriers.11 Additionally, a surfactant is frequently added to the nanoparticle preparation to enhance its physical stability and to provide specific size, geometrical control, and stabilization of particulate assemblies.12 The most commonly used surfactants are poloxamers, polysorbates, and poly(vinyl alcohol) (PVA). However, for PVA a potential carcinogenic activity has been reported.13 Thus, poloxamers (Pluronic F68) and polysorbates (Tween 80) are currently considered the ideal surfactants for nanoparticle preparations and are frequently used in food and pharmaceutical preparations.14
Recently, we presented a first attempt to prepare a nanoformulation of KP1019 using PEGylated polymeric micelles,15 which distinctly enhanced the cellular uptake of KP1019 and, consequently, its anticancer activity. However, due to the preparation procedure these nanocarriers were characterized by a rather high dimethylsulfoxide (DMSO) content and a low KP1019/polymer ratio, which are both problematic for further (pre)clinical development. Consequently, biodegradable PLA nanoparticles of KP1019 with different surfactants (Tween 80 and Pluronic F68) were investigated in this study and the biological activity of the particles was evaluated.
Results and discussion
Synthesis of nanoparticles
In order to produce KP1019-loaded particles in the nanometer scale by oil-in-water (o/w) emulsions the nanoprecipitation method was used, which is highly convenient for encapsulation of lipophilic drugs.16 Tween 80 and Pluronic F68 were used as surfactants to generate a stable nano-suspension. Briefly, the encapsulation of KP1019 was carried out using acetone solutions of PLA and KP1019, which were added to an aqueous solution of the surfactants (Tween 80 or Pluronic F68). After brief stirring the organic solvent was evaporated under reduced pressure and the resulting suspensions were concentrated. For both surfactants brown suspensions were obtained, suggesting that KP1019 was kept in its original state. For the Tween 80 nanoparticles (TWNP) no settling of particles could be observed for 25 days at 4 °C, indicating stable nanoparticle formation without agglomeration. However, a distinct change in color from brown to green was visible after about 7 days, indicating a chemical modification of KP1019. This color change was not observed for Pluronic F68 nanoparticles [PLNP; 0.1% (w/v)]. However, a brown precipitate was already observed after ∼15 h, indicating that KP1019 diffuses out of PLNP. Increasing the amounts of surfactant [0.2–0.4% (w/v)] did not result in significant improvements regarding color change or drug encapsulation in the case of TWNP or PLNP, respectively. Thus, all further investigations were done using 0.1% (w/v) surfactant to keep the amount of organic material at a minimum.Particle characterization
The mean particle size obtained for TWNP was 164 ± 6 nm and for PLNP was 163 ± 1 nm. This is ideal as particles <300 nm have a prolonged plasma half-life and are characterized by enhanced tumor accumulation via the EPR effect.17 The polydispersity indices (PDI) of all particles were <0.15 indicating a mono-disperse size distribution.The electrostatic repulsion of the particle surfaces (zeta potential) was determined in order to gain insights into the surface charge of the new nanoparticles. In the case of TWNP, values around −39 ± 1 mV were found, whereas PLNP possessed surface charges of −24 ± 1 mV. Notably, for PLA nanoparticles prepared without a surfactant a zeta potential of −49 mV was reported.18 The decreased surface charge of TWNP and PLNP can be explained by capping of the terminal carboxylic acid groups of PLA by the surfactants.
Transmission electron microscopy (TEM) measurements were carried out to investigate the morphology of the particles and whether KP1019 is effectively encapsulated in the nanoparticles. Fig. 2 shows two representative micrographs of TWNP and PLNP, revealing that both particle types have a spherical shape. The TWNP has a high contrast throughout the whole particle, suggesting that KP1019 is encapsulated in the polymer matrix. However, the TEM-images of PLNP displayed only low contrast and several small black dots with high contrast (<1 nm size, red squares in Fig. 2B) were found in the surroundings, which very likely result from the ruthenium signal of the non-encapsulated KP1019. Thus, the TEM images indicated a higher encapsulation efficiency of KP1019 in TWNP compared to PLNP, which in turn also seem to leak KP1019. Consequently, all further investigations were performed with TWNP.
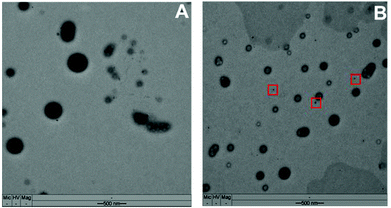 | ||
| Fig. 2 Transmission electron microscopy (TEM) image of KP1019-loaded (A) TWNP and (B) PLNP (the red squares indicate non-encapsulated KP1019). | ||
After successful determination of the optimal formulation parameters for TWNP, the reproducibility of the preparation concerning particles size and drug loading efficiency was investigated by analyzing three independent batches. The mean particle size distributions are depicted in Fig. 3 indicating a high size reproducibility with a mean diameter of 164 ± 10 nm (all PDI values were <0.15). In addition, the size-dependent long term stability (25 days) of TWNP was investigated by DLS measurements, revealing no significant size changes during one month regardless of the particle color (data not shown).
 | ||
| Fig. 3 Reproducibility of the size distribution of TWNP by preparation of three independent batches, each measured three times. | ||
ICP-MS experiments were performed to evaluate the drug loading efficiency by determination of the absolute ruthenium content (Table 1). In the above described batches, the amount of encapsulated ruthenium ranged from 92 to 95% with respect to the initial total amount, indicating very high reproducibility and drug loading efficiency.
| Initial amount of KP1019 [μmol] | Detected amount of ruthenium [μmol] | Entrapment efficiency [%] |
|---|---|---|
| 2.5 | 2.3 | 92 |
| 2.5 | 2.4 | 95 |
| 2.5 | 2.4 | 95 |
Cytotoxicity in human cancer cell lines
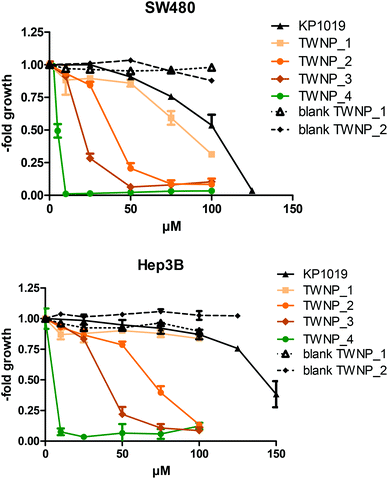
In order to evaluate the antitumor activity of TWNP, the growth inhibitory effects were studied in comparison to “free” KP1019 and blank nanoparticles (blank TWNP). The cell viability was assessed by MTT assay in the colon carcinoma SW480 and the hepatoma Hep3B cell line after 72 h of drug incubation. TWNP (brown and green) at different storage times (ranging from 2 h to 5 days) and temperatures [stored either at 4 °C or at room temperature (∼25 °C)] were investigated (Fig. 4 and Table 2). | ||
| Fig. 4 Nanoparticles used to evaluate the antitumor activity: (A) TWNP_3 (5 days, 4 °C); (B) TWNP_2 (24 h, 4 °C); (C) TWNP_4 (24 h, 25 °C); (D) TWNP_1 (2 h, 25 °C); (E) blank TWNP. | ||
| Storage conditions | IC50 [μM] | ||||
|---|---|---|---|---|---|
| Time | Temperature | Color | SW480 | Hep3B | |
| KP1019 | Brown | 101.1 ± 4.9 | 141.8 ± 8.1 | ||
| TWNP_1 | 2 h | 25 °C | Brown | 82.9 ± 4.1 | ≫100 |
| TWNP_2 | 24 h | 4 °C | Brown | 41.5 ± 4.8 | 67.3 ± 0.3 |
| TWNP_3 | 5 d | 4 °C | Brown | 19.8 ± 0.1 | 38.7 ± 1.7 |
| TWNP_4 | 24 h | 25 °C | Green | 5.2 ± 0.4 | 5.5 ± 0.3 |
| Blank TWNP_1 | 1 month | 4 °C | White | ≫100 | n.a. |
| Blank TWNP_2 | 2 h | 25 °C | White | ≫100 | ≫100 |
The experiments revealed that the nanoparticle formulations of KP1019 in general showed higher cytotoxicity than “free” KP1019 (Table 2, Fig. 5). Surprisingly, longer storage especially at room temperature distinctly increased the activity of the KP1019-loaded particles. This effect was most pronounced for the green TWNP_4 (24 h, 25 °C), where a 20-fold increased activity was found in comparison to “free” KP1019. In contrast, the brown TWNP_1 (2 h, 25 °C) displayed only a slightly higher cytotoxicity than “free” KP1019. This suggests that the reaction leading to green color of the nanoparticles is associated with drastic increase in activity. These effects are not based on the particles itself as the blank TWNP was inactive in these experiments (Fig. 5). Moreover, no enhanced cellular ruthenium uptake of TWNP_1 and TWNP_4 was detected by ICP-MS measurements (data not shown), which is in contrast to the higher uptake of the previously published KP1019-containing polymeric micelles.15
To evaluate whether this increased activity of TWNP_4 is based on reactions of KP1019 with single nanoparticle components, KP1019 was mixed with PLA or Tween 80 separately. In the case of PLA, no color change was observable upon incubation with KP1019, even after longer time periods. In contrast, the KP1019/Tween 80 solution (TW1019) showed a change to green color comparable to TWNP after 24 h at room temperature. Subsequent MTT assays showed that the cytotoxicity of the green TW1019 (IC50 value of 3.0 ± 0.1 μM in SW480 cells) was comparable to green TWNP_4. These results suggest that the higher cytotoxic activity of TWNP_4 originates from a reaction of KP1019 with Tween 80.
Production of intracellular reactive oxygen species (ROS)
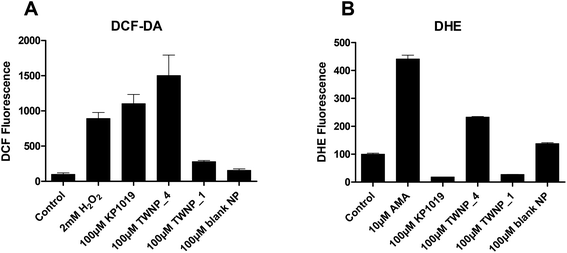
Microscopical examinations indicated that the new nanoparticles lead to very rapid cell death induction within several hours. Therefore, we hypothesized that increased ROS production might be involved in the enhanced activity of the new nanoparticles, in particular TWNP_4. The cell-permeable, fluorescent dye DCF-DA (2′,7′-dichlorofluorescein diacetate) was used for the detection of intracellular H2O2, and other ROS such as OH˙ and ROO˙.19Fig. 6A shows the changes in intracellular ROS levels after 30 min drug treatment. In accordance with previously published data,20 treatment with KP1019 as well as with the positive control H2O2 led to a distinct increase in the intracellular fluorescence levels. Notably, the ROS production of the strongly cytotoxic TWNP_4 was even higher than that of KP1019, while brown TWNP_1 was distinctly less active.To assess whether the nanoparticle formulation also leads to generation of superoxide radicals (O2˙−), DHE assays were performed. Interestingly, again treatment with green TWNP_4 resulted in increased levels of intracellular superoxide radicals (Fig. 6B), while both, “free” KP1019 and brown TWNP_1, reduced the spontaneous intracellular O2˙− amount. The blank TWNP had only minor effects in both ROS assays. Together these results reveal that TWNP_4 generated enhanced levels of oxidative stress (compared to TWNP_1 and “free” KP1019), which might explain its pronounced effects on the cell viability observed in MTT assays.
Together, the biological data strongly suggest that the color change is accompanied by the formation of ROS in the biological environment, which are responsible for the high cytotoxicity of green TWNP_4. Moreover, the high activity of TW1019 indicates that this effect originates from a reaction between KP1019 and Tween 80.
Characterization of the interaction between KP1019 and Tween 80
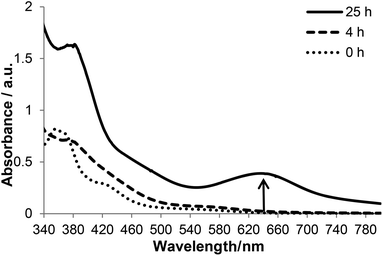
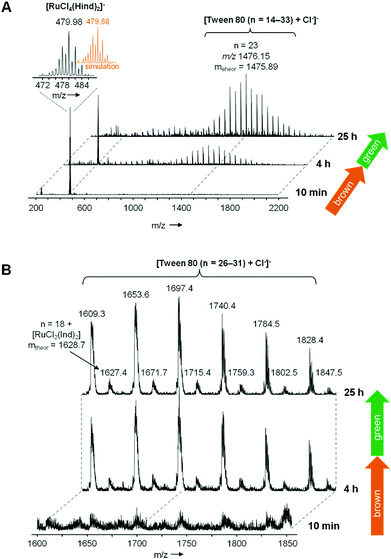
To gain further insights into the interaction of KP1019 and Tween 80, we carried out kinetic studies on TW1019 using UV-Vis and electrospray ionization mass spectrometry (ESI-MS) as well as ESR spectroscopy experiments after incubation at 37 °C. The UV-Vis absorption spectra of TW1019 revealed the first changes already after 4 h (Fig. 7) indicating the formation of a new species of KP1019. The color change from brown to green was clearly visible after ∼24 h of incubation indicated by the appearance of a new signal at 645 nm (Fig. 7). In addition, the solutions were also investigated by ESI MS, since mass spectrometry has proven to be a powerful tool to analyze the reactions of metal complexes in aqueous solution on the molecular level.21 The freshly prepared TW1019 revealed only one signal in the negative ion mode corresponding to [RuCl4(Hind)2]− (m/z 479.98, mtheor = 479.88; Hind = indazole) proving the presence of unreacted KP1019 (Fig. 8A). Chloride adducts of Tween 80 with n = 14–33 (n is the number of ethylene glycol units) were detected only after 4 h of incubation in the negative ion mode. This is of interest as such non-specific adducts can only be generated after a Ru–Cl dissociation reaction. In addition, a small population of KP1019–Tween 80 adducts was detected (Fig. 8B).After 25 h of incubation the mass signals corresponding to KP1019 vanished completely (Fig. 8A). However, in these measurements the KP1019–Tween 80 signals were not increased and no additional signals could be detected in the positive ion mode. This suggested that the color change from brown to green is not a result of the simple exchange of one chlorido ligand of KP1019 by Tween 80 and it can be assumed that a non-ionizable molecule is formed, which is not suitable for ESI-MS detection, probably due to a change in the oxidation state of the metal center.
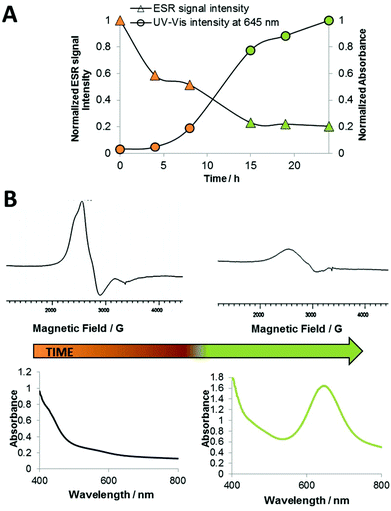
Thus, the TW1019 solution was additionally investigated by ESR spectroscopy simultaneously with UV-Vis. TW1019 exhibited a broad unresolved ESR signal centered at g = 2.5 (Fig. 9B), which is in the expected range for Ru(III) d5 low spin complexes.22 The time-dependent measurements (Fig. 9) revealed a strong decrease of the overall ESR signal intensity within 24 h accompanied with a continuous increase of the UV-Vis signal at 645 nm. The distinct decrease in the ESR intensity suggests that the oxidation state of the paramagnetic Ru(III) metal center in KP1019 changed to a diamagnetic Ru(II) center.23 This can presumably be explained by the well-known autoxidation of polysorbates like Tween 80, which can be catalyzed by transition metals under simultaneous reduction of the metal ion.24 In comparison, no decrease in the ESR signal intensity (centered around g = 2.5) for 24 h was observed for a Tween 80 solution containing KP418 (imidazolium trans-[RuCl4(1H-imidazole)2]) the imidazole analogue of KP1019. This difference can be explained by the distinctly lower reduction potential of KP418 (−0.25 V vs. NHE) compared to KP1019 (+0.03 V vs. NHE)25 and further supports the assumption of reduction of TW1019 by Tween 80.
Conclusion
Nanoparticle formulations offer the opportunity to enhance the stability and tumor-targeting effects of anticancer drugs. However, there are several parameters which have to be considered for successful clinical development. Besides reproducibility and biocompatibility, also the use of appropriate solvents and polymer/drug ratios has to be optimized. Consequently, the here presented study aimed at developing a new nanoparticle formulation of KP1019 with improved properties with regard to in vivo applicability. Our studies revealed that the choice of the surfactant directly influences the encapsulation efficiency and nanoparticle retention of KP1019. In contrast to Pluronic F68, Tween 80 was able to prevent drug precipitation at drug doses necessary for in vivo application and allowed reproducible preparation of KP1019-containing nanoparticles. Interestingly, when stored at room temperature (or at storage times >1 week at 4 °C), a distinct color change of the particles from brown to green was observed, which was accompanied by a greatly enhanced cytotoxicity (∼20-fold). Subsequent spectroscopic analyses revealed that this is based on interactions of KP1019 with Tween 80. The reaction is characterized by conjugation of Tween 80 to KP1019 by replacement of one chlorido ligand after 4 h at 37 °C. On the other hand, reduction of the ruthenium(III) center occurs within 24 h which can be visually determined by the appearance of the deep green color.Besides its possible implication on the functionality of TWNP, these results are also of interest with regard to the KP1019 chemistry. Due to the instability and insolubility of reaction products in aqueous solutions, the investigation and the proof of the proposed ruthenium(II) species, which is widely accepted as the active species of ruthenium(III) complexes, were difficult so far. Consequently, this study might represent the first description of a stabilized ruthenium(II) species in aqueous solution of KP1019 and its enhanced cytotoxic activity against cancer cells. However, there are still many open questions. For example, the appearance of the green color was not affected by argon or pure oxygen atmosphere. In addition, it was not possible to characterize the exact nature of the newly formed ruthenium(II) species. Nevertheless, our study proves that nanoparticle formulation of KP1019 is a valuable tool to modify the behavior and stability of KP1019 in aqueous solutions. Thus, in vivo analyses regarding the tolerability and tumor-targeting effects of the new KP1019-containing particle are currently ongoing, which will also clarify whether the additional activation of KP1019 by Tween 80 is also reflected by enhanced anticancer activity in vivo.
Experimental procedures
Chemicals
KP1019 was synthesized according to published procedures.26 PLA (MW 75![[thin space (1/6-em)]](https://www.rsc.org/images/entities/char_2009.gif) 000–120
000–120![[thin space (1/6-em)]](https://www.rsc.org/images/entities/char_2009.gif) 000; Sigma Aldrich), Pluronic F68 (MW 8400; Sigma Aldrich, Austria), Tween 80 (MW 1310; Fisher Scientific, Austria) and methanol (HPLC grade, Fisher Scientific, Austria) were used as supplied. MilliQ water was obtained from a Millipore Advantage A10 185 UV Ultrapure Water System (18.2 MΩ; Molsheim, France). All other chemicals were of analytical grade and used without further purification.
000; Sigma Aldrich), Pluronic F68 (MW 8400; Sigma Aldrich, Austria), Tween 80 (MW 1310; Fisher Scientific, Austria) and methanol (HPLC grade, Fisher Scientific, Austria) were used as supplied. MilliQ water was obtained from a Millipore Advantage A10 185 UV Ultrapure Water System (18.2 MΩ; Molsheim, France). All other chemicals were of analytical grade and used without further purification.
Preparation of KP1019-loaded nanoparticles by the nanoprecipitation method
For the preparation of the nanoparticles the nanoprecipitation method was used.27 First, 20 mg of PLA (∼0.22 μmol) and 1.5 mg of KP1019 (2.5 μmol) were dissolved in 1.95 mL acetone followed by addition of 0.05 mL dichloromethane. This solution was poured under stirring into 5 mL of an aqueous phase prepared by dissolving different amounts of Tween 80 or Pluronic F68 in the range of 0.1% (w/v) to 0.4% (w/v) and stirred for 30 min at room temperature. The organic solvents were evaporated under reduced pressure at 35 °C and the volume was adjusted to 1 mL. The nanoparticles were stored at 4 °C. Drug-free blank nanoparticles were prepared by the same procedure.Particles size and surface charge (zeta-potential)
The nanoparticle sizes and the polydispersity indices (PDI) were determined by dynamic light scattering (DLS) using a Malvern ZetaSizer Nano ZS (Malvern Instruments Ltd, Malvern, UK) equipped with a 4 mW He–Ne, 632.8 nm laser beam at 25 °C at a scattering angle of 173°. Prior to the particle size measurement, the nanoparticles were diluted (1![[thin space (1/6-em)]](https://www.rsc.org/images/entities/char_2009.gif) :
:![[thin space (1/6-em)]](https://www.rsc.org/images/entities/char_2009.gif) 10 v/v) with MilliQ water and measured in disposable cuvettes (UV-cuvette micro, Brand GmbH+Co KG, Germany). The zeta-potential of the nanoparticles was determined using the same instrument in disposable capillary cells. The instrument performs Laser Doppler Velocimetry (LDV) in order to obtain the electrophoretic mobility and convert this to the zeta potential by the usage of the Henry equation.
10 v/v) with MilliQ water and measured in disposable cuvettes (UV-cuvette micro, Brand GmbH+Co KG, Germany). The zeta-potential of the nanoparticles was determined using the same instrument in disposable capillary cells. The instrument performs Laser Doppler Velocimetry (LDV) in order to obtain the electrophoretic mobility and convert this to the zeta potential by the usage of the Henry equation.
Nanoparticle morphology: TEM analysis
Transmission electron microscopy (TEM; Zeiss TEM 902) was used to evaluate the shape and size of the nanoparticles. One drop (approximately 10 μL) of the diluted nanoparticles (1![[thin space (1/6-em)]](https://www.rsc.org/images/entities/char_2009.gif) :
:![[thin space (1/6-em)]](https://www.rsc.org/images/entities/char_2009.gif) 3 v/v, with Millipore water) was placed on a carbon-coated 100-mesh copper grid. Any excess fluid was removed with a filter paper. The grid was allowed to dry overnight and analyzed under the electron microscope.
3 v/v, with Millipore water) was placed on a carbon-coated 100-mesh copper grid. Any excess fluid was removed with a filter paper. The grid was allowed to dry overnight and analyzed under the electron microscope.
Determination of the encapsulated KP1019 content
The amount of encapsulated drug was determined by inductively coupled plasma mass spectrometry (ICP-MS) after microwave assisted digestion following a modified method from Ratzinger et al.28 The microwave digestion was used to reduce matrix effects during ICP-MS measurements caused by the organic material. A 250 μL aliquot of freshly prepared nanoparticles was digested with 2 mL nitric acid (32% w/w, subboiled). An established microwave program was used (microwave: MLS-Ethos 1600, MLS, Germany), which is summarized in Table 3.| Time [min] | Power [W] | Temperature [°C] |
|---|---|---|
| 2 | 700 | 85 |
| 5 | 700 | 135 |
| 4 | 1000 | 180 |
| 12 | 1000 | 180 |
The digested samples were diluted and the concentration of ruthenium was determined using an Agilent 7500ce ICP-MS (Agilent Technologies, Waldbronn, Germany) equipped with a Cetac ASX-520 autosampler, a MicroMist nebulizer and nickel cones. Samples were prepared by dilution to ppb-ranges with 2% HNO3 and the addition of an internal standard (In). The ICP-MS parameters are given in Table 4. The average concentrations and standard deviation were calculated from the different measured isotopes of Ru.
| Rf power [W] | 1500 |
| Carrier gas [L min−1] | 0.88–0.93 |
| Make up gas [L min−1] | 0.19–0.21 |
| Plasma gas [L min−1] | 15 |
| Monitored isotopes of Ru [m/z] | 100, 101, 102, 104 |
| Isotopes of internal standards In | 115 |
| Integration time/mass | 0.3 |
| Replicates | 10 |
Stability and reproducibility of particle size
Three batches of freshly prepared Tween 80 nanoparticles were investigated to determine the reproducibility in size and drug loading. Reproducibility in nanoparticle size was determined by measurement of the mean diameter and PDI by DLS. Furthermore, long-term stability studies, concerning size, were carried out in duplicate by the determination of the particle sizes over a time period of 25 days.Cell culture
The hepatocellular carcinoma cell line Hep3B and the colon carcinoma cell line SW480 (both from American Type Culture Collection, Manassas, VA) were used. SW480 were grown in minimal essential medium (MEM) and Hep3B cells in RPMI 1640 medium. Both media were supplemented with 10% fetal bovine serum. Cultures were regularly checked for Mycoplasma contamination.For cytotoxicity tests, cells were plated (2 × 10⁴ cells per mL) in 100 μL per well in 96-well plates and allowed to attach for 24 h. Drugs were added in another 100 μL growth medium and cells exposed for 72 h. The proportion of viable cells was determined by MTT assay following the manufacturer's recommendations (EZ4U, Biomedica, Vienna, Austria). The cytotoxicity was expressed as IC50 values calculated from full dose–response curves (drug concentrations inducing a 50% reduction of cell survival in comparison to the control cultured in parallel without drugs).
Measurement of intracellular oxidants
2′,7′-Dichlorofluorescein diacetate (DCF-DA) was used for the detection of intracellular H2O2 and ROS such as OH˙ and ROO˙. DCF-DA stock solutions (33.4 mM) in DMSO were stored at −20 °C. SW480 (2.5 × 10⁵ cells per sample in phenol-free Hanks balanced salt solution) were incubated with DCF-DA for 30 min. Subsequently, the nanoparticles were added at the indicated concentrations. After incubation for another 30 min, the mean fluorescence intensity was measured by flow cytometry using a BD LSR Fortessa Cytometer (Becton Dickinson and Company, Franklin Lakes, New Jersey, USA). A concentration of 2 mM H2O2 was used as a positive control. Intracellular superoxide radical (O2˙−) production was determined by flow cytometry using the cell permeable dihydroxyethidium (DHE).29 DHE enters the cells where it is oxidized by O2˙− and other intracellular components to form 2-hydroxyethidium and ethidium both showing a red fluorescence.30 Cells (2.5 × 10⁵ per sample) were incubated for 1 h with the indicated drug concentrations at 37 °C in phosphate buffered saline. After 30 min of drug treatment, 10 μM DHE were added and incubated for another 30 min at 37 °C. Antimycin A (10 μM) was used as a positive control. Subsequently, the DHE fluorescence (535/617 nm) was measured using a BD LSR Fortessa Cytometer (Becton Dickinson and Company, Franklin Lakes, New Jersey, USA). The resulting histograms were quantified using the Flowing Software (University of Turku, Finland).Electrospray ionization mass spectrometry (ESI-MS) studies
A stock solution was prepared by dissolving KP1019 (15 mg, 5.0 mM) in 9.75 mL acetone followed by the addition of 0.25 mL dichloromethane. This solution was poured under stirring into an aqueous phase prepared by dissolving Tween 80 (50 mg, 7.6 mM) in MilliQ water (50 mL) and stirred for 30 min at room temperature. The organic solvents were evaporated under reduced pressure at 35 °C and the volume was adjusted to 5 mL. The solution was incubated at 37 °C. Samples were taken after 10 min, 4 h, and 25 h and diluted to 40 μM of KP1019 using MilliQ water–methanol (1![[thin space (1/6-em)]](https://www.rsc.org/images/entities/char_2009.gif) :
:![[thin space (1/6-em)]](https://www.rsc.org/images/entities/char_2009.gif) 1) prior to infusion into the mass spectrometer. The mass spectra were recorded on an AmaZon SL ion trap instrument (Bruker Daltonics GmbH, Bremen, Germany) using the following parameters: flow 4 μL min−1, 126% RF level, trap drive 115.8, dry temperature 220 °C, nebulizer 8 psi, dry gas 6 L min−1, capillary ±4.5 kV and average accumulation time 177 μs.
1) prior to infusion into the mass spectrometer. The mass spectra were recorded on an AmaZon SL ion trap instrument (Bruker Daltonics GmbH, Bremen, Germany) using the following parameters: flow 4 μL min−1, 126% RF level, trap drive 115.8, dry temperature 220 °C, nebulizer 8 psi, dry gas 6 L min−1, capillary ±4.5 kV and average accumulation time 177 μs.
UV-Vis spectroscopy
UV-Vis spectra were recorded on an Agilent 8453 UV-Visible spectroscopy system (Agilent Technologies, Germany) using the same stock solution as for the ESI-MS studies. Aliquots of 100 μL were withdrawn after the following time points: 10 min, 4 h, and 25 h and diluted to 0.2 mM using MilliQ water. The samples were measured in 10 mm path length quartz cuvettes.Simultaneous electron spin resonance (ESR) and UV-Vis spectroscopy
A stock solution of KP1019 (15 mg, 5.0 mM) and Tween 80 (50 mg, 7.6 mM) was prepared as the one used for ESI-MS measurements. Volumes of 1.5 mL stock solution were incubated at 37 °C for 0 h, 4 h, 6 h, 15 h, 19 h and 24 h. After incubation, aliquots of 1 mL were used for UV-Vis spectroscopy and 500 μL for ESR spectroscopy. UV-Vis spectra were recorded in 1 cm quartz cuvettes on a Shimadzu Multispec MS1501. Aliquots for ESR spectroscopy were transferred in 1 mL syringes (Braun Omnifix) with the Luer connector removed and frozen at 77 K. Pellets of the frozen aliquots were transferred to a quartz finger dewar for ESR analysis at 77 K. ESR spectra were recorded on a Bruker EMX instrument and a TE102 cavity using the following instrument settings: 9.453 GHz microwave frequency, 50 mW microwave power, 2700 G center field, 3500 G sweep, 5 G modulation amplitude, 100 kHz modulation frequency, 1 × 10⁵ receiver gain, 626 G min−1 scan rate, 0.327 s time constant, and one scan.Acknowledgements
We thank Irene Herbacek for flow cytometry measurements, Irena Pashkunova-Martic for helpful discussions, Sarah Theiner for introduction to ICP-MS measurements and Daniela Gruber of the Core Facility Cell Imaging and Ultrastructure Research of the University of Vienna for the introduction and the usage of the TEM. This work was supported by the exploratory focus “Functionalized Materials and Nanostructures” of the University of Vienna and performed with the help of COST action CM1105 and the “PLACEBO” project within the Genome Austria program.References
- A. Bergamo, C. Gaiddon, J. H. M. Schellens, J. H. Beijin and G. Sava, J. Inorg. Biochem., 2012, 106, 90 CrossRef CAS PubMed.
- E. S. Antonarakis and A. Emadi, Cancer Chemother. Pharmacol., 2010, 66, 1 CrossRef CAS PubMed.
- N. Graf and S. J. Lippard, Adv. Drug Delivery Rev., 2012, 64, 993 CrossRef CAS PubMed.
- C. G. Hartinger, S. Zorbas-Seifried, M. A. Jakupec, B. Kynast, H. Zorbas and B. K. Keppler, J. Inorg. Biochem., 2006, 100, 891 CrossRef CAS PubMed.
- U. Jungwirth, C. R. Kowol, B. K. Keppler, C. G. Hartinger, W. Berger and P. Heffeter, Antioxid. Redox Signaling, 2011, 15, 1085 CrossRef CAS PubMed.
- E. Reisner, V. B. Arion, B. K. Keppler and A. J. L. Pombeiro, Inorg. Chim. Acta, 2008, 361, 1569 CrossRef CAS PubMed.
- L. Brannon-Peppas and J. O. Blanchette, Adv. Drug Delivery Rev., 2012, 64, 206 CrossRef PubMed.
- H. Maeda, H. Nakamura and J. Fang, Adv. Drug Delivery Rev., 2013, 65, 71 CrossRef CAS PubMed.
- M. Hans and A. Lowman, Curr. Opin. Solid State Mater. Sci., 2002, 6, 319 CrossRef CAS.
- O. Pillai and R. Panchagnula, Curr. Opin. Chem. Biol., 2001, 5, 447 CrossRef CAS.
- B. Mishra, B. B. Patel and S. Tiwari, Nanomed.: Nanotechnol. Biol. Med., 2010, 6, 9 CrossRef CAS PubMed.
- S. G. Dixit, A. R. Mahadeshwar and S. K. Haram, Colloids Surf., A, 1998, 133, 69 CrossRef CAS.
- J. U. Menon, S. Kona, A. S. Wadajkar, F. Desai, A. Vadla and K. T. Nguyen, J. Biomed. Mater. Res., Part A, 2012, 100, 1998 CrossRef PubMed.
- D. T. Birnbaum, J. D. Kosmala and L. Brannon-Peppas, J. Nanopart. Res., 2000, 2, 173 CrossRef CAS.
- P. Heffeter, A. Riabtseva, Y. Senkiv, C. R. Kowol, W. Körner, U. Jungwith, N. Mitina, B. K. Keppler, T. Konstantinova, I. Yanchuk, R. Stoika, A. Zaichenko and W. Berger, J. Biomed. Nanotechnol., 2013, 9, 1 CrossRef PubMed.
- H. Fessi, F. Puisieux, J. P. Devissaguet, N. Ammoury and S. Benita, Int. J. Pharm., 1989, 55, R1 CrossRef CAS.
- N. G. Portney and M. Ozkan, Anal. Bioanal. Chem., 2006, 384, 620 CrossRef CAS PubMed.
- T. Riley, T. Govender, S. Stolnik, C. Xiong, M. Garnett and L. Illum, Colloids Surf., B, 1999, 16, 147 CrossRef CAS.
- A. Gomes, E. Fernandes and J. L. Lima, J. Biochem. Biophys. Methods, 2005, 65, 45 CrossRef CAS PubMed.
- C. Bartel, A. E. Egger, M. A. Jakupec, P. Heffeter, M. Galanski, W. Berger and B. K. Keppler, J. Biol. Inorg. Chem., 2011, 16, 1205 CrossRef CAS PubMed.
- V. Pichler, S. Göschl, S. M. Meier, A. Roller, M. A. Jakupec, M. Galanski and B. K. Keppler, Inorg. Chem., 2013, 52, 8151 CrossRef CAS PubMed.
- Q. A. de Paula, A. A. Batista, O. R. Nascimento, A. J. da Costa, M. S. Schultz, M. R. Bonfadini and G. Oliva, J. Braz. Chem. Soc., 2000, 11, 530 CrossRef CAS PubMed.
- N. Cetinbas, M. I. Webb, J. A. Dubland and C. J. Walsby, J. Biol. Inorg. Chem., 2010, 15, 131 CrossRef CAS PubMed.
- B. A. Kerwin, J. Pharm. Sci., 2008, 97, 2924 CrossRef CAS PubMed.
- P. Schluga, C. G. Hartinger, A. E. Egger, E. Reisner, M. Galanski, M. A. Jakupec and B. K. Keppler, Dalton Trans., 2006, 1796 RSC.
- K. Lipponer, E. Vogel and B. K. Keppler, Met.-Based Drugs, 1996, 3, 243 CrossRef CAS PubMed.
- C. E. Mora-Huertas, H. Fessi and A. Elaissari, Int. J. Pharm., 2010, 385, 113 CrossRef CAS PubMed.
- G. Ratzinger, P. Agrawal, W. Körner, J. Lonkai, H. M. Sanders, E. Terreno, M. Wirth, G. J. Strijkers, K. Nicolay and F. Gabor, Biomaterials, 2010, 31, 8716 CrossRef CAS PubMed.
- N. M. Mustapha, J. M. Tarr, E. M. Kohner and R. Chibber, J. Ophthalmol., 2010, 2010 Search PubMed.
- D. C. Fernandes, J. Wosniak Jr., L. A. Pescatore, M. A. Bertoline, M. Liberman, F. R. Laurindo and C. X. Santos, Am. J. Physiol.: Cell Physiol., 2007, 292, C413 CrossRef CAS PubMed.
| This journal is © The Royal Society of Chemistry 2014 |

