 Open Access Article
Creative Commons Attribution 3.0 Unported Licence
Direct amine-functionalisation of γ-Fe2O3 nanoparticles
V.
Rocher
a,
J.
Manerova
b,
M.
Kinnear
a,
D. J.
Evans
a and
M. G.
Francesconi
*a
aDepartment of Chemistry, University of Hull, Cottingham Road, Hull, HU6 7RX, UK. E-mail: m.g.francesconi@hull.ac.uk; Fax: +44 (0)1482 46 6410; Tel: +44 (0)1482 46 5409
bChemical and Biological Engineering Department, The University of Sheffield, Sir Robert Hadfield Building, Mappin Street, Sheffield, S1 3JD, UK. E-mail: j.manerova@sheffield.ac.uk; Fax: +44 (0)114 222 7501; Tel: +44 (0)114 222 7500
First published on 26th November 2013
Abstract
A novel and simple preparation of amine-modified γ-Fe2O3 nanoparticles is described. The presence of amine groups on the surface, instead of hydroxyl groups, will allow conjugation of biologically active molecules to the iron oxide nanoparticles without the need for a size increasing silica shell. Furthermore, the outer amine-layer increases the temperature of the γ-Fe2O3 to α-Fe2O3 structural transition in a similar way to previously reported cationic substitutions. This may suggest the formation of an oxide–nitride outer layer. Re-dispersion of the amine-modified γ-Fe2O3 nanoparticles led to the preparation of stable ferrofluids.
Introduction
A simple route was used to prepare a ferrofluid from nanoparticles directly functionalised with amine groups. Ferrofluids are generally made of nanoparticles of iron oxide dispersed into a liquid medium to form a stable colloidal solution.1 The magnetic moment carried by the nanoparticles makes these dispersions responsive to external magnetic fields2 opening up a number of interesting potential applications.3–5 In order to obtain stable ferrofluids, aggregation between the magnetic nanoparticles must be avoided and, generally, this is achieved by functionalisation, e.g. surface binding of molecules to create steric hindrance,6 either directly on the nanoparticles’ surface or through additional silica shells. By careful choice of the molecule, the properties of ferrofluids can be tailored towards different applications. Direct functionalisation can be achieved by bonding molecules to hydroxyl groups present on the surface of the nanoparticles, the advantage being that the size of the nanoparticles is maintained as there is no need for an additional silica shell. The requirement for amine-functionalised nanoparticles is dictated by certain types of molecules, for example complex biologically active molecules, which will bind to the nanoparticles via an amide bond.7Ferrofluids are most commonly dispersions of either γ-Fe2O3 (maghemite) or Fe3O4 (magnetite) nanoparticles or a mixture of both. The two structures of γ-Fe2O3 and Fe3O4 are both based on a FCC lattice of O2− anions, with Fe3O4 containing both Fe2+ and Fe3+ cations, and γ-Fe2O3 Fe3+ cations and cation vacancies to maintain charge neutrality.8–10 Under thermal treatment cubic, ferromagnetic maghemite transforms irreversibly into the rhombohedral antiferromagnetic hematite (α-Fe2O3).11 This structural transition is being investigated with the aim of increasing the temperature limit of stability of the maghemite phase to maintain its magnetic properties and widen the applicability of γ-Fe2O3. For example, γ-Fe2O3 shows high sensitivity and selectivity in sensors for hydrocarbon gases, without the need for a noble metal.12 Cation doping of γ-Fe2O3 nanoparticles seems to be the most effective way to increase the temperature of the γ-Fe2O3/α-Fe2O3 transition, but very little has been reported on transition temperature variations caused by functionalisation. Here we report that reacting γ-Fe2O3 nanoparticles with NH3 (g) at 200 °C for 2–4 hours leads to direct functionalisation of the nanoparticles with amine groups and increases the temperature of the structural transition from γ-Fe2O3 (maghemite) to α-Fe2O3 (hematite) up to 550 °C. This suggests the possibility of formation of an outer layer of iron oxide–nitride.
Experimental
Preparation of nanoparticles of γ-Fe2O3
Iron oxide nanoparticles were prepared via a sol–gel process.13 A solution of iron(II) and iron(III) chlorides in water was reacted with ammonium hydroxide to form magnetite (Fe3O4) nanoparticles. After washing with acetone and ether, the nanoparticles were re-dispersed in nitric acid. Reaction with iron(III) nitrate at boiling point oxidised the nanoparticles to maghemite (γ-Fe2O3).Amination of γ-Fe2O3 nanoparticles with NH3 (g)
Dried nanoparticles of γ-Fe2O3 were placed into a small ceramic reaction boat, which was placed at the centre of the tube in a tube furnace. The flow rate of ammonia gas was 4.0 L h−1 and excess was removed by an HCl scrubber. The temperature was raised to 200 °C at 5 °C min−1 and maintained between 1 and 2 hours. At the end of the reaction, the tube was flushed with nitrogen to remove unreacted ammonia and the product was transferred to a glove box for storage under argon.Ferrofluids were prepared by dispersion of γ-Fe2O3 nanoparticles and amine-modified γ-Fe2O3 nanoparticles. A sample of approximately 100 mg was added to 2 mL of aqueous solution of HNO3 (pH = 2). This suspension was then subjected to 30 minutes of ultrasonic radiation to break the larger aggregates. The resulting colloidal dispersions were left to rest for 24 hours to test their stability.
Powder X-ray diffraction was carried out using a Siemens D5000 diffractometer using the Cu Kα radiation. Data were recorded from 2θ = 10° to 2θ = 110° over 72 hours, with a step size of 0.02°.
Thermogravimetric analyses were carried out using a Mettler TGA/DSC 1 Starsystem. 10–15 mg of nanoparticles were placed in an alumina pan and heated at a constant rate (30 °C min−1) to 900 °C under air, with the weight pattern and heat flow recorded as functions of the temperature.
The nitrogen content of the N-doped samples was measured using a CE Instruments 1108 CHN analyzer and results were expressed as weight percentages.
Nitrogen adsorption isotherms were recorded on a Micromeritics Tristar 3000. Size distribution was calculated from these data using the BJH model.
To demonstrate qualitatively the presence of surface amine groups, portions of ferrofluids formed with γ-Fe2O3 nanoparticles and γ-Fe2O3 nanoparticles reacted with ammonia were reacted for 1 h with a solution of fluorescamine (4′-phenylspiro[2-benzofuran-3,2′-furan]-1,3′-dione) in acetone (1 mg in 5 mL). The nanoparticles were then removed by filtration and the presence of fluorophors was revealed by examining the solutions under UV light.
Mössbauer spectra were recorded in zero magnetic field at 80 K on an ES-Technology MS-105 Mössbauer spectrometer with a 900 MBq 57Co source in a rhodium matrix at ambient temperature. Spectra were referenced against a 25 μm iron foil at 298 K and spectrum parameters were obtained by fitting with Lorentzian curves. Samples were ground with boron nitride before mounting in the sample holder.
Results and discussion
The size of the nanoparticles, calculated from nitrogen adsorption data, shows sizes distributed between 4.5 nm and 6.0 nm for initial γ-Fe2O3 particles and between 5.5 nm and 7.0 nm for γ-Fe2O3 reacted with ammonia; the reaction with ammonia caused only a limited increase of the size of the γ-Fe2O3 nanoparticles, although aggregation took place after reaction with ammonia gas, as shown by TEM images (Fig. 1).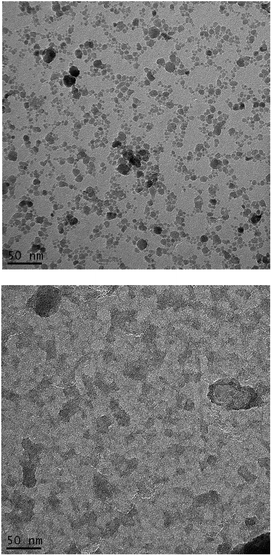 | ||
| Fig. 1 TEM images of γ-Fe2O3 nanoparticles (top) and γ-Fe2O3 nanoparticles reacted with ammonia at 200 °C for 2 hours (bottom). | ||
Stable colloidal suspensions (ferrofluids) were obtained by sonication in de-ionised water using both γ-Fe2O3 nanoparticles and γ-Fe2O3 nanoparticles reacted with ammonia.
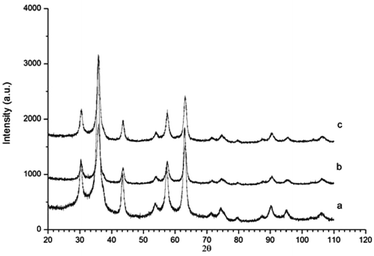
Powder X-ray diffraction (PXRD) of γ-Fe2O3 nanoparticles and γ-Fe2O3 nanoparticles reacted with NH3 (g) for 1 and 2 hours at 200 °C are shown in Fig. 2. The PXRD pattern of the γ-Fe2O3 nanoparticles shows the γ-Fe2O3 single phase. The percentage of γ-Fe2O3versus Fe3O4 was calculated via a peak deconvolution method to be 98.66%.14 The γ-Fe2O3 structure is maintained after ammoniation at 200 °C up to 2 hours and no formation of impurities can be detected. The unit cell parameters of all three compounds were refined from the general model for spinel-type structures, i.e. a face-centred cubic unit cell (space group Fd![[3 with combining macron]](https://www.rsc.org/images/entities/char_0033_0304.gif) m, number 227). No substantial difference was observed between the unit cell parameters of the three samples analysed (a = 8.349(1) Å for γ-Fe2O3; a = 8.337(2) Å for γ-Fe2O3 + NH3 (g) for 1 hour; a = 8.335(1) Å for γ-Fe2O3 + NH3 (g) for 2 hours).17,18 The findings of the refinements are in agreement with those reported by Petkov et al.19 The nitrogen content (weight%) was determined by elemental analysis to be 0.05% and 0.24% for nanoparticles reacted with ammonia for 1 and 2 hours, respectively.
m, number 227). No substantial difference was observed between the unit cell parameters of the three samples analysed (a = 8.349(1) Å for γ-Fe2O3; a = 8.337(2) Å for γ-Fe2O3 + NH3 (g) for 1 hour; a = 8.335(1) Å for γ-Fe2O3 + NH3 (g) for 2 hours).17,18 The findings of the refinements are in agreement with those reported by Petkov et al.19 The nitrogen content (weight%) was determined by elemental analysis to be 0.05% and 0.24% for nanoparticles reacted with ammonia for 1 and 2 hours, respectively.
Reactions of both γ-Fe2O3 nanoparticles and ammoniated γ-Fe2O3 nanoparticles with fluorescamine were carried out to investigate qualitatively the presence of amine groups on the surface of the ammoniated γ-Fe2O3 nanoparticles.15 Fluorescamine does not fluoresce itself but, after reaction with amine functional groups, forms a highly fluorescent fluorophor. Furthermore, fluorescamine is specific for primary amines as it does not react with secondary amines and forms a non-fluorescent adduct with ammonia.16 The formation of fluorophors was observed only for the nanoparticles that had been reacted with ammonia (Fig. 3), indicating that primary amines have replaced a portion of the hydroxide groups on the surface of the γ-Fe2O3 nanoparticles. Further evidence of amine-functionalisation is the pH of the ferrofluid suspensions, which was consistently between 11 and 12.
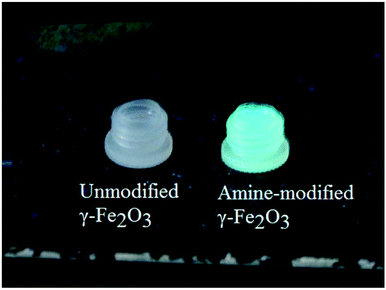 | ||
| Fig. 3 Fluorescamine test showing fluorescence only on reaction with amine-modified γ-Fe2O3 nanoparticles. | ||
Reactions between Fe3O4, α-Fe2O3 and Fe with NH3 and/or NH3/H2 at temperatures between 350 and 900 °C have resulted in a variety of iron nitrides.20–23 Tessier et al. and Kikkawa et al. reported the formation of Fe16N2via a ‘soft chemistry’ route, i.e. by using low temperatures and long times, reacting α-Fe2O3 with ammonia for 10 days at 110 °C24 or for 100 hours at 130 °C, after reduction of α-Fe2O3 to α-Fe.25 In our work, low temperature and short reaction times have led to breakage of bonds between the surface of the nanoparticles and –OH groups and to their replacement with –NH2 groups, as well as the probable formation of a thin oxide–nitride layer. The fact that PXRD showed no structural changes and/or secondary phases, the small nitrogen content detected via elemental analyses, and the results from the fluorescamine experiment eliminate the formation of an iron nitride and support direct functionalisation of γ-Fe2O3 nanoparticles with amine groups.
Zero-field Mössbauer spectra for γ-Fe2O3 and γ-Fe2O3 nanoparticles after ammoniation were recorded (Fig. 4). The spectrum for each sample is indistinguishable from the other and confirms that the γ-Fe2O3 structure is maintained on ammoniation. There is no evidence for magnetite or significant amounts of impurity being present. Only one hyperfine pattern is observed as expected in zero field and the spectra correspond to those previously reported for γ-Fe2O3.26,27
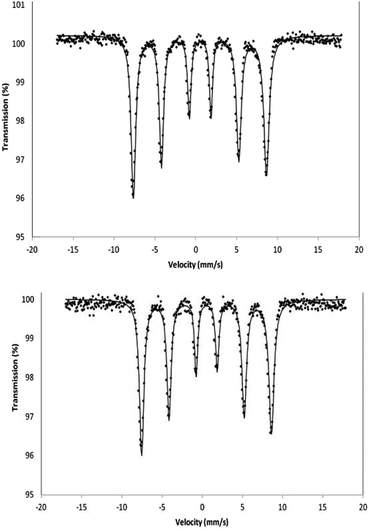 | ||
| Fig. 4 Mössbauer spectrum of γ-Fe2O3 (top) and γ-Fe2O3 after 2 hours treatment with ammonia (bottom) recorded in the solid state at 80 K in zero magnetic field. | ||
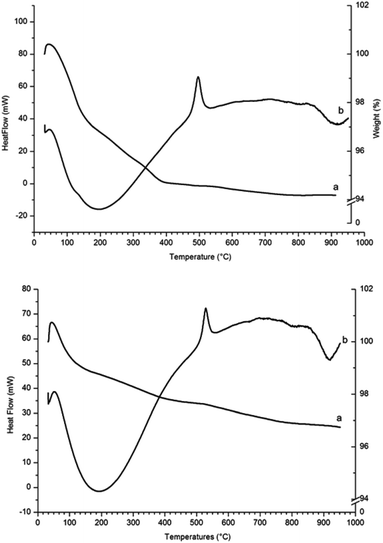
The TGA and heat flow diagram for γ-Fe2O3 nanoparticles heated in air (Fig. 5, top) shows an initial sharp weight loss due to physisorbed and chemisorbed moisture and hydroxyl groups. The heat flow shows a large exothermic peak at 495 °C corresponding to transformation of γ-Fe2O3 into α-Fe2O3, in agreement with the transition temperature reported by E. Darezereshki, who focussed on γ-Fe2O3 nanoparticles of similar size (13 and 19 nm).28 The residue samples from TGA analyses were analysed by PXRD and the patterns showed only diffraction peaks belonging to the α-Fe2O3 phase.
The TGA and heat flow diagrams for γ-Fe2O3 nanoparticles reacted with NH3 (g) for 2 hours at 200 °C (Fig. 5, bottom) show a weight loss between room temperature and 400 °C that is probably due to loss of amino groups from the surface of the nanoparticles. The heat flow shows that the exothermic peak corresponding to transformation of γ-Fe2O3 into α-Fe2O3 has shifted from 495 °C to 550 °C.
A comparison of the exothermic heat flow peaks indicating the γ-Fe2O3 to α-Fe2O3 transition temperature, for all three samples, is shown in Fig. 6. The transition temperature increases from 495 °C for the γ-Fe2O3 nanoparticles to 526 °C for γ-Fe2O3 nanoparticles reacted with NH3 (g) for 1 hour, and to 550 °C for the γ-Fe2O3 nanoparticles reacted with NH3 (g) for 2 hours.
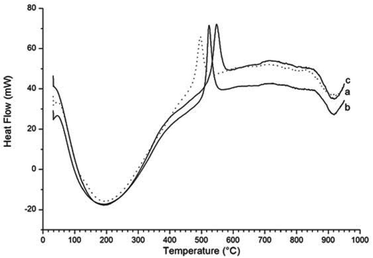 | ||
| Fig. 6 Comparison of the heat flow diagrams for (a) γ-Fe2O3 nanoparticles (dotted line) and (b) γ-Fe2O3 nanoparticles reacted for 1 hour and (c) for 2 hours. | ||
The maghemite–hematite structural transition has been discussed in a recent review on polymorphous transformation of nanometric iron(III) oxides.29 The maghemite to hematite phase transition was studied using differential thermal analysis30 and in situ real time X-ray diffraction.31,32 Different transition temperatures have been reported for nanoparticles of maghemite (200–500 °C) and for microsized particles (500 and 600 °C)33 and cation doping has been found to be a useful tool to enhance the transition temperature. Doping of amorphous Fe2O3 with 8.5% Mn3+ led to γ-Fe2O3 nanoparticles after heating for 3 hours at 500 °C34 and Zn2+ doping enhances the phase transformation temperature by circa 100 °C.35 DSC studies under air of ZnxFe3−xO4 (x = 0, 0.2, 0.4, and 0.6) solid solution showed that the γ-Fe2O3 to α-Fe2O3 phase transition temperature increases with increase in zinc content.36 A study on Fe3−xCoxO4 solid solutions showed that for x = 0.1 the temperature of the γ-Fe2O3 to α-Fe2O3 transition was increased by about 100 °C.37 γ-Fe2O3 nanoparticles doped with La3+ showed no sign of phase transition to α-Fe2O3 after 8 hours at 400 °C.38
Here, we show that the γ-Fe2O3 to α-Fe2O3 transition temperature is enhanced up to 550 °C as a consequence of the reaction of γ-Fe2O3 nanoparticles with ammonia. PXRD data show no changes in the patterns indicating no formation of nitrides, but it is likely that a thin layer of oxide-nitride is formed on the surface of the γ-Fe2O3 nanoparticles. It has been reported that the α/γ structural transition occurs as the size of the particles increases; hence an O/N layer is likely to decompose in air as the temperature increases (TGA carried out in air), hence delaying the α/γ structural transition. Whether the presence of primary amines on the surface of γ-Fe2O3 nanoparticles has any influence on the γ-Fe2O3 to α-Fe2O3 transition temperature is difficult to assess. Functionalisation of γ-Fe2O3 nanoparticles with palmitic acid was reported to shift the γ-Fe2O3 to α-Fe2O3 transition temperature up to 400 °C.39 Two sets of γ-Fe2O3 nanoparticles were functionalised with PMMA (polymethyl methacrylate) and with caprylate respectively and their γ versus α phase stability compared.40 The γ-Fe2O3 to α-Fe2O3 transition occurred at 400 °C for the caprylate-capped γ-Fe2O3 nanoparticles and at 500 °C for the γ-Fe2O3/PMMA composite γ-Fe2O3. It was argued that the outer molecular layer creates a barrier, which slows down the aggregation of the nanoparticles and consequent structural transition. However, in our case the coating of the nanoparticles alone may not be very effective in hindering particle aggregation as –NH2 groups provide an outer layer of comparable thickness to the –OH layers.
Conclusion
In summary, we prepared γ-Fe2O3 nanoparticles and reacted them with NH3 (g) at 200 °C for 1 and 2 hours. We obtained directly amine-functionalised γ-Fe2O3 nanoparticles, i.e. γ-Fe2O3 nanoparticles with NH2 groups substituting –OH surface groups. Normally, a silica shell is needed to prepare amine-functionalised γ-Fe2O3 nanoparticles; however, this additional layer contributes to increasing the size of the nanoparticles, a disadvantage for medical applications. The amine-functionalised nanoparticles did not show any sizeable increase in their diameter, were re-dispersed in water to form stable ferrofluids and showed, therefore, suitability for reactions with application-controlling molecules. TGA coupled with heat flow measurements showed that the presence of the amine layer and, probably, of an oxide–nitride surface layer also enhances the γ-Fe2O3 to α-Fe2O3 transition temperature up to 550 °C, comparable to previously reported cation modifications.Notes and references
- R. Massart, IEEE Trans. Magn., 1981, 17(2), 1247 CrossRef.
- J.-C. Bacri, R. Perzynski, D. Salin, V. Cabuil and R. Massart, J. Magn. Magn. Mater., 1986, 62(1), 36 CrossRef CAS.
- K. Raj, B. Moskowitz and R. Casciari, J. Magn. Magn. Mater., 1995, 149(1–2), 174 CrossRef CAS.
- I. Sharifi, H. Shokrollahi and S. Amiri, J. Magn. Magn. Mater., 2012, 324(6), 903 CrossRef CAS PubMed.
- R. Banerjee, Y. Katsenovich, L. Lagos, M. McIintosh, X. Zhang and C.-Z. Li, Curr. Med. Chem., 2010, 17(27), 3120 CrossRef CAS.
- E. Amstad, M. Textor and E. Reimhult, Nanoscale, 2011, 3, 2819 RSC.
- T. Georgelin, V. Maurice, B. Malezieux, J.-M. Siaugue and V. Cabuil, J. Nanopart. Res., 2010, 12(2), 675 CrossRef CAS.
- J. E. Jorgensen, L. Mosegaard, L. E. Thomsen, T. R. Jensen and J. C. Hanson, J. Solid State Chem., 2007, 180, 180 CrossRef CAS PubMed.
- C. Greaves, J. Solid State Chem., 1983, 49, 325 CrossRef CAS.
- T. J. Bastow, A. Trinchi, M. R. Hill, R. Harris and T. H. Muster, J. Magn. Magn. Mater., 2009, 321(17), 2677 CrossRef CAS PubMed.
- R. M. Cornel and U. Schwertmann, The Iron Oxides. Structure, Properties, Reactions and Uses, 2003 Search PubMed.
- D.-D. Lee and D.-H. Choi, Sens. Actuators, B, 1990, 1, 231 CrossRef.
- N. Fauconnier, A. Bée, J. Roger and J. N. Pons, J. Mol. Liq., 1999, 83(1–3), 233 CrossRef.
- W. Kim, C.-Y. Suh, S.-W. Cho, K.-M. Roh, H. Kwon, K. Song and I.-J. Shon, Talanta, 2012, 94, 348 CrossRef CAS PubMed.
- O. S. Wolfbeis, M. Hof, R. Hutterer and V. Fidler, Fluorescence Spectroscopy in Biology, Springer, Berlin, 2005 Search PubMed.
- R. Kellener, F. Lottspeich and H. E. Meer, Microcharacterization of Proteins, 2nd edn, 1999 Search PubMed.
- A. C. Larson and R. B. Von Dreele, General Structure Analysis System (GSAS), Los Alamos National Laboratory Report LAUR 86-748, 2004 Search PubMed.
- B. H. Toby, EXPGUI, J. Appl. Crystallogr., 2001, 34, 210 CrossRef CAS.
- V. Petkov, P. D. Cozzoli, R. Buonsanti, R. Cingolani and Y. Ren, J. Am. Chem. Soc., 2009, 131, 14264–14266 CrossRef CAS PubMed.
- X. L. Wu, W. Zhong, N. J. Tang, H. Y. Jiang, W. Liu and Y. W. Du, J. Alloys Compd., 2004, 385, 294 CrossRef CAS PubMed.
- S. Kurian and N. S. Gajbhiye, J. Nanopart. Res., 2010, 12, 1197 CrossRef CAS.
- S. Kurian and N. S. Gajbhiye, Chem. Phys. Lett., 2010, 493, 299 CrossRef CAS PubMed.
- W. Arabczyk, J. Zamłynny and D. Moszynski, Pol. J. Chem. Technol., 2010, 12, 38 Search PubMed.
- F. Tessier, Solid State Sci., 2000, 2, 457 CrossRef CAS.
- S. Kikkawa, K. Kubota and T. Takeda, J. Alloys Compd., 2008, 449, 7 CrossRef CAS PubMed.
- N. N. Greenwood and T. C. Gibb, Mössbauer Spectroscopy, 1971, ch. 10, pp. 240–258 Search PubMed.
- Y. R. Uhm, W. W. Kim and C. K. Rhee, Phys. Status Solidi A, 2004, 201, 1934 CrossRef CAS.
- E. Darezereshki, Mater. Lett., 2011, 65, 642 CrossRef CAS PubMed.
- L. Machala, J. Tuek and R. Zbořil, Chem. Mater., 2011, 23, 3255 CrossRef CAS.
- X. Ye, D. Lin, Z. Jiao and L. Zhang, J. Phys. D: Appl. Phys., 1998, 31, 2739 CrossRef CAS.
- T. Belina, N. Millot, N. Bovet and M. Gailhanou, J. Solid State Chem., 2007, 180, 2377 CrossRef PubMed.
- G. Schimanke and M. Martin, Solid State Ionics, 2000, 136, 1235 CrossRef.
- G. Ennas, A. Mei, A. Musinu, G. Piccaluga, G. Pinna and S. Solinas, J. Mater. Res., 1999, 14(4), 1570 CrossRef CAS.
- J. Lai, K. V. P. M. Shafi, K. Loos, A. Ulman, Y. Lee, T. Vogt and C. Estournes, J. Am. Chem. Soc., 2003, 125, 11470 CrossRef CAS PubMed.
- S. Deka and P. A. Joy, J. Mater. Chem., 2007, 17, 453 RSC.
- S. S. Pati and J. Philip, J. Appl. Phys., 2013, 113(4), 044314/1 CrossRef CAS PubMed.
- S. S. Pati, S. Gopinath, G. Panneerselvam, M. P. Antony and J. Philip, J. Appl. Phys., 2012, 112(5), 054320/1 CrossRef CAS PubMed.
- H. Wang, N. Hua, Y. Du and P. Yang, Huaxue Yanjiu Yu Yingyong, 2005, 17(3), 369 CAS.
- R. Zboril, A. Bakandritsos, M. Mashlan, V. Tzitzios, P. Dallas, C. Trapalis and D. Petridis, Nanotechnology, 2008, 19, 095602 CrossRef CAS PubMed.
- T. Ninjbadgar, S. Yamamoto and M. Takano, Solid State Sci., 2005, 7, 33 CrossRef CAS PubMed.
| This journal is © The Royal Society of Chemistry 2014 |

