 Open Access Article
Creative Commons Attribution 3.0 Unported Licence
Implications of coverage-dependent O adsorption for catalytic NO oxidation on the late transition metals†
Kurt
Frey
 b,
David J.
Schmidt
b,
C.
Wolverton
c and
William F.
Schneider
*ab
b,
David J.
Schmidt
b,
C.
Wolverton
c and
William F.
Schneider
*ab
aDepartment of Chemistry and Biochemistry, 251 Nieuwland Science Hall, Notre Dame, IN 46556, USA. E-mail: wschneider@nd.edu; Fax: +1 574 631 6652; Tel: +1 574 631 7058
bDepartment of Chemical and Biomolecular Engineering, University of Notre Dame, 182 Fitzpatrick Hall, Notre Dame, IN 46556, USA
cDepartment of Materials Science and Engineering, Northwestern University, 2220 Campus Drive, Cook Hall Room 2036, Evanston, IL 60208, USA
First published on 5th August 2014
Abstract
Adsorbate interactions affect both the energies and arrangements of adsorbates on surfaces and consequently influence rates of surface chemical reactions. Here we examine these effects for a rate-limiting O2 dissociation model of catalytic NO oxidation on the late transition metals. We report periodic density functional theory calculations of atomic oxygen adsorption on the (0001) facets of Ru, Os, and Co, and the (111) facets of Rh, Ir, Ni, Pd, Pt, Cu, Ag, and Au and correlate these results using cluster expansion (CE) representations. We use grand canonical Monte Carlo simulations implementing these CE Hamiltonians to determine both the number and energetics of first-nearest-neighbor binding site vacancies available for the dissociative adsorption of O2 at conditions representative of catalytic NO oxidation. We estimate steady-state turnover frequencies and compare results to predictions using non-interacting adsorbates. We show that coverage dependence manifests itself in both the energetics and statistical availability of reaction sites and causes rates to deviate substantially from the coverage-independent limit.
1. Introduction
Rates of elementary step reactions at metal surfaces follow Brønsted–Evans–Polyani (BEP) correlations between reaction and activation energies.1 Most simple adsorbates on metals interact repulsively, so that average binding energies decrease with increasing coverage.2 However, BEP correlations do not apply to these apparent reaction energies; rather, they apply to energies of individual reaction events. Each individual reaction event is characterized by a reaction energy that depends on the local environment (i.e., number and configuration of nearby adsorbates), which can vary widely for a fixed reaction condition. Macroscopic rates of reactions are aggregations of these individual reactions events. The details of micro-scale energetic correlations along with their influence and relationship to observed rate behaviors are complex and not fully understood.3Our group has reported kinetic models of O2 temperature-programmed desorption (TPD)4 and of NO oxidation to NO2 on a Pt(111) lattice5,6 that accounted explicitly for the relationship between oxygen coverage, oxygen adsorbate ordering, and reaction rates through an O-adsorbate on Pt(111) cluster-expansion (CE).7–9 A lattice gas CE represents an arbitrary arrangement of adsorbates on a lattice as a vector of spin variables σi that indicate the presence (σ = 1) or absence (σ = 0) of an adsorbate at binding site i. The formation energy of a particular arrangement of adsorbates is expanded as products of these binary spin variables:
 | (1) |
Once appropriate coefficient values have been estimated from a database of density functional theory (DFT) results, the CE can be used to rapidly estimate the formation energies of any configuration of adsorbates. Adsorbate interactions are represented using pair-wise (Jij), three-body (Jijk), and higher-order effective cluster interactions (ECI)s. We have previously found that a minimally satisfactory CE for Pt(111)–O contained two- and three-body terms, with the underlying interactions reflecting a combination of electronic and strain effects.10 These results have been used by other investigators to conduct detailed studies of surface reactions using kinetic Monte Carlo (kMC) techniques.11 However, kMC approaches tend to have high computational costs, and other hybrid simulation techniques focusing on quasi-equilibrated surfaces can be used to focus on specific processes of interest.12
Fig. 1 illustrates a minimal kinetic model for coverage-dependent NO oxidation to NO2 on a surface:6
| NO + O* ⇌ NO2 | (2) |
| O2 + 2* → 2O* | (3) |
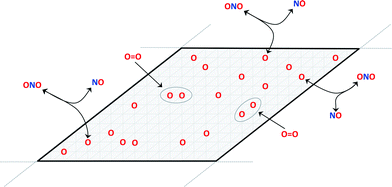 | ||
| Fig. 1 Schematic of the reaction model for irreversible dissociative adsorption of O2 on an O-equilibrated surface. | ||
The oxidation reaction (eqn (2)) is assumed to be rapid and equilibrated and dissociative adsorption (eqn (3)) is assumed to be rate limiting. These assumptions are consistent with DFT models and the known ability of NO2 to dose oxygen to a metal surface. Given these assumptions, a complete rate model for catalytic NO oxidation can be constructed using a CE. Overall energy changes due to candidate O2 dissociative adsorption events in eqn (3) are estimated from the differences in surface energies of initial and final surface configurations that differ by the addition of adjacent oxygen atoms into previously vacant sites:
| ΔEi = ECE(σfinal) − ECE(σinit) − EO2 | (4) |
We have found that O2 dissociation activation energies, Ea,i, for these dissociation events on Pt(111) can be correlated to the overall reaction energy ΔEi using a BEP relationship.5,6,13
| Ea,i = max(0, aBEP·ΔEi + bBEP) | (5) |
The two constants in eqn (5) are equal to those reported from DFT calculations for a variety of diatomic dissociation reactions on flat metal surfaces.14 These activation energies have been constrained to non-negative values.
Macroscopic per-site reaction rate estimates are then the ensemble average of all of the individual reaction events:
 | (6) |
Summations over ranges i and j in eqn (6) are performed over the possible surface configurations; the site frequency,  , accounts for the multiplicity of sites with the same activation energy. The maximum possible multiplicity,
  , is a constant value equal to the total available sites at zero coverage. Although the sums of multiplicities
  could be eliminated from eqn (6), they have been retained to highlight how energetic and configurational aspects contribute to the total rate. The multiplicities,
  , are determined from grand canonical Monte Carlo (GCMC) simulations that implement CEs and are performed at oxygen potentials consistent with eqn (2). The pre-exponential factor, A, could also vary between reaction sites, but previous calculations on Pt(111) suggest that a constant prefactor provides good agreement with observed NO oxidation kinetics.6 This model has been shown to reproduce both apparent activation energies and rate orders of NO oxidation on Pt(111),6 and has been used here to highlight the influence of adsorbate–adsorbate interactions on the number and energetics of sites that contribute to observed reaction rates.
Adsorption energies on transition metals vary systematically,15 and correlations between adsorption energies and reaction rates have been used to describe coverage independent reaction models demonstrating well-defined maxima in turnover frequency.16 In this work, we explore how coverage-dependent adsorption modifies this behavior using the example of the NO oxidation reaction on close-packed metal surfaces. Following the approach on Pt, we construct cluster expansions for atomic oxygen on the (111) facets of the late transition metals Rh, Ir, Ni, Pd, Pt, Cu, Ag, and Au, and the (0001) facets of Ru, Os, and Co. We find that adsorption and interaction energies both vary periodically, and that two- and three-body terms are necessary to capture observed interactions within the cluster expansion framework. We use these CEs in GCMC simulations to prepare equilibrated surfaces at representative NO oxidation conditions and to create distributions of O2 dissociation reaction energies. We calculate activation energy distributions from these reaction energy distributions using a BEP relationship and NO oxidation rates from the activation energy distributions. We compare the estimated rates of this fully interacting model with predictions from a coverage-independent model. The coverage-dependent model predicts a much narrower range of reaction rates that are influenced both by interaction energies and adsorbate ordering.
2. Computational details
2.1. DFT calculations
Plane-wave, supercell DFT energies were calculated using VASP version 5.2.12;17–20 the projector-augmented wave (PAW) approach was used to describe core electronic states,21,22 and the PW91-GGA was used for the exchange and correlation functionals.23,24 All calculations use a 400 eV cut-off energy for the plane wave basis set. Projection operators were evaluated in real space with fully automatic optimization. No symmetrization was allowed. All ionic relaxations except bulk metal ionic relaxations were converged to a force tolerance of 4 × 10⁻² eV Å−1. Bulk metal ionic relaxations were allowed to proceed until the length of lattice vectors converged to within 1 × 10⁻⁴ Å. Bulk metal calculations also used the ACCURATE precision tag and an increased precision of 5 × 10⁻⁵ eV for electronic convergence. All calculations used automatic Γ-point centered k-point mesh generation. Bulk metal calculations used a k-point density of 24 per reciprocal length scale in all directions, where the length scale is the minimum inter-atomic distance. Surface calculations use this k-point density along basis vectors parallel to the surface only. Gas phase calculations use a single Γ-point centered point. Final single-point DFT energies for the multiple adsorbate configurations used to determine formation energies were calculated using the tetrahedron method with Blöchl corrections.25 Only gas-phase calculations included spin polarization. Default values were used for all other input parameters not specified here. times the reported in-plane interatomic spacing. Lattice constants for HCP metals are equal to the reported in-plane interatomic spacing.
Bulk interatomic spacing calculated for HCP metal lattices (Ru, Os, and Co) and FCC metal lattices (Rh, Ir, Ni, Pd, Pt, Cu, Ag, Au) and their corresponding bulk energies are presented in Table 1. All of the FCC metals examined in this study conform to ideal layer spacing: a distance between hexagonal layers equal to the in-plane spacing times an axial ratio of  (i.e., 0.8165). All HCP metals examined in this study have axial spacing ratios less than the ideal value. All values in Table 1 were calculated without spin polarization. Interatomic spacing for cobalt would be 1.5% larger (i.e., 2.492 Å) when accounting for electronic spin; the axial ratio would remain unchanged. Interatomic spacing and axial ratios for nickel and all other metals would remain unchanged when accounting for electronic spin.
| Metal | Spacing | Bulk energy | |
|---|---|---|---|
| In-plane (Å) | Axial ratio | E refM (eV per atom) | |
| Ru | 2.729 | 0.7883 | −9.1592 |
| Os | 2.761 | 0.7886 | −11.1501 |
| Co | 2.456 | 0.8060 | −6.8085 |
| Rh | 2.718 | 0.8165 | −7.2233 |
| Ir | 2.745 | 0.8165 | −8.7926 |
| Ni | 2.484 | 0.8165 | −5.4108 |
| Pd | 2.794 | 0.8165 | −5.2154 |
| Pt | 2.816 | 0.8165 | −6.0448 |
| Cu | 2.567 | 0.8165 | −3.7286 |
| Ag | 2.934 | 0.8165 | −2.7285 |
| Au | 2.950 | 0.8165 | −3.2041 |
The electronic energy of a gas phase oxygen molecule with spin polarization was used as the reference state for oxygen. We calculated this value (i.e.,  ) in VASP using a single O2 molecule in a 10 Å cubic cell; its value is −4.8879 eV per atom.
 ,0); and c = (0,0,20
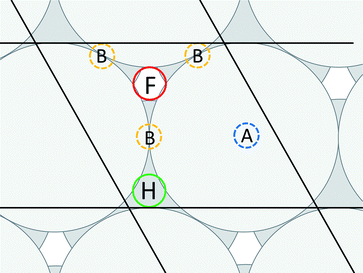
 ). A representation of the surface of this unit cell (i.e., a binding site) is depicted in Fig. 2 along with four types of candidate binding locations: atop (A), bridge (B), FCC (F), and HCP (H).
2.2. Cluster expansion parameters
Cluster expansions of the DFT-computed formation energies were constructing using a candidate pool of one zero-body, one single-site, five pairwise and three triplet clusters. Clusters were limited to local nearest-neighbor interactions and three-body interactions involving the first-nearest-neighbor (i.e., non-linear effects in the energy penalty due to adjacency). We determined cluster interactions using least squares fitting. Depictions of the CE terms are presented in Fig. 3.A zero-body term (i.e., the surface energy term) is not included in Fig. 3 because it is a constant for each metal, independent of adsorbate arrangement. The 1-1-1 cluster is either of two symmetry distinct clusters that have been constrained to have equal coefficients. This constraint was introduced to avoid any ambiguity in cluster description.
2.3. Monte Carlo simulations
We performed grand canonical Monte Carlo simulations using the cluster expansions on a periodic lattice of 42 binding sites × 42 binding sites, varying temperature and chemical potential. These surfaces were initialized at zero coverage and simulations were allowed to progress to equilibrium before sampling for distributions of reaction site energies. Equilibrium was identified as a trend in per site energy of less than one part in 105 after an average of one successful Monte Carlo move per site. GCMC simulations and reaction site sampling were continued until the mean of the resultant energetic distributions varied by less than one part in 105 after an average of one successful Monte Carlo move per site.3. Results
3.1. DFT calculations
 | (7) |
In eqn (7), the factor of five multiplying the bulk metal energy reference accounts for the five layers of metal atoms used to form the surface. The supercell used for these surface calculations was the unit cell. The site used to normalize surface energies is the surface of the unit cell depicted in Fig. 2. It has an area equal to  times the square of the interatomic spacing. Results are presented in Table 2.
| Metal | Surface energy | E bind (eV per O) | |
|---|---|---|---|
| E surf,fix (eV per site) | FCC | HCP | |
| Ru | 1.0657 | −2.59 | −3.03 |
| Os | 1.2530 | −2.51 | −3.08 |
| Co | 0.8063 | −3.05 | −3.06 |
| Rh | 0.8049 | −2.18 | −2.09 |
| Ir | 0.9307 | −1.92 | −1.74 |
| Ni | 0.6510 | −2.65 | −2.53 |
| Pd | 0.5649 | −1.42 | −1.24 |
| Pt | 0.6435 | −1.33 | −0.97 |
| Cu | 0.4556 | −1.74 | −1.65 |
| Ag | 0.3463 | −0.63 | −0.53 |
| Au | 0.3374 | −0.22 | 0.01 |
 | (8) |
Low coverage atomic oxygen binding energies were estimated for each of the four candidate binding sites on each metal. Results for FCC and HCP sites on all metals examined are reported in Table 2. Adsorbed oxygen atoms on metals with HCP structure bind most strongly in HCP locations; adsorbed oxygen atoms on metals with FCC structure bind most strongly in FCC locations. Atop and bridge locations are uniformly higher in energy than FCC and HCP locations, and/or not stable with respect to atomic oxygen binding. This binding site preference is not strong enough to imply that oxygen atoms adsorb exclusively to their preferred site (particularly on cobalt, rhodium, nickel, copper, and silver). However, for computational simplicity, adsorbates in the formation energy calculations were assumed to only adsorb to their energetically preferred locations.
All the surfaces relaxed in response to the oxygen adsorbates. The magnitude of metal atom displacement tended to increase moving to the right across a period and decrease moving down a group. Lateral movement away from adsorbate atoms was common to all metals; vertical movement, when present, tended to be larger in magnitude than lateral displacement and associated with surface oxide formation.
We calculated formation energies per surface binding site using eqn (9):
 | (9) |
In eqn (9), the factor of five multiplying the bulk metal energy reference accounts for the five layers of metal atoms used to form the surface. The variable Nads represents the number of oxygen adsorbates present in the cell; Nads ≤ Nsite. By selecting the bulk, fixed surface, and gas phase reference energies used in eqn (9), the electronic energy of the bulk metal at 0 K and of gas phase molecular oxygen at 0 K is 0 eV. Further, the formation energy at zero-coverage approximates the relaxed surface energy. The standard deviations of the 34 zero-coverage and total-coverage formation energies for each metal are reported in Table 3. We used this uncertainty in formation energies when determining the significance of effective cluster interactions for the cluster expansions.
| Metal | Uncertainty (eV per site) | RMSE (eV per site) | LOOCV (eV per site) |
|---|---|---|---|
| Ru | 0.006 | 0.008 | 0.009 |
| Os | 0.009 | 0.010 | 0.011 |
| Co | 0.003 | 0.008 | 0.010 |
| Rh | 0.006 | 0.006 | 0.007 |
| Ir | 0.006 | 0.007 | 0.008 |
| Ni | 0.004 | 0.009 | 0.010 |
| Pd | 0.006 | 0.007 | 0.008 |
| Pt | 0.004 | 0.006 | 0.006 |
| Cu | 0.004 | 0.009 | 0.011 |
| Ag | 0.006 | 0.008 | 0.010 |
| Au | 0.005 | 0.013 | 0.016 |
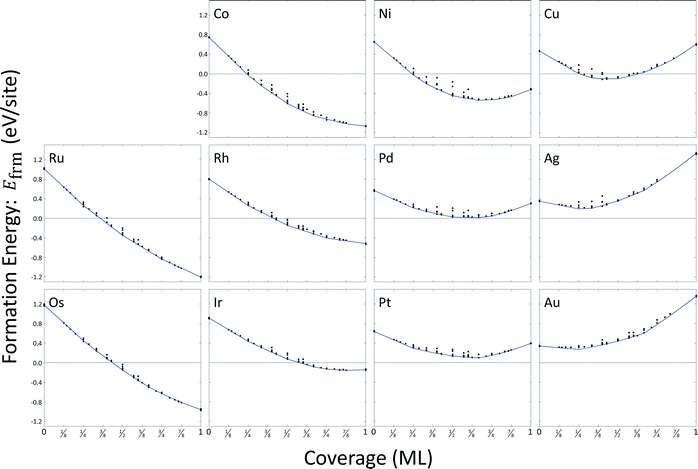
Most configurations relaxed only slightly with O atoms remaining in their respective FCC or HCP sites. On copper, silver, and gold, some configurations at higher coverages exhibited relaxations where metal atoms moved normal to the surface to positions above the oxygen atoms. We excluded these structures from the cluster expansion databases. A total of sixteen arrangements were excluded for copper, fourteen arrangements were excluded for silver, and eight arrangements were excluded for gold. A summary of the formation energy calculation data is included as ESI,† and results are depicted in Fig. 4. The general convexity of the hulls is a consequence of repulsive adsorbate interactions.
3.2. Cluster expansion parameters
We correlated these formation energies (Efrm) using CEs that incorporated the candidate clusters depicted in Fig. 3. Values for the ECIs of all eleven CEs are given in Table 4. We assumed the calculated uncertainties in Table 3 applied to all data points and used least-square regression to determine appropriate ECI values. Coefficients omitted from the table were not significantly different from zero given the reported uncertainties in formation energies.26 The 3NN ECI was not significant for any of the metals examined; the 5NN ECI was only significant for platinum. ECIs describing adsorbate short range interactions are of similar magnitudes to previously published lattice gas CEs for oxygen on ruthenium (0001), palladium (111), and platinum (111).7,27,28| Term | Effective cluster interaction (eV per site) | ||||||||||
|---|---|---|---|---|---|---|---|---|---|---|---|
| Ru | Os | Co | Rh | Ir | Ni | Pd | Pt | Cu | Ag | Au | |
| SE | 1.011 | 1.180 | 0.745 | 0.801 | 0.913 | 0.654 | 0.566 | 0.638 | 0.464 | 0.350 | 0.341 |
| E0 | −2.995 | −2.923 | −3.090 | −2.175 | −1.910 | −2.708 | −1.430 | −1.379 | −1.842 | −0.634 | −0.279 |
| 1NN | 0.204 | 0.111 | 0.301 | 0.205 | 0.094 | 0.346 | 0.208 | 0.149 | 0.600 | 0.467 | 0.235 |
| 2NN | 0.071 | 0.067 | 0.044 | 0.050 | 0.041 | 0.044 | 0.057 | 0.056 | 0.067 | 0.067 | 0.106 |
| 3NN | — | — | — | — | — | — | — | — | — | — | — |
| 4NN | — | 0.013 | 0.012 | 0.014 | 0.024 | 0.021 | 0.018 | 0.032 | — | 0.021 | 0.031 |
| 5NN | — | — | — | — | — | — | — | 0.027 | — | — | — |
| 1-1-1 | — | — | −0.265 | −0.088 | — | −0.222 | — | — | −0.311 | −0.182 | — |
| 1-1-2 | −0.007 | — | 0.056 | 0.030 | 0.026 | 0.069 | 0.021 | — | 0.034 | — | −0.032 |
| 1-1-3 | — | 0.057 | 0.121 | — | 0.050 | 0.156 | 0.046 | 0.084 | 0.133 | 0.084 | 0.092 |
Cluster expansions reproduced DFT calculated formation energies to within an average root-mean-square error (RMSE) of 8 meV. RMSE values for the difference between DFT calculated and cluster expansion correlated formation energies for each metal are presented in Table 3. Leave-one-out cross-validation (LOOCV) scores have also been reported in Table 3; these values are similar to RMSE values and were not used in determining ECI values.
We used the CEs to predict minimum energy hulls for all eleven metals; these hulls are shown in Fig. 4. Zero-coverage formation energies correspond to the estimated surface energy for a single binding site. All surface energies are strictly positive at zero-coverage. Only formation energies for oxygen coverages on palladium, platinum, silver, and gold remain positive at all coverages. Atomic oxygen coverage on all other metal surfaces is able to provide a greater degree of stability than can be achieved by their respective bulk metals. Formation energies for ruthenium, osmium, cobalt, and rhodium are strictly decreasing with coverage; all other metals demonstrate a minimum in formation energy.
3.3. Monte Carlo simulations
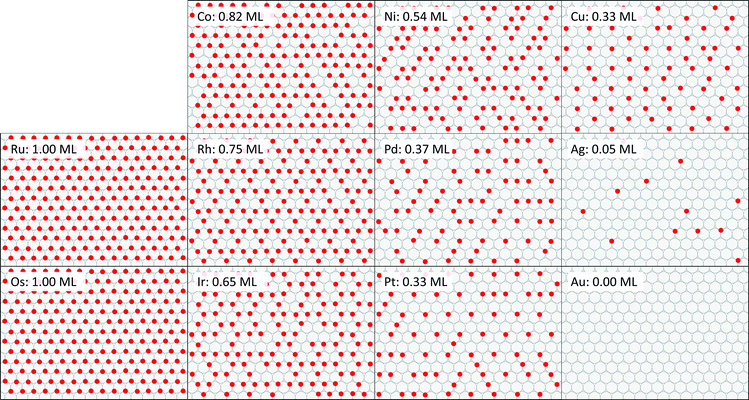
Snapshots of equilibrated surfaces created using GCMC simulations are presented in Fig. 5 at T = 600 K and μO* = −0.75 eV. Equilibrium coverage decreases to the right across a period and down through a group.If adsorbed oxygen is in equilibrium with gas-phase NO2 as assumed in eqn (2), then the chemical potential of the oxygen adsorbate is equal to the difference in chemical potentials of NO2 and NO: μO* = μNO2 − μNO. We calculated surface energy changes using the cluster expansions: ΔU = ECE(σfinal) − ECE(σinit), for simplicity neglecting any contributions of zero-point energies or of finite-temperature vibrational states. Translational and rotational degrees of freedom are assumed to be absent for adsorbed species. Incorporating coverage independent values for these contributions would affect the absolute magnitude of calculated reaction rates but would not otherwise influence their relative values.
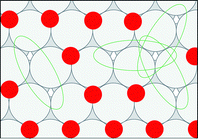
We created histograms of O2 reaction energies from equilibrated surfaces using eqn (4), with the restriction that only adjacent binding site vacancies were considered as candidate reaction sites for molecular oxygen (i.e., the state change from initial to final for a reaction event involved two adjacent binding sites switching from unoccupied to occupied). Fig. 6 depicts several example reactions sites on a hypothetical equilibrated FCC surface. Calculations of reaction energies for oxygen dissociation assumed that all gas phase oxygen molecules had internal energies equal to the ideal gas value: ( eV)
eV)
Site frequencies for reaction energies (i.e.,  ) describing the change in energy for the molecular oxygen dissociation reaction are shown in Fig. 7. These distributions are constructed from surfaces equilibrated at T = 600 K and μO* = 0.75 eV. Expected values for the O2 dissociation reaction energy indicated in Fig. 7 were calculated using a Boltzmann factor weighting of the reaction energy distributions. This averaging is equivalent to Widom's particle insertion method for excess chemical potential.29 Multiplicities of internal energy states were not explicitly accounted for in the reaction energy distributions (implying that the entropic contribution from internal states is zero), so the excess chemical potential is equal to the expected binding energy:
 | (10) |
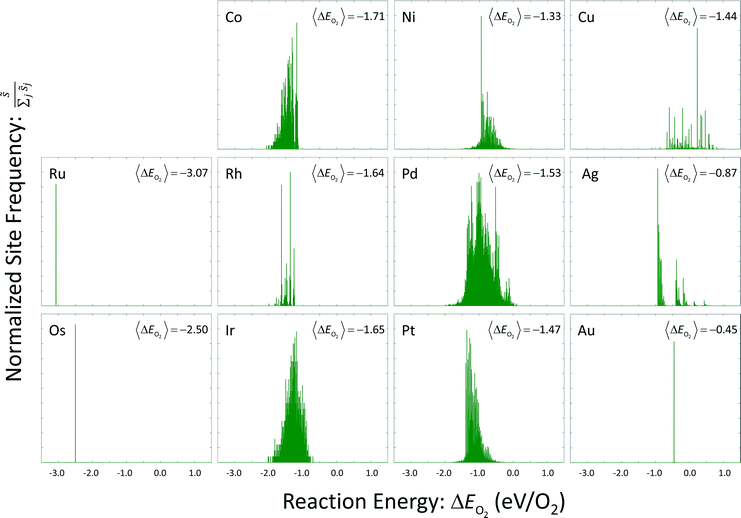 | ||
| Fig. 7 Reaction energy distributions for the dissociative adsorption reaction of molecular oxygen. Expected values have been calculated using a Boltzmann factor weighting of the reaction energies. | ||
As in eqn (6), summations over ranges i and j in eqn (10) are performed over possible surface configurations, and  accounts for the multiplicity of configurations with the same binding energy.
Oxygen coverage on the gold surface was near zero; oxygen coverages on the osmium and ruthenium surfaces was nearly total. Reaction energy distributions on all three of these surfaces resemble delta functions. Copper, platinum, palladium, and nickel had moderate equilibrium O coverages (i.e., 0.3 ML to 0.6 ML) and reaction energy distributions that exhibit long tails toward strongly exothermic reactions; contributions from these long tails dominate the expected value. Metals that had higher coverages (i.e., 0.6 ML to 0.9 ML) including iridium, rhodium, and cobalt, did not demonstrate these longer tails toward exothermic reaction events.
3.4. Reaction rates
We calculated reaction rates according to eqn (6), using a temperature of 600 K, a partial oxygen pressure of 0.1 bar, and an atomic oxygen adsorbate chemical potential of −0.75 eV as representative of typical conditions for the NO oxidation reactions in eqn (2) and (3). Assuming the gas phase behaves ideally, μO* = 0.75 eV at T = 600 K corresponds approximately to an equimolar ratio of NO2 to NO.30 We used literature values for BEP constants in a diatomic dissociation reaction on a flat surface: aBEP = 0.90 and bBEP = 2.07.14 We assumed the pre-exponential factor in eqn (6) to be the same for all reaction events and estimated its value from collision theory using the particle flux of molecular oxygen to a surface, assuming ideal gas behavior: | (11) |
The area of a reaction site Asite, was determined by noting that each binding site is associated with three unique reaction sites (i.e., three nearest neighbor adjacency candidates for adsorption of molecular oxygen). To distribute the molecular flux proportionately, a reaction site is equal to one-third the area of a binding site. This area varies based on the interatomic spacing of the atoms in the metal lattice, but was approximated using an average spacing of 2.72 Å for convenience. We used a constant value of 4.06 × 10⁶ s−1 for all reaction events on all metals for the pre-exponential factor.
In the absence of coverage effects (Jij = Jijk = 0) all of the preceding calculations would be applied to reaction energy distributions that are delta functions, equal to the zero coverage binding energy for molecular oxygen, and independent of coverage. Non-interacting binding energies for all adsorbates can be calculated analytically using the E0 value from Table 4: ΔEO2 = 2ΔEO = 2·E0 − EO2. Coverages on all metals can be calculated analytically as θO = (1 + exp((−μO* + E0)/kBT)).
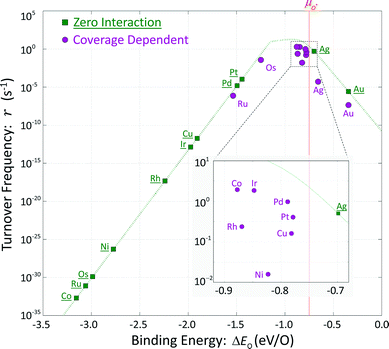
These hypothetical non-interacting rates for dissociative molecular oxygen adsorption, calculated per-site as the turnover frequency, are plotted using squares in Fig. 8. The solid line represents Langmuir-like behavior; reaction site (i.e., adjacent vacancy) coverage is random and equal to the square of the vacant binding site coverage:  . These rates conform to the Sabatier principle; weakly adsorbed species do not bind to the catalyst, and strongly adsorbed species crowd the surface blocking available reaction sites. The catalyst is optimally functional over an intermediate range of binding energies. This range is very sensitive to both the choice of kinetic model and BEP coefficients. The discontinuous derivative in non-interacting reaction rates at ΔEO = −1.15 eV corresponds to the transition from an activated reaction (Ea > 0) to a non-activated reaction (Ea = 0), and effectively serves as a bound on the range of catalyst functionality. Variations in adsorbate binding energy throughout the non-activated region do not contribute toward reaction rate and only influence surface coverage. The non-interacting model predicts Ag to exhibit the highest NO oxidation rate, and Pt to have no reaction barrier with a binding energy approximately 0.5 eV more exothermic than optimal.
In comparison, coverage-dependent reaction rates are obtained by repeating these calculations using the full set of non-zero ECIs from Table 4 and the corresponding reaction energy distributions of Fig. 7. These rates are plotted using circles in Fig. 8; they differ substantially from the non-interacting case and do not have a convenient analytic expression. Repulsive adsorbate interactions cause the atomic oxygen binding energies to span a much narrower range than the non-interacting binding energies, and shift to higher (less exothermic) values. Departures in turnover frequency from the zero interaction curve for a given atomic oxygen binding energy are a consequence of non-mean field adsorbate behavior: ΔEO2 ≠ 2ΔEO and [θ**] ≠ [θ*]2
Even taking adsorbate interaction into account, Ru and Os have coverages approaching unity and estimated rates near mean-field values, although substantially shifted in binding energy. Cobalt at zero coverage binds oxygen most strongly and demonstrates the lowest non-interacting turnover frequency; incorporating adsorbate interactions increases ΔEO by about 2.3 eV, and raises the turnover frequency by 30 orders of magnitude. Unlike Ru and Os, adsorbate interactions on Co are strong enough to prevent total coverage at reaction conditions and allow for non-vanishing overall rates. At the other extreme, Ag and Au exhibit low coverages and have nearly the same expected atomic oxygen binding energies as in the non-interacting case. However, the rates calculated for these two metals are significantly lower than would be expected for mean-field behavior. Given the cluster expansions in Table 4, low coverage adsorbates tend to create small neighborhoods of exclusion around themselves. Their local environments do not contain other adsorbates, resulting in binding energies approaching the zero-coverage limit, but with non-mean-field arrangements. Surface ordering of adsorbates that interact repulsively results in fewer available reaction sites.
Metals that exhibit intermediate coverages span a limited range of atomic oxygen binding energies: θO = [0.1, 0.9] ML corresponding to ΔEO2 = [−0.70, − 0.93] eV. Departures from mean-field behavior due to surface ordering were the differentiating factor in characterizing turnover frequencies on these metals. Predicted rates on rhodium, nickel, and copper are one to two orders of magnitude lower than predicted rates on cobalt, iridium and palladium despite comparable binding energies and coverages.
4. Discussion
Incorporating coverage dependence into reaction rates on surfaces is essential because of the implied coverages, invariant binding energies, and mean-field behavior that are intrinsic parts of the non-interacting assumption. When considering non-interacting adsorbates, only silver appears to be catalytically relevant to NO oxidation. Platinum would bind oxygen too strongly: about −1.4 eV with an associated coverage θO > 0.99 ML. Allowing for adsorbate interactions results in binding energies on most metals that appear to be potentially suitable for catalysis. Ruthenium and osmium still bind oxygen too strongly despite nearly total surface coverage; gold binds oxygen too weakly even at zero coverage. Rates on other metals for interacting adsorbates are mostly uncorrelated with their non-interacting counterparts, and the main factor distinguishing the remaining candidate materials is the degree of non-mean-field behavior. Greater oxygen adsorbate repulsion leads to this non-mean-field behavior as a consequence of increased ordering and a larger adjacency penalty.A highly active catalyst for this system would have minimally interacting adsorbates and mean-field-like behavior. However, weak adsorbate interactions also result in a limited range of catalyst utility (i.e., range of operating conditions with intermediate surface coverages). This hypothetical, highly active NO oxidation catalyst would have a narrow window of applicability: either binding too strongly (e.g., osmium and ruthenium) or not at all (e.g., gold) at most conditions. It is possible to qualitatively gauge the strength of adsorbate interactions using the 1NN coefficient in Table 4, although this measure is most appropriate at low coverages where non-linearities do not have a large contribution. Adsorbate interactions on osmium and iridium are comparatively weak, and consequently intermediate coverages are observed for these metals over a chemical potential range of about 1.7 eV. Reaction conditions used here for NO oxidation fall within this range for iridium, but outside of this range for osmium. Copper, with strongly repulsive adsorbate interactions, retains intermediate oxygen coverages over a range of chemical potentials spanning 4.0 eV. Unfortunately, the adsorbate interactions that allow for this large range of intermediate coverages also cause significant deviations from mean-field behavior. In an analogy to the Sabatier principle, optimal interactions should be strong enough to permit a robust range of operating conditions, but weak enough that non-mean-field behavior does not negatively impact reaction rates.
Under the NO oxidation reaction conditions examined here, it is unlikely that adsorbed oxygen is stable with respect to the surface oxide except on gold, silver, and possibly platinum.31,32 The formation of surface oxides or their precursors on copper, silver, and gold has been studied by other investigators.33–35 These results suggest that a surface oxide is thermodynamically preferred over adsorbed oxygen even at low oxygen coverages. Our intent here is to explore the implications of the relative magnitudes of coverage-dependent adsorption behavior on macroscopic reaction rates, rather than quantitatively determine the performance of any particular metal. The stability of a surface at reaction conditions must be considered in the design of practical catalytic materials.
5. Conclusions
Interactions between adsorbates produce coverage-dependent energetic and configurational behavior. These phenomena were explored through the use of cluster expansions to represent the coverage-dependent behavior of atomic oxygen on late transition metal surfaces. Binding energies and interaction strength vary with location in the periodic table. Oxygen binding energies and interaction strength both tended to decrease when moving down through a group; however, traveling to the right across a period corresponded to decreasing binding energy and increasing interaction strength. Binding energy and interaction strength are not simply correlated and rather depend on other properties of the metal.36These CE results were applied using a reaction model for NO oxidation, where atomic oxygen is assumed to be the most abundant surface species and the reaction is rate-limited by O2 dissociation. Scaling rules predicted regular variation of NO oxidation rates with oxygen binding energies, but the differing magnitudes of adsorbate interactions produced meaningfully different results. Metals that do not bind oxygen are inactive; metals that bind oxygen more strongly but with ordered adsorbate arrangements also tend to be inactive because statistically fewer sites are available for O2 dissociation. Metals with stronger binding, but weaker ordering tendencies are more active.
Other considerations beyond these kinetic effects influence the suitability of these metals as NO oxidation catalysts. Many of these metals are unstable to the formation of surface or bulk oxides at conditions of interest. Palladium oxide is believed to be the active form of Pd for NO oxidation.37,38 These results illustrate the diverse kinetic consequences of lateral adsorbate interactions on the kinetics of surface reactions that should be considered in the modeling of any catalytic system.
Acknowledgements
Financial support for this work was provided by the US Department of Energy under grant DE-FG0206ER15839 (KF, WFS) and by the National Science Foundation under contract numbers CBET-0731020 (DJS) and CBET-0730841 (CW). Computing resources were supplied in part by the Notre Dame Center for Research Computing.References
- R. A. van Santen, M. Neurock and S. G. Shetty, Chem. Rev., 2009, 110, 2005–2048 CrossRef PubMed.
- S. D. Miller, N. İnoğlu and J. R. Kitchin, J. Chem. Phys., 2011, 134, 104709 CrossRef PubMed.
- L. C. Grabow, B. Hvolbæk and J. K. Nørskov, Top. Catal., 2010, 53, 298–310 CrossRef CAS.
- J. M. Bray, I. J. Skavdahl, J.-S. McEwen and W. F. Schneider, Surf. Sci., 2014, 622, L1–L6 CrossRef CAS PubMed.
- R. B. Getman and W. F. Schneider, ChemCatChem, 2010, 2, 1450–1460 CrossRef CAS.
- C. Wu, D. J. Schmidt, C. Wolverton and W. F. Schneider, J. Catal., 2012, 286, 88–94 CrossRef CAS PubMed.
- H. Tang, A. Van der Ven and B. L. Trout, Phys. Rev. B: Condens. Matter Mater. Phys., 2004, 70, 045420 CrossRef.
- S. D. Miller and J. R. Kitchin, Surf. Sci., 2009, 603, 794–801 CrossRef CAS PubMed.
- S. D. Miller and J. R. Kitchin, Mol. Simul., 2009, 35, 920–927 CrossRef CAS.
- D. J. Schmidt, W. Chen, C. Wolverton and W. F. Schneider, J. Chem. Theory Comput., 2012, 8, 264–273 CrossRef CAS.
- J. Nielsen, M. dAvezac, J. Hetherington and M. Stamatakis, J. Chem. Phys., 2013, 139, 224706 CrossRef PubMed.
- D.-J. Liu and J. W. Evans, Prog. Surf. Sci., 2013, 8, 393–521 Search PubMed.
- J.-S. McEwen, J. M. Bray, C. Wu and W. F. Schneider, Phys. Chem. Chem. Phys., 2012, 14, 16677–16685 RSC.
- J. K. Nørskov, T. Bligaard, A. Logadottir, S. Bahn, L. B. Hansen, M. Bollinger, H. Bengaard, B. Hammer, Z. Sljivancanin, M. Mavrikakis, Y. Xu, S. Dahl and C. J. H. Jacobsen, J. Catal., 2002, 22, 275–278 CrossRef.
- F. Abild-Pedersen, J. Greeley, F. Studt, J. Rossmeisl, T. R. Munter, P. G. Moses, E. Skúlason, T. Bligaard and J. K. Nørskov, Phys. Rev. Lett., 2007, 99, 016105 CrossRef CAS.
- T. Bligaard, J. K. Nørskov, S. Dahl, J. Matthiesen, C. H. Christensen and J. Sehested, J. Catal., 2004, 224, 206–217 CrossRef CAS PubMed.
- G. Kresse and J. Hafner, Phys. Rev. B: Condens. Matter Mater. Phys., 1993, 47, 558–561 CrossRef CAS.
- G. Kresse and J. Hafner, Phys. Rev. B: Condens. Matter Mater. Phys., 1994, 49, 14251–14269 CrossRef CAS.
- G. Kresse and J. Furthmüller, Comput. Mater. Sci., 1996, 6, 15–50 CrossRef CAS.
- G. Kresse and J. Furthmüller, Phys. Rev. B: Condens. Matter Mater. Phys., 1996, 54, 11169–11186 CrossRef CAS.
- D. Vanderbilt, Phys. Rev. B: Condens. Matter Mater. Phys., 1990, 41, 7892–7895 CrossRef.
- G. Kresse and J. Hafner, J. Phys.: Condens. Matter, 1994, 6, 8245–8257 CrossRef CAS.
- J. P. Perdew, J. A. Chevary, S. H. Vosko, K. A. Jackson, M. R. Pederson, D. J. Singh and C. Fiolhais, Phys. Rev. B: Condens. Matter Mater. Phys., 1992, 46, 6671–6687 CrossRef CAS.
- J. P. Perdew, J. A. Chevary, S. H. Vosko, K. A. Jackson, M. R. Pederson, D. J. Singh and C. Fiolhais, Phys. Rev. B: Condens. Matter Mater. Phys., 1993, 48, 4978–4978 CrossRef CAS.
- P. E. Blöchl, O. Jepsen and O. K. Andersen, Phys. Rev. B: Condens. Matter Mater. Phys., 1994, 49, 16223–16233 CrossRef.
- D. C. Montgomery, Design and Analysis of Experiments, John Wiley & Sons, Inc., 5th edn, 2001 Search PubMed.
- C. Stampfl, H. J. Kreuzer, S. H. Payne, H. Pfnür and M. Scheffler, Phys. Rev. Lett., 1999, 83, 2993–2996 CrossRef CAS.
- S. Piccinin and C. Stampfl, Phys. Rev. B: Condens. Matter Mater. Phys., 2010, 81, 155427 CrossRef.
- B. Widom, J. Chem. Phys., 1963, 39, 2808–2812 CrossRef CAS PubMed.
- M. W. Chase and NIST, NIST-JANAF Thermochemical Tables, American Chemical Society, 4th edn, 1998 Search PubMed.
- C. Stampfl, A. Soon, S. Piccinin, H. Shi and H. Zhang, J. Phys.: Condens. Matter, 2008, 20, 184021 CrossRef.
- C. Stampfl, Catal. Today, 2005, 105, 17–35 CrossRef CAS PubMed.
- A. Soon, M. Todorova, B. Delley and C. Stampfl, Phys. Rev. B: Condens. Matter Mater. Phys., 2006, 73, 165424 CrossRef.
- W.-X. Li, C. Stampfl and M. Scheffler, Phys. Rev. B: Condens. Matter Mater. Phys., 2003, 67, 045408 CrossRef.
- H. Shi and C. Stampfl, Phys. Rev. B: Condens. Matter Mater. Phys., 2007, 76, 075327 CrossRef.
- N. İnoğlu and J. R. Kitchin, Phys. Rev. B: Condens. Matter Mater. Phys., 2010, 82, 045414 CrossRef.
- B. M. Weiss and E. Iglesia, J. Catal., 2010, 272, 74–81 CrossRef CAS PubMed.
- J. Jelic, K. Reuter and R. Meyer, ChemCatChem, 2010, 2, 658–660 CrossRef CAS.
Footnote |
| † Electronic supplementary information (ESI) available: Formation energies summary. See DOI: 10.1039/c4cy00763h |
| This journal is © The Royal Society of Chemistry 2014 |

