 Open Access Article
 This Open Access Article is licensed under a
 Creative Commons Attribution 3.0 Unported Licence
Developments and perspectives of oxide-based catalysts for the oxygen evolution reaction
E.
Fabbri
*,
A.
Habereder
,
K.
Waltar
,
R.
Kötz
and
T. J.
Schmidt
*
Electrochemistry Laboratory, Paul Scherrer Institut, 5232 Villigen PSI, Switzerland. E-mail: emiliana.fabbri@psi.ch; thomasjustus.schmidt@psi.ch
First published on 8th July 2014
Abstract
The growing need to store large amounts of energy produced from renewable sources has recently directed substantial R&D efforts towards water electrolysis technologies. Although the description of the electrochemical reaction of water electrolysis dates back to the late 18th century, improvements in terms of efficiency and stability are foreseen for a widespread market penetration of water electrolysers. Particular advances are required for the electrode materials catalysing the oxygen evolution reaction (OER) at the anode side, which has slow kinetics and thus is one of the major sources of the cell efficiency loss. In recent years, high-level theoretical tools and computational studies have led to significant progress in the atomic-level understanding of the OER and electrocatalyst behaviour. In parallel, several experimental studies have explored new catalytic materials with advanced properties and kinetics on a technical relevant level. This contribution summarises previous and the most recent theoretical predictions and experimental outcomes in the field of oxide-based catalysts for the OER, both operating in acidic and alkaline environments.
 E. Fabbri | Emiliana Fabbri completed her PhD in Materials Science in 2008 at the University of Rome Tor Vergata. Then, she joined the University of Florida as a research visitor and in 2009 she held a scientist position at the International Center for Material Nanoarchitectonics (MANA) at the National Institute for Material Science (NIMS) in Japan. Since 2012, she has joined the Electrochemistry Laboratory at Paul Scherrer Institut (PSI), focusing on materials development for energy conversion and storage. |
 A. Habereder | Anja Habereder studied Materials Science at Technische Universität Darmstadt, Gemany. In October 2013, she started her PhD at Paul Scherrer Institut (PSI), focusing on lanthanum-based perovskite oxide electrocatalysts for oxygen evolution and reduction in alkaline media. |
 K. Waltar | Kay Waltar studied Physics at the Swiss Federal Institute of Technology in Zürich (ETH Zürich). He started his PhD at Paul Scherrer Institute (PSI) in October 2013 with main focus on the development of oxygen evolution catalysts for application in PEM electrolyzers. |
 R. Kötz | Rüdiger Kötz received his PhD in Physics from the Technische Universität Berlin. After postdoctoral years at the Case Western Reserve University in Cleveland, Ohio, and at the Fritz Haber Institut der Max Planck Gesellschaft in Berlin, he joined the ABB Corporate Research Centre in Baden, Switzerland in 1982. Since 1989, he has been leading the Electrocatalysis and Interfaces group of the Electrochemistry Laboratory at Paul Scherrer Insitut (PSI) in Switzerland. Throughout his career, his research continued to aim at the characterization of the solid electrolyte interphase, the understanding of electroactive materials and the extrapolation of electro-chemical processes to application. |
 T. J. Schmidt | Thomas J. Schmidt studied Chemistry at the University of Ulm in Germany before he continued his career as a postdoc and a scientist at Lawrence Berkeley National Laboratory and at Paul Scherrer Institut (PSI), respectively. After eight years in industrial fuel cell research (BASF Fuel Cell) as Director of R&D, he became the Chair of Electrochemistry at ETH Zürich and the Head of the Electrochemistry Laboratory at PSI in 2011. In addition, he is also the Director of the Swiss Competence Center for Energy Research Heat & Electricity Storage. His work is focused on all aspects of electrochemical energy conversion and storage. |
1 Introduction
To support a sustainable economic growth, it has become more and more important that the energy utilization efficiency and the renewable energy implementation should be further exploited. Primary renewable energy sources, such as wind and solar power, have the advantages of being sustainable and relatively benign in terms of impact on the environment and human health. However, a significant disadvantage of most renewable energy sources is that they are intermittent on daily, seasonal and also regional scales with considerable variability in supply. This uncertainty in energy supply can be eliminated by connecting a local energy storage system to an electricity producing unit.1 In this framework, water electrolysers can play a fundamental role in the development of a sustainable energy system. Water electrolysers are electrochemical energy conversion devices producing hydrogen (and oxygen) from the intermittent energy source. The hydrogen energy vector represents an alternative to electricity storage in batteries since its reconversion into electricity via fuel cells opens up independent scaling of power and energy due to the separation of the hydrogen storage from the conversion device.Since its first observation by van Trostwijk and Deiman in 1789 (ref. 2 and 3), water electrolysis has been investigated in depth, but substantial efforts are still needed to meet the requirements for practical applications. In fact, while possessing the advantages of flexibility, almost zero emission, and production of high purity gases, water electrolysis needs to be improved in terms of efficiency and durability to become economically attractive.1
The main classification of water electrolysers can be done on the basis of the operating temperature and electrolyte nature. Low-temperature electrolysers can be subdivided into (acidic) polymer electrolyte water electrolysers (PEWEs) and alkaline water electrolysers (AWEs). PEWEs use a solid polymer electrolyte, which selectively conducts positive ions such as protons and creates a local acidic environment. The main advantages of PEWEs are fast kinetics of the cathodic hydrogen evolution reaction and high-voltage efficiencies at high current densities. Furthermore, they can produce pure hydrogen at relatively high pressures with over 150 bar being demonstrated,4 offering the possibilities of storing hydrogen directly without or only with small further mechanical compression.4,5 However, under the typical operation conditions of a PEWE, only few electrode materials can present adequate stability. Therefore, the anodic and cathodic reactions are generally catalysed by noble metal-based catalysts such as Pt, Ru and Ir. The main advantage of AWEs is the possibility of using alternative catalysts to noble metals and cheap flow fields since several materials present adequate stability when in contact with an alkaline electrolyte. Furthermore, the alkaline medium allows a more favourable oxygen electrocatalysis at the anode side compared to the acidic one.6
Overall, the cathodic and anodic reactions occurring at the PEWE and AWE electrodes can be described by the following equations:


Common to both PEWEs and AWEs is the significant overpotential occurring at the anode side where the oxygen evolution reaction (OER) takes place. For this reason, the OER has been intensively studied for many decades in order to elucidate the reaction mechanism and to minimise the energy loss during water electrolysis. Improving OER kinetics would indeed favour a widespread market penetration of both PEWEs and AWEs. The catalyst that generally shows the best trade-off between catalytic activity and stability, both in acidic and alkaline media, is IrO2. However, since iridium is quite expensive and, as a typical secondary metal, resource limited,7 many research efforts have been directed towards the development of OER catalysts with a reduced amount of Ir or based on other transition metal oxides. This is particularly the case for AWEs since base metals, such as cobalt, nickel and perovskite oxides, proved to be quite stable and active in alkaline media.
In the present Perspective, current issues and recent developments in catalyst materials for the OER will be summarised and discussed. Fundamental aspects of the OER will be addressed particularly as well as practical requirements for oxygen evolution catalysts. Selected catalyst materials, both for PEWE and AWE applications, will also be described in detail. All catalyst materials will be examined as oxides since the high anodic potentials during water electrolysis inevitably lead to the oxidation of the electrode material even when studies are started with pure metals.
2 Mechanistic insight into oxygen evolution reaction
2.1 Definition of catalytic activity and kinetic parameters for the OER
A good survey on oxygen evolution catalysis was published in 1986 by Matsumoto and Sato.8 In this review and in many other studies, the Tafel slope has often been used to compare the catalytic activity towards the OER of catalysts. For multistep reaction mechanisms, the Tafel slope is defined as the dependency of the ohmic drop-corrected overpotential η on the current density j: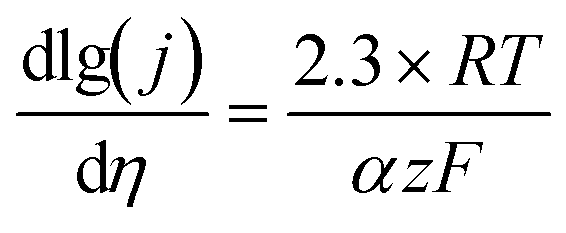 | (1) |
 | ||
| Fig. 1 Sketched Tafel plots of three different catalysts based on their activity data from the literature: cobalt black (40 wt% KOH at 80 °C),9 RuO2 (1 M H2SO4 at 20 °C)10 and a composite electrode consisting of FeOOH nanowires and Ni foam (0.1 M NaOH).11 Although the values of the Tafel slopes of the three catalysts are quite similar, the exchange current density or the overpotential at a certain current density (here selected as at 1 mA cm−2) can show significant differences. | ||
In the case of the oxygen reduction reaction (ORR), in order to compare the activity of different catalysts, it is widely common and accepted to consider the kinetic current at 0.9 V (RHE) as an activity parameter where the effects of mass transport limitations are almost negligible.12 On the other hand, in the case of the OER, apart from the Tafel slope, there is no common parameter to describe the activity of different catalysts. Different kinetic parameters can be used in combination with or without the Tafel slope to define the activity of oxygen evolution catalysts. In the following, we examine different options, evaluating advantages and disadvantages of different activity parameters. Table 1 gives an overview of possible parameters that could be used in combination with the Tafel slope to characterise the catalytic activity of a catalyst material towards the OER.
| Parameter | Symbol |
|---|---|
| Exchange current density | j 0 |
| Potential at a defined current density | ϕ(j), e.g. at 10 A gmetal−1 |
| Current density at a defined potential | j(ϕ) |
For highly irreversible reaction like the OER and the ORR, the exchange current density j0 cannot be used as the intrinsic factor of catalyst activity since its experimental determination is highly erroneous. The value of j0 can be obtained by extrapolating the Tafel plot at zero overpotential. Due to the logarithmic scale of the current axis, very small inaccuracies in the Tafel slope, i.e. derived from the ohmic drop correction or the linear fitting, can lead to large errors in the exchange current density estimation. In addition, due to the high irreversibility of the reaction, extrapolations towards the equilibrium potential have to be performed over many orders of magnitude in current density, increasing the error bars for the j0 values. For the alternative parameters, the main disadvantage is that their values are strongly dependent on the measuring conditions, such as the scan rate or the direction of the potential sweep (anodic or cathodic direction). To eliminate this issue, an accurate way is to measure the current and potential response potentiostatically and galvanostatically, respectively. After a short holding time, almost steady-state conditions can be achieved13 and the appearing signal is mainly controlled by the kinetics of the OER. Therefore, the measurements of the steady-state current at a defined potential or the potential at a defined steady-state current together with the value of the Tafel slope might represent a valid couple of activity parameters. Although rather arbitrary, among different possible combinations, we would like to propose as an activity parameter the Tafel slope combined with the potential value measured at 10 A gmetal−1. Particularly, we have selected as an activity parameter the potential at a certain current value normalised by the catalyst (metal) mass, not by the geometric area, roughness factor, or catalyst surface area for reasons that will be explained in the following:
(i) The potential at a steady-state current density with geometric surface area normalisation cannot be used as an activity parameter because it does not take into account the catalyst loading. For example, samples of the same material can show different potentials at a defined mA cmgeo−2 depending on the amount of catalyst used.
(ii) The current normalisation by the catalyst roughness factor or the electrochemical active surface area (i.e., the specific current density) can provide the intrinsic value of the material catalytic activity. However, for most of the investigated catalysts, it is rather non-trivial to determine the roughness factor with reasonable accuracy either by cyclic voltammetry or impedance spectroscopy, and even an optimised procedure leads to accuracies within an order of magnitude.14 Therefore, the current normalisation by the catalyst roughness factor would represent the best choice as an activity parameter, analogous to the case of the ORR. However, this parameter is not (yet) experimentally accurate at the moment.
(iii) The potential measured at a current normalised by the surface area of the catalyst, i.e. measured by Brunauer–Emmett–Teller (BET) analysis, could be also a good activity parameter for many catalyst materials. However, the BET surface area does not always correspond to the electrochemical active surface area of the catalyst. For example, in the case of ABO3 perovskite catalysts, the active site is mostly considered to be the B-site cation of the perovskite structure.15,16 Therefore, considering the current normalised by the BET surface area would not allow a fair comparison between catalysts with different surface densities of active sites.
(iv) The turnover frequency (TOF) would be a good candidate for an activity parameter since it also provides the intrinsic catalytic activity; however, as for the calculation of the roughness factor, the evaluation of the electrochemical active sites is still rather an issue.
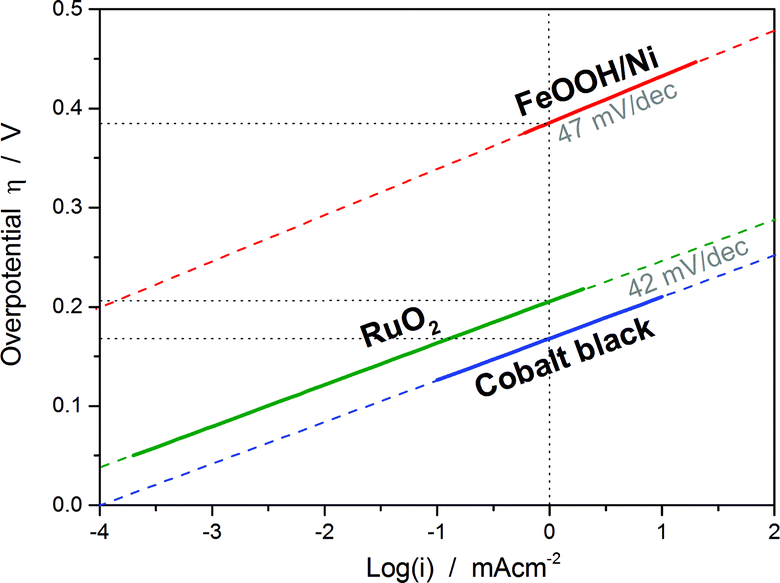
We are aware that there are also drawbacks related to the use of the potential at a fixed mass normalised current (mass specific current density) as an activity parameter. It does not represent the intrinsic catalytic activity of the material and it does not allow a fair comparison of the catalytic activity between catalysts with significantly different particle sizes and/or molecular masses. Furthermore, it does not allow a direct comparison with the theoretical activities, which are generally normalised by active sites. However, in the view of the previous discussion, we believe that at present it represents the activity parameter least affected by experimental inaccuracies together with the Tafel slope. For the measurement of the Tafel slope, we recommend a low scan rate (below 5 mV s−1) or even better a quasi-stationary current/potential curve, i.e. holding the potential until an almost steady-state current is achieved (the holding time mostly depends on the material properties). Fig. 2 shows a comparison between the Tafel curves of a commercial IrTiO2 electrode (Umicore AG & Co.) obtained by a cyclic voltammetry measurement at 5 mV s−1 and by a chronoamperometry experiment by holding each potential for 30 s in 20% O2-saturated 0.1 M HClO4. As shown in Fig. 2, chronoamperometry measurement eliminates capacitive current effects (see the potential region between 1.4 and 1.5 vs. RHE in Fig. 2), allowing a more reliable analysis of the Tafel slope.
 | ||
| Fig. 2 Tafel curves of a commercial IrTiO2 electrode (Umicore AG & Co.) obtained by a cyclic voltammetry measurement at 5 mV s−1 and by a chronoamperometry experiment by holding each potential for 30 s in 20% O2-saturated 0.1 M HClO4 at room temperature and a rotation speed of 900 rpm. | ||
2.2 Reaction mechanism and main parameters influencing the OER kinetics and thermodynamics
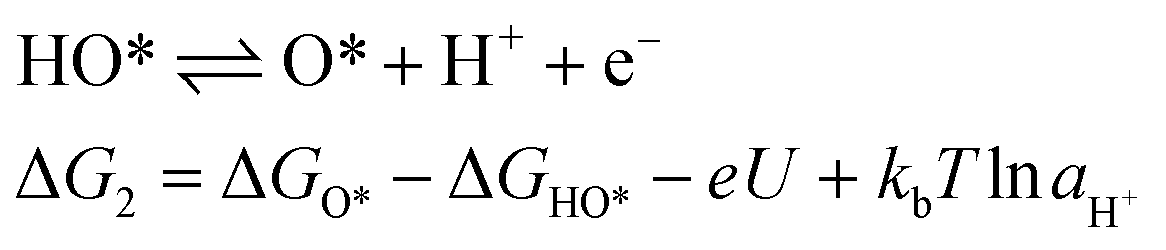
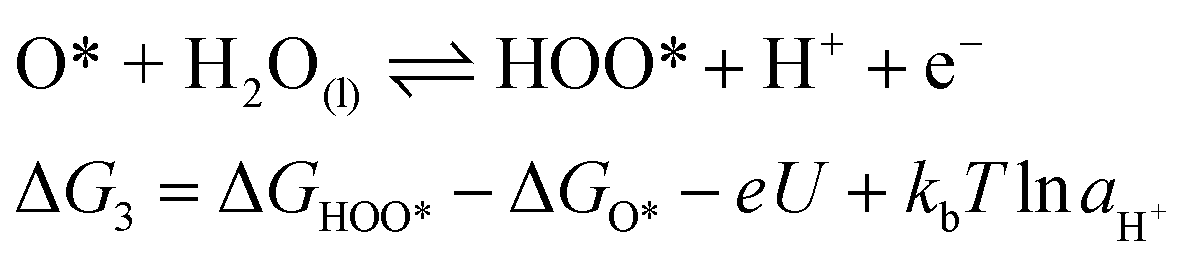
In 1986, Matsumoto and Sato8 summarised the different reaction mechanisms proposed for the OER in acidic as well as in alkaline media (Table 2). In the described mechanistic pathways, the “S” characterises the catalytically active site. In acid solution, the most recognised mechanisms are the electrochemical oxide path and the oxide path. In alkaline solutions, all of the proposed reaction mechanisms have the initial adsorption of the hydroxide ions on the catalytically active site as a common step, followed by different intermediate reaction steps. Overall, both in acidic and in alkaline environments, the proposed mechanistic schemes for the OER comprise different elementary reaction steps and involve several surface adsorbed intermediates. The overall reaction overpotential is commonly thought to be related to the kinetic constraints of the individual reaction steps.17 The elementary reaction step with the highest kinetic activation barrier is generally defined as the rate-determining step (RDS). While for many years the RDS has been a central topic, recently the attention has been additionally pointed towards the potential-determining step (PDS), which highlights more the thermochemical aspects of the OER overpotential.17–23 The PDS represents the step with the maximum change of Gibbs free chemisorption energy of two subsequent adsorbed intermediates (ΔGmax). The theoretical overpotential (ηOER) related to the PDS can be calculated under standard conditions at U = 0 V vs. SHE as:18 | (2) |
| Acid solution | |
|---|---|
| A) Electrochemical oxide path24 | B) Oxide path24 |
| (a) aS + H2O → S–OH + H+ + e− | (a) S + H2O → S–OH + H+ + e− |
| (b) S–OH → S–O + H+ + e− | (b) 2S–OH → S–O + S + H2O |
| (c) 2S–O → 2S + O2 | (c) 2S–O → 2S + O2 |
| C) Krasil'shchkov path25 | D) Wade and Hackerman's path26 |
| (a) S + H2O → S–OH + H+ + e− | (a) 2S + 2H2O → SO + SH2O + 2H+ + 2e− |
| (b) S–OH → S–O− + H+ | (b) SO + 2SOH− → 2S + SH2O + O2 + 2e− |
| (c) S–O− → S–O + e− | |
| (d) 2S–O → 2S + O2 | |
| Alkaline solution | |
|---|---|
| a S represents a surface active site. | |
| E) Electrochemical oxide path24 | F) Oxide path24 |
| (a) S + OH− → S–OH + e− | (a) S + OH− → S–OH + e− |
| (b) S–OH + OH− → S–O + H2O + e− | (b) 2S–OH → S–O + S + H2O |
| (c) 2S–O → 2S + O2 | (c) 2S–O → 2S + O2 |
| G) Krasil'shchkov path25 | H) Yeager's path27,28 |
| (a) S + OH− → S–OH + e− | (a) S + OH− → S–OH + e− |
| (b) S–OH + OH− → S–O− + H2O | (b) Sz–OH → Sz+1–OH + e− |
| (c) S–O− → S–O + e− | (c) 2Sz+1–OH + 2OH− → 2S + 2H2O + O2 |
| (d) 2S–O → 2S + O2 | |
| I) Bockris path15 | |
| (a) S + OH− → SOH + e− | |
| (b) SOH + OH− → S–H2O2 + e− | |
| (c) S–H2O2 + OH− → S–O2H− + H2O | |
| (d) S–H2O2 + S–O2H− → H2O + OH− + O2 | |
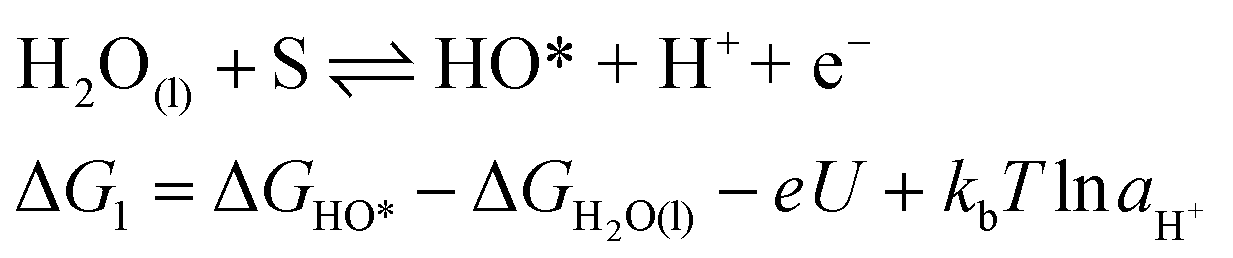
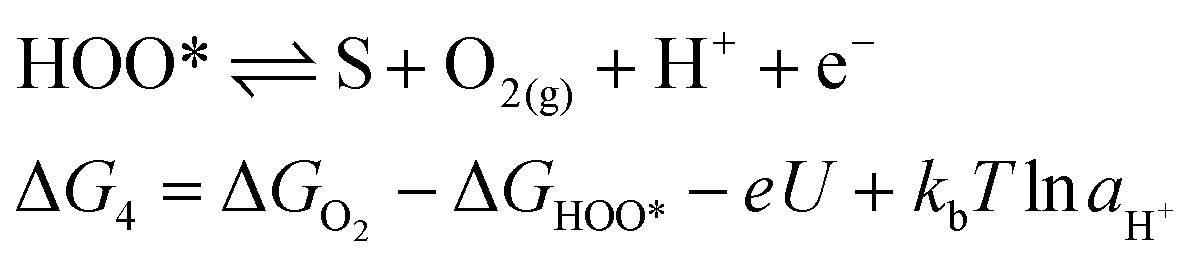
For an ideal catalyst, the ΔG associated with each elementary reaction step is equal to 1.23 eV as estimated by Man et al.18 through DFT calculations at pH = 0 under standard conditions at potential of U = 0 V vs. SHE (Fig. 3a). In this ideal case, there will be no overpotential due to thermodynamic hindrance. Clearly, this scenario does not consider kinetic barriers. Furthermore, the DFT calculations are based on the assumption that the OER follows a four-step mechanism described by eqn (3)–(6) in Table 3 (ref. 18) where ΔG1–4 denotes the standard Gibbs energy change of the reaction and ΔGoxygenated species denotes the standard Gibbs energy of formation of the respective species.
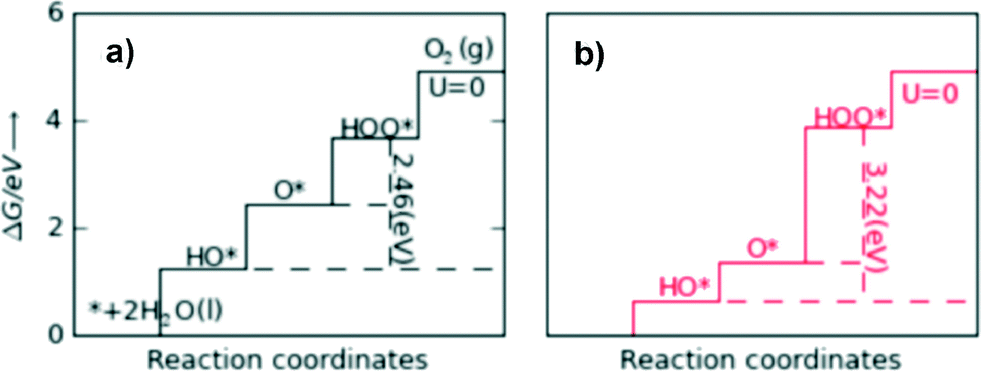 | ||
| Fig. 3 Standard free energies at U = 0 V for an ideal catalyst (a) and for LaMnO3 (b). For real catalysts, ΔG0HOO* − ΔG0HO* (vertical dashed lines) is approximately constant with an average value of 3.2 eV, whereas the ideal value is 2.46 eV. Reproduced with permission from ref. 18. | ||
|
(3) |
|
(4) |
|
(5) |
|
(6) |
In contrast to the case of an ideal catalyst where the ΔG associated with each elementary reaction step is equal to 1.23 eV, a real catalyst generally presents a PDS with a larger ΔG. Fig. 3b shows as an example the case of LaMnO3 catalysts;18 the ΔG between the reaction steps associated with O* and HOO* reaction intermediates (reaction (5) in Table 3) is the largest, and thus, it represents the thermochemically less favourable step (PDS).18 An improved catalytic activity towards the OER using the aforementioned catalyst could be achieved by reducing the ΔG associated with the peroxide formation. However, for several types of catalysts (rutile, perovskite, spinel, rock salt, and bixbyite), a linear scaling relation exists between the chemisorption energies of the different surface intermediates,18i.e. if the energy associated with one reaction step is changed, the others do too. It was pointed out by Koper19 and Man et al.18 that the binding energies of HO* and HOO* are related to each other by a constant energy value of approximately 3.2 eV at U = 0 V (see Fig. 3b), both in the case of metals and oxide surfaces and regardless of the binding site. Since this difference is higher than the ideal one (2.46 eV, see Fig. 3a), a real catalyst generally shows a minimum theoretical overpotential. On the basis of this predicted linear scaling relation, the best approximation to an ideal catalyst for the OER would be a material able to minimize the unfavourable energetic relationship between intermediates. The linear scaling between the intermediate bonding strengths also implies that the OER activity can be plotted as a function of the adsorption energy of only one involved species, for example the O* species. Fig. 4 shows the theoretical activity of the four reaction steps described by eqn (3)–(6) as a function of the oxygen binding energy.23 Materials with high catalytic activity towards the OER would stay on the horizontal dashed line (representing the equilibrium potential) and present an O* binding energy of around 2.3 eV. The volcano plot in the bottom part of Fig. 4 also indicates that for weak and strong O* surface binding energies, the OER activity would be limited by the O* (red line) and the HOO* (green line) formation steps, respectively.23 For example, RuO2 binds oxygen a little too weakly, while IrO2 binds O* too strongly.23 A similar concept of a single microscopic parameter governing the oxygen evolution activity was already introduced in the early 1980s by Brockis and Otagawa15 and by Trasatti.29 Brockis and Otagawa15 proposed a correlation between the catalytic activity (experimentally measured Tafel slope or current density at a defined overpotential) of LaBO3 perovskites and the B–OH bonding strength as well as between the catalytic activity and the number of electrons occupying the antibonding orbitals (discussed in detail in section 4.4).15
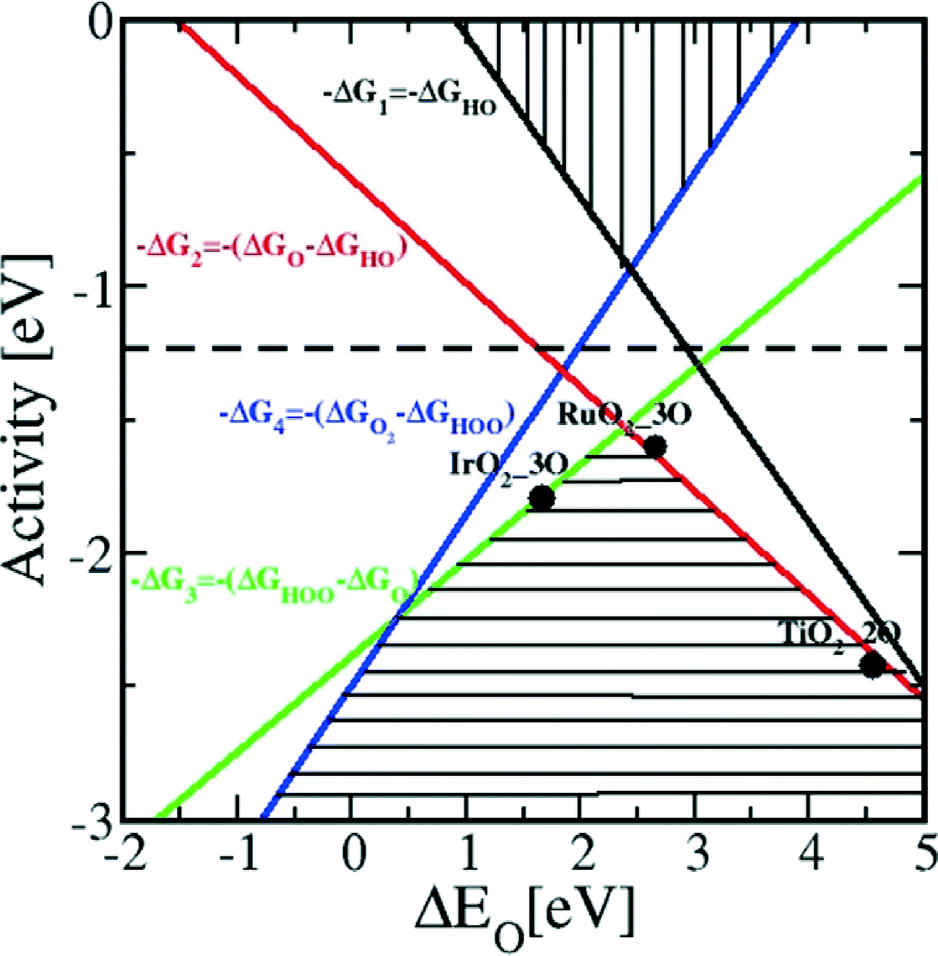 | ||
| Fig. 4 Theoretical OER activity, defined as the negative change of the Gibbs free energy (−ΔG), of the four reaction steps described in eqn (3)–(6) as a function of the oxygen binding energy. Reproduced with permission from ref. 23. | ||
In a more recent work of Man et al.,18 the difference between the energy states of two subsequent intermediates (ΔGOHOO* − ΔGOHO*) has been taken as a descriptor for the catalytic activity of several different compounds, revealing a volcano relationship (Fig. 5). The difference of the bonding strength follows the Sabatier principle:30 in the case of surfaces that bind oxygen too weakly, intermediates cannot easily react and the potential is limited by the oxidation of HO*. In the opposite case of strong oxygen bonding, the intermediate states and the adsorbed products are quite stable and the potential is limited by the formation of HOO* species. The optimum case is therefore a mean bonding strength, such as in the case of RuO2, Co3O4, NiO, PtO2, SrCoO3, LaNiO3, SrCoO3 and SrNiO3 (top of the volcano plots in Fig. 5).
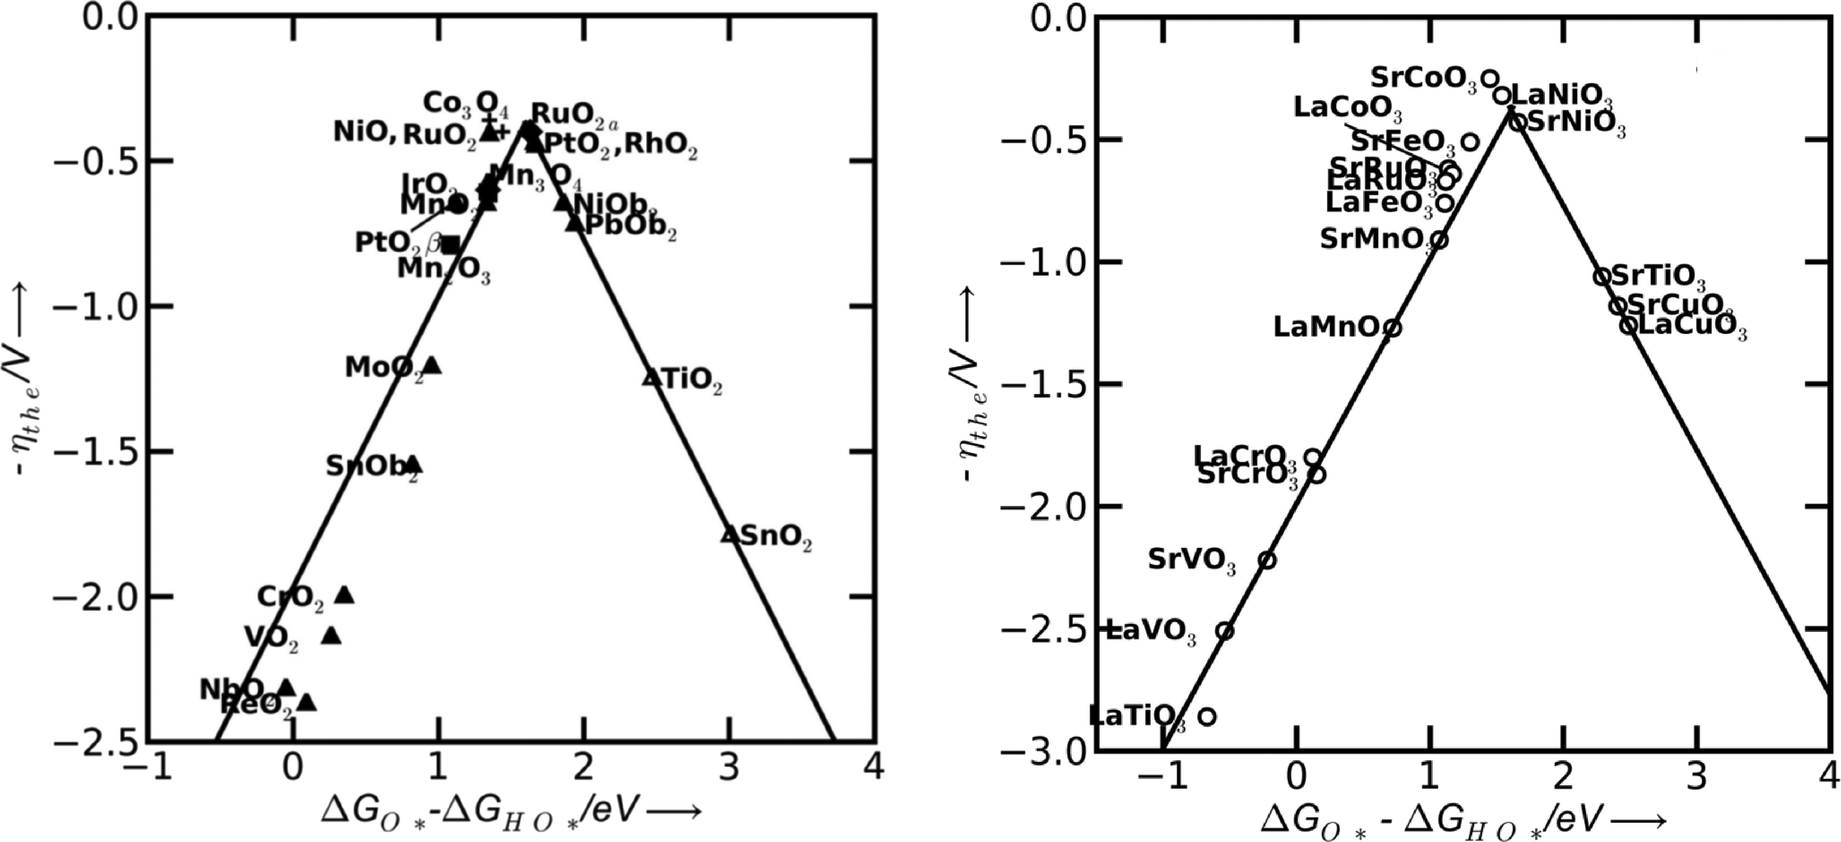 | ||
| Fig. 5 Theoretical overpotential for oxygen evolution vs. the difference between the standard free energy of two subsequent intermediates (ΔG0O* − ΔG0HO) for various binary oxides (left) and perovskite oxide (right). Reproduced with permission from ref. 18. | ||
Besides the importance of the binding energy of the reaction intermediates, the specific adsorption of ions from the electrolyte can also play a critical role in the OER. Adsorption of anionic impurities on the catalyst surface can block some of the electrocatalytic active sites and hinder the oxygen evolution reaction. While the influence of spectator adsorption on the catalytic activity towards the ORR has been investigated in detail,31,32 in the case of the OER, only little work has been carried out so far. However, this aspect may also be crucial in developing advanced catalysts with a designed electrochemical interface.17
To this point, we have discussed the importance of understanding the RDS, the bonding strength of reaction intermediates and the presence of anion adsorbates for the OER. A different aspect worth to consider is the nature of the electrochemical interface created at the surface of metal oxides in contact with an aqueous electrolyte. Several oxides used as catalysts for the OER exhibit metallic electronic conductivity (e.g. RuO2, IrO2 and LaNiO3), which reduces the ohmic drop in the electrode bulk material. In addition to these materials, n- and p-type semiconducting oxides (e.g. NiO, Co3O4 and LaCoO3) have also been widely investigated as oxygen evolution catalysts. When a metal or a semiconductor electrode is inserted in an electrolyte, an electrical double layer is formed. Compared to metals, semiconductors provide much lower charge carrier concentration, and thus, a large space charge layer is formed at the surface. In general, at anodic potentials typical for the OER, the potential drop in the space charge layer will be negligible for the p-type semiconductor due to the accumulation of holes at the surface. In contrast, for n-type semiconductors, the space charge layer at the interface leads to an additional barrier for charge carriers.8 Therefore, p-type semiconducting oxides or metallic-like oxide conductors should be more suitable catalyst materials for the OER than n-type semiconductors.8
2.3 Requirements for oxygen evolution catalysts
Besides a high catalytic activity, an optimal catalyst material must also fulfil other requirements. A high surface area is generally required since it allows minimising the amount of required catalyst, particularly when noble metal-based catalysts are used.29 A common way to achieve a high surface area is to use porous powders synthesized by wet chemistry methods. It is worth noting that the specific surface area must not be confused with the active area, i.e. the number of active sites involved in the electrocatalytic reaction. Therefore, a high specific surface area might not be directly turned into a high surface density of active sites. Apart from the specific surface area, a high electrical conductivity at high electrode potentials (where oxidation state can change compared to the equilibrium state) is also required to minimise the ohmic drop in the material.29Another central aspect in the development of advanced catalyst materials for the OER is the catalyst current selectivity. Indeed, anodic currents at high potentials (i.e. above 1.4 V vs. RHE) can result either from the occurrence of the OER or from catalyst and/or support oxidation/corrosion. Furthermore, analogous to the case of the ORR, a certain catalyst might oxidise water via 2 electrons instead of 4, leading to production of peroxide species instead of oxygen. To differentiate the measured anodic currents, i.e. to study the catalyst current selectivity, different techniques can be used. By in situ mass spectroscopy, one can correlate the concentration of evolved oxygen to the measured current to determine the catalyst selectivity.33 Another method to estimate the catalyst selectivity is the rotating ring-disk electrode (RRDE) technique. Oxygen evolved by the catalyst can in principle be reduced on the surrounding Pt-ring electrode when the latter is potentiostatically held in a potential range where oxygen reduction is purely under diffusion control.
The overall number of transferred electrons n(e−) during the OER can be calculated if the disk current Id, the ring current Ir and the setup collection efficiency N are known.34
| n(e−) = 4Id × N/Ir | (7) |
The main issue in using RRDE for the evaluation of the catalyst selectivity is related to the relatively fast local oxygen saturation and bubble formation. It has been recently suggested by McCrory et al.14 that the optimal current density for minimising the local oxygen saturation and bubble formation at the disk electrode is 1 mA cmgeo−2 at a rotation speed of 1600 rpm in a N2-saturated electrolyte.
Another issue in water electrolysis is the wettability of the electrodes. Due to formation of molecular hydrogen and oxygen, gas bubbles form on both electrodes during water electrolysis. Unfortunately, as long as they are not grown big enough, they will not detach from the surface, leading to a high ohmic resistivity. At the surface, which is covered by gas bubbles, the electron transfer is temporary blocked so that this catalyst surface area cannot participate in the electrocatalytic process. This also implies that a high local current density can flow through a part of the electrode area, affecting the catalyst stability. The detachment of gas bubbles can be accelerated mechanically by a circulated electrolyte; another way is to reduce the surface tension between the electrolyte and the electrode. This can be done either by using additives in the electrolyte or by increasing the wettability of the catalyst material. By increasing the hydrophilicity of the catalyst material, the electrolyte can replace small gas bubbles at the catalyst surface more easily.35 A complementary approach is to develop a nanostructure material with an optimized pore size and surface area able to minimise the gas bubble growth and promote the detachment of small bubbles. For example, it has been recently shown that allowing a facile removal of gas bubbles from the RuO2 electrode surface could simultaneously improve catalyst activity and achieve stability.36
Two additional requirements for the future use in electrolysers are, on one hand, the health safety of the used materials. On the other hand, it is important that the raw materials for the catalyst are available and inexpensive enough for an economical large-scale production.29
Last but not least, corrosion stability is a fundamental requirement for the implementation of a catalyst material into an operative system. During operation, the anode side experiences severe oxidative conditions. Additionally, in PEWE applications, the anode is also exposed to an acidic environment. Materials such as carbides or nitrides might not be used as catalyst materials because they will be generally driven to an irreversible oxidation during the OER. In addition, the use of carbon as a catalyst support must be avoided in electrolyser applications since its high operative potential will lead to carbon oxidation and consequent failure of the anodic structure. Oxide-based catalysts can also undergo corrosion/dissolution during operation. This is, for example, the case of the most active oxygen evolution catalyst, RuO2; for this catalyst material, the onset of oxygen evolution coincides with the onset of Ru corrosion.37,38 The detailed mechanism of oxygen evolution on RuO2 and its stability issue will be discussed in the following section (3.1). It is worth mentioning that even though corrosion stability should be a central topic in electrode development, only limited studies have deeply investigated the corrosion stability of oxygen evolution catalysts both for PEWE and for AWE applications. From a mechanistic point of view, a deeper analysis to establish whether a correlation exists between the catalyst activity and the catalyst corrosion mechanism could also lead to the understanding of design principles for novel catalysts and/or to the definition of the best trade-off between activity and stability.
3 Catalyst materials for polymer electrolyte water electrolysers (PEWEs)
The electrochemical splitting of water performed in acidic polymer electrolyte water electrolysers (PEWEs) has several distinct advantages as compared to that performed in alkaline systems. Superior kinetics of the cathodic hydrogen evolution reaction, high electrolyte conductivity and the potential capability to be operated at pressures above 50 bar make them favorable to use.4 While the cathodic hydrogen evolution takes place with excellent kinetics on Pt-based catalysts, the major challenge is to find an anodic OER catalyst offering fast kinetics and is stable in a harsh oxidising environment of low pH values and high electrode potentials. Mixed oxides of iridium and ruthenium are state-of-the-art anode catalyst materials in conventional PEWE technologies.5,39 In order to be applicable to large-scale production, the amount of the noble metals Ir and Ru has to be reduced by around one order of magnitude5 or even be avoided. Both iridium and ruthenium are one of the scarcest, non-radioactive metals in the earth's crust and are typically produced as side products during Pt or Ni mining. Being secondary metals, the amount of annual Ru or Ir production is dependent only on the Pt production rate, which means in turn that increasing demands of Ir or Ru will not increase their production rate, but their cost due to its coupling and dependence on Pt or Ni mining.7Therefore, in order to reduce (noble metal) investment cost, high efficiencies at current densities of several A cm−2 are desirable. To tackle these issues, the main focus must be placed on the catalyst material side where the choice of composition and morphology has a direct impact on the performance and costs of PEWE systems. Investigations on suitable catalyst materials for the OER in acidic electrolytes have been performed and will be reviewed in the following section, focusing on catalytic activity and stability. The catalysts are listed with respect to the number of different metallic components of which they are composed. The early investigations in this field mostly focused on metal catalysts; however, it must be considered that during potential cycling between 0.2 V and 1.4 V (RHE), most of the metal electrodes form a hydrous oxide layer at the surface,40 which can extend into the bulk to different degrees depending on the catalyst structure.41 Therefore, metal catalysts are subsequently listed among the metal oxide electrocatalysts.
3.1 Single-metal oxide electrocatalysts
The catalytic activities of several platinum group metal and metal alloy catalysts in acidic solution were potentiostatically determined by Damjanovic et al.42 The catalytic activity decreases in the order Ir > Rh > Pt, a trend which is almost opposite to the one determined for the ORR. Furthermore, an adverse effect on the OER activity has been elucidated when platinum was alloyed with superior catalytic materials.43 Miles and Thomason44 qualitatively confirmed Damjanovic's order of activity under galvanostatic conditions and additionally investigated ruthenium, gold and niobium. The results of their survey can be summarised in the activity order Ru > Ir > Pd > Rh > Pt > Au > Nb. These findings mostly fit the volcano plot18 shown in Fig. 5, which indicates RuO2 as the most active material followed by RhO2, IrO2 and PtO2.18 Discrepancies between experimental and theoretical activity values might result from the fact that computational calculations only consider ideal surfaces and, in turn, use as activity descriptor the oxygen adsorption energy on model surfaces. However, under experimental conditions, several other surface parameters (i.e. defects, crystal edges or formation of hydroxide layers) can play a crucial role. For the same reason, depending on the processing conditions, catalyst materials with identical compositions can experimentally show different OER activities. Therefore, both theoretical and experimental results for OER catalysts should be analysed with due care since the former only considers ideal surfaces and the latter provides results strongly influenced by the catalyst preparation process and surface state.The superior catalytic properties of Ru- and Ir-based oxides44 in acidic environment and their high electrical conductivities45 have shifted for decades. Both materials have been the focus of detailed investigations as suitable oxygen evolution catalysts.
RuO2 is generally recognised as the material showing the highest catalytic activity among the single-transition metal oxides.29,43,46 Nevertheless, different activities have been reported for RuO2 depending on processing conditions and physical and chemical properties. Single crystal samples exhibit a dissimilar Tafel behaviour depending on the crystal orientations,47 proving that similar to the ORR,48 the OER is also a structure sensitive reaction. However, RuO2 single crystals show worst performance for the OER than thermally prepared RuO2 films in terms of lower onset potential and Tafel slope.49,50 These results indicate that the activity of polycrystalline RuO2 cannot be solely explained by the averaged contribution of the individual crystalline orientations.51
The reaction mechanism of oxygen evolution on various types of RuO2 electrodes has been experimentally investigated by several authors.37,52,53 A detailed mechanism, which follows the electrochemical oxidation path described in Table 2 has been proposed by Kötz and coworkers37,54 for anodically grown hydrous ruthenium oxide films and is illustrated in Fig. 6.
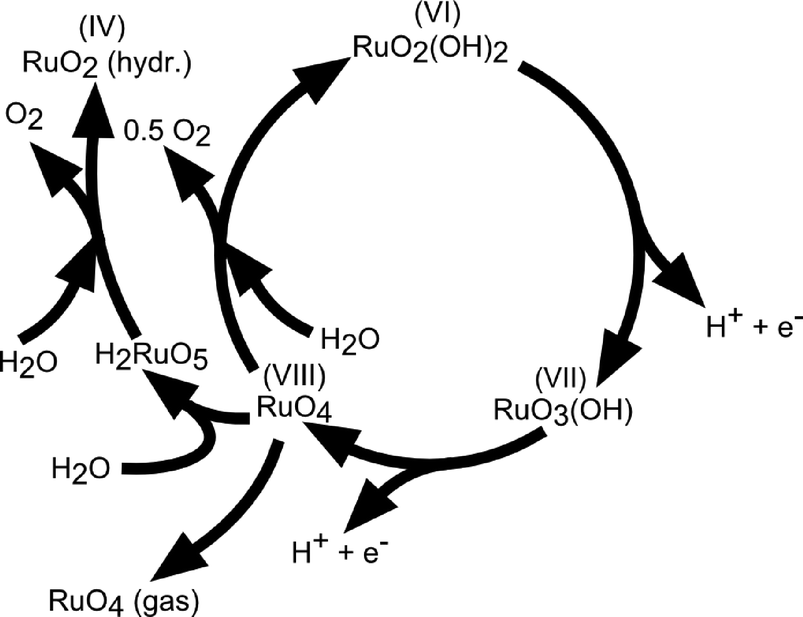 | ||
| Fig. 6 Sketch of the charge storage and oxygen evolution reactions on anodically grown hydrous ruthenium oxide films. Reproduced with permission of The Electrochemical Society.37 | ||
During potential cycling of a Ru metal electrode, the formation of a hydrous oxide layer has been detected at the surface and explained by an oxidation–reduction cycle of Ru cations. Prior to oxygen evolution, Ru is assumed to be in a VI+ oxidation state, which was experimentally confirmed on thermally deposited RuO2 films. Upon an anodic potential sweep into the oxygen evolution regime, Ru is further oxidised into an VIII+ valence state accompanied by two single deprotonating steps to keep the total charge balanced. RuO4 then either dissociates into oxygen for the initial hydrous Ru(VI) oxide to complete the evolution cycle or dissolves, which is concomitant with the colouring of the electrolyte.55 The existence of the ruthenate ion (VIII+) as a corrosion product was verified by in situ reflection spectroscopy and RRDE measurements.38 It was also found that the onset of oxygen evolution coincides with the onset of Ru corrosion. It is suggested that the dissolved RuO4 is partially redeposited on the surface. The build-up of higher valence state Ru sites at the metal–electrolyte interface during the anodic potential sweep is in agreement with mechanisms proposed by other authors.52,56,57 Nevertheless, different views exist on the initial valence of the Ru sites and whether the highest valence state is achieved by electrochemical oxidation44,45 (electrochemical oxide path, Table 2) or by decomposition of adjacent hydroxyl groups42,56 (oxide path, Table 2). There is further dispute over the amount of Ru sites involved in the charging process. Burke et al.52 claimed that the observed charging processes are only due to redox reactions at the hydrated oxide surface, while Galizzioli et al.49,50 measured too large amounts of anodic charges to be simply related to surface reactions. The amount of dissolved RuO4 in the mechanism described in Fig. 6 is directly correlated to the catalyst stability. Parts of the dissolved RuO4, which are not recovered by redeposition get lost for further oxygen evolution. The dissolution rate is expected to depend on the stability of the intermediates being created during oxygen evolution and it has been reported to differ by orders of magnitude among anodically grown and thermally deposited oxide films.37 Indeed, as for the activity parameters, surface morphology and stability of the catalysts also depend highly on the material synthesis process. However, both types of RuO2 films are not stable under prolonged high anodic potentials above 1.4 V (RHE).46,58
The other widely investigated primary electrode material is iridium oxide. Although its catalytic activities for the OER are generally inferior to those of Ru-based electrodes,44,46 its metallic conductivity45 and especially its stability towards high anodic potentials in an acidic environment are its major advantages.58,59 Among the Ir-based catalysts, as in the case of Ru, differences in activity and stability arise depending on the catalyst preparation.60 It is generally accepted that high-temperature oxides with a higher degree of crystallinity are less active but more stable than low-temperature (amorphous) oxides,61 which exhibit a higher activity but lower stability. The fundamental origin of this reverse relationship between stability and activity for these oxides is not yet understood.
Upon potential cycling of an iridium metal electrode, a hydrous oxide layer forms at the metal–electrolyte interface,40,62–64 which grows into the bulk with the number of applied cycles. The growth rate of this oxide film is dependent on scan speed, sweep reverse potentials, temperature, catalyst crystallinity, and morphology as well as the type and concentration of electrolyte.41,62,65,66 In contrast, when the electrode potential is held constant at an anodic potential of 1.6 V (RHE), no film growth was detected.62 The growth of an oxide layer on a sputtered Ir electrode was also confirmed by Kötz and coworkers.40,54 Their X-ray photoelectron spectroscopy (XPS) analysis on compositional surface changes revealed that hydroxide species are exchanged by oxide species during an anodic potential sweep. On the basis of these results, the authors proposed an oxygen evolution mechanism on anodic grown oxide films, as sketched in Fig. 7.40 This mechanism contains several consecutive deprotonating steps starting from an initially hydrous oxide with Ir in a 3+ valence state at potentials below 0.7 V (SCE, ~1 V vs. RHE). Ir is assumed to be in an unstable VI+ intermediate oxidation state (IrO3) prior to dissociation to the tetravalent state at the starting point of the oxygen evolution cycle. The elucidated reaction path is in agreement with the electrochemical oxide path, as described in Table 2, and similar to the mechanism suggested for the oxygen evolution on RuO2.37 The catalytic activity of a metallic Ir electrode increases with the thickness of the hydrous oxide layer.63 Frazer and Woods67 found a higher current density at higher anodic charges, which correlates with the number of potential cycles applied. Hackwood et al.59 compared sputtered with anodically grown IrO2 films and found higher activity on the sputtered films at small overpotentials, while the performance at high overpotentials was similar. Values of Tafel slopes of sputtered and thermally prepared IrO2 have already been presented in a review by Matsumoto and Sato, ranging between 40 and 56 mV dec−1.8
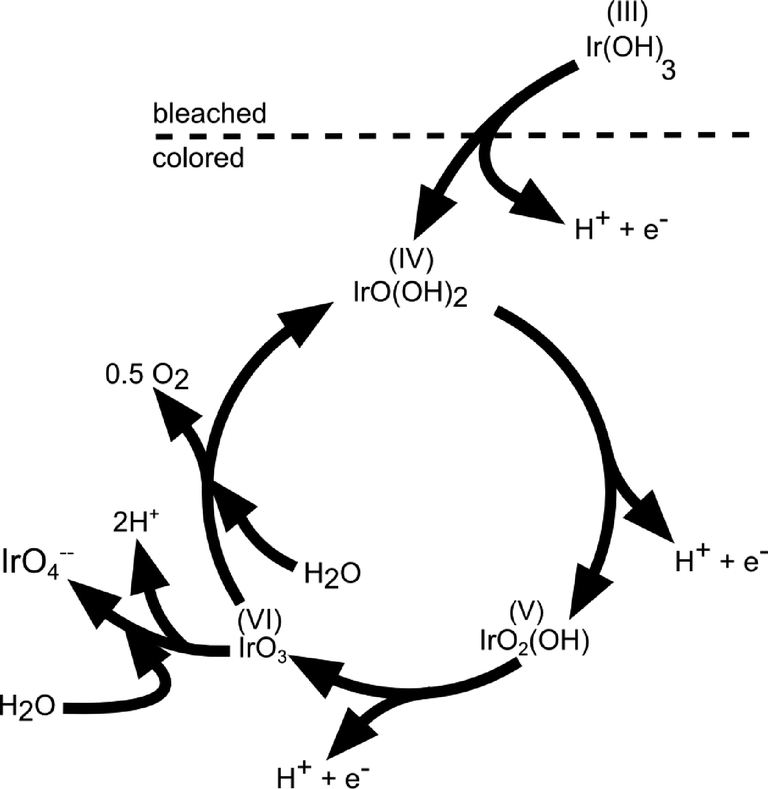 | ||
| Fig. 7 Sketch of the charge storage and oxygen evolution reactions on anodically grown hydrous iridium oxide films. Reproduced with permission of The Electrochemical Society.40 | ||
The stability of Ir-based electrodes has been investigated in several studies, showing that the IrO2 catalysts generally exhibit higher corrosion stability than Ru-based ones.46,58,65,66,68 However, the stability of IrO2 electrodes is affected by the catalyst morphology. Long-term potentiostatic treatment of sputtered IrO2 films59 at a high potential of 1.95 V (RHE) showed no catalyst corrosion, whereas the thickness of anodically grown hydrous IrO2 films decreases under similar conditions above 1.56 V (RHE).59,69 Polarisation at 1.6 V (RHE) has been observed to remove anodically grown oxide layers completely within 24 h.63,69
In the light of the reviewed results, RuO2 represents the best single-metal oxide catalyst known for PEWE applications if only activity parameters are considered. Its major disadvantage is its low stability, which would result in very poor service lifetimes of PEWEs. A little inferior in activity, IrO2 provides a better alternative because of its higher stability. However, low availability of Ir does not allow large-scale production at reasonable costs. To tackle this issue, recent investigations focused on increasing the utilisation per unit mass of the employed noble metal. By scaling down the size of noble metal crystalline particles into a range of a few nanometers, the surface area-to-volume ratio is enhanced. However, only a few systematic investigations on the influence of the catalyst particle size on the OER activity have been carried out so far.51
A different strategy to improve catalyst utilisation is to disperse the noble metal catalysts on high-surface-area non-noble supports. For instance, Wu and Scott70 placed RuO2 on Sb-doped SnO2 nanoparticles and measured a higher activity than on unsupported RuO2. Similar improvements have been achieved with supported IrO2.71 Three-dimensional substrate arrays of conductive tin-doped indium oxide (ITO) showed high specific surface areas of 180 m2 g−1. Employed as a support for IrO2, the catalytic activity was increased compared to unsupported IrO2. The introduction of tin-doped indium phosphates as a replacement for the proton-conducting Nafion® at the three-phase boundary resulted in higher performance of the electrolysis cell.71,72
Another option to achieve a stable and cost-effective catalyst is the partial replacement of noble with base metals by either alloying or direct preparation of mixed oxides. The results of these investigations are discussed in the next sections.
3.2 Bimetal oxide electrocatalysts
The idea of synthesising binary metal oxide catalysts is based on the expectancy that the “advantageous properties of both components” can be combined within one material.68A widely investigated bimetallic system is based on Ru and Ir with the aim of combining the very good catalytic activity of ruthenium oxide and the high electrochemical stability of iridium oxide. RuIrO2 catalysts with 50% nominal Ir content prepared by thermal decomposition on Ti substrates show activities which are between those of pure RuO2 and IrO2 prepared by the same method. However, their stability was not elucidated in this work.46 On sputtered RuxIr1−xO2, Kötz and Stucki68 identified a gradual change of Tafel slope and onset potential with composition x between the individual single-metal oxide values. Small additions of IrO2 to RuO2 reduced the galvanostatic corrosion rate significantly. An optimal trade-off between stability and activity is found for 0.5 < x < 0.8. Ru–Ir alloys were also investigated by the same authors.73 Similar to their results on sputtered mixed oxides, the alloy shows a gradually increasing Tafel slope and onset potential with the increase of the Ir content. Formation of an Ir-enriched oxide surface has been observed at potentials above 0.9 V (SCE, ~1.2 V vs. RHE) only on the alloy.
Furthermore, various other binary oxides have been investigated to either reduce corrosion of RuO2 or decrease the amount of employed Ir while keeping the good catalytic properties of both materials.
In the case of RuO2, the introduction of a second metal cation in the structure aimed on improving the chemical stability of RuO2 without impairing its OER activity. A thermally decomposed metal oxide composition of Ru and Ta with a content of 50 mol% Ta shows a similar Tafel slope with that of RuO2 in the range between 10−2 and 102 μAcm−2 but a lower exchange current density.46 A series of binary Pt–Ru catalysts shows a decrease in the mass current density while increasing the Pt content.74 In contrast, the binary Ru60Co40 catalyst shows an almost double mass current density compared to a pure Ru catalyst.75 The electrochemical stability and activity of nanocrystalline RuxSn1−xO2 powder catalysts as anode catalysts in a PEWE system revealed that addition of up to 40 mol% Sn even improved catalytic activity of RuO2 synthesised by the same method.70 A recent publication has claimed that Co and Ni incorporation into the RuO2 structure can significantly improve the OER activity of the single material by activating the proton donor/acceptor functionality on the RuO2 inactive surface sites.76 As previously discussed, DFT calculations have revealed a linear relationship between the binding energies of the reaction intermediates, resulting in an inevitable OER overpotential of about 0.4 V (see Fig. 8).18 However, Ni- and Co-doped RuO2 catalysts seem to overcome the activity volcano plot limitations, as shown in Fig. 8.76 According to the author's model, the small overpotential for Ni- and Co-doped RuO2 could be achieved by modifying a bi-dimensional active site into a three-dimensional one. Typically, the active sites are confined to the surface metal cations, which form n − 1 oxygen bonds (where n is the number of oxygen bonds for the same cation in the bulk). These reaction sites can be modified by the introduction of a heterovalent cation like Co or Ni able to activate “bridge” sites.76 However, it should be noted that besides an academic interest in overcoming previous theoretical limitations, the corrosion stability of Co- and Ni-containing catalysts should be verified in order to assess possible cation dissolution.
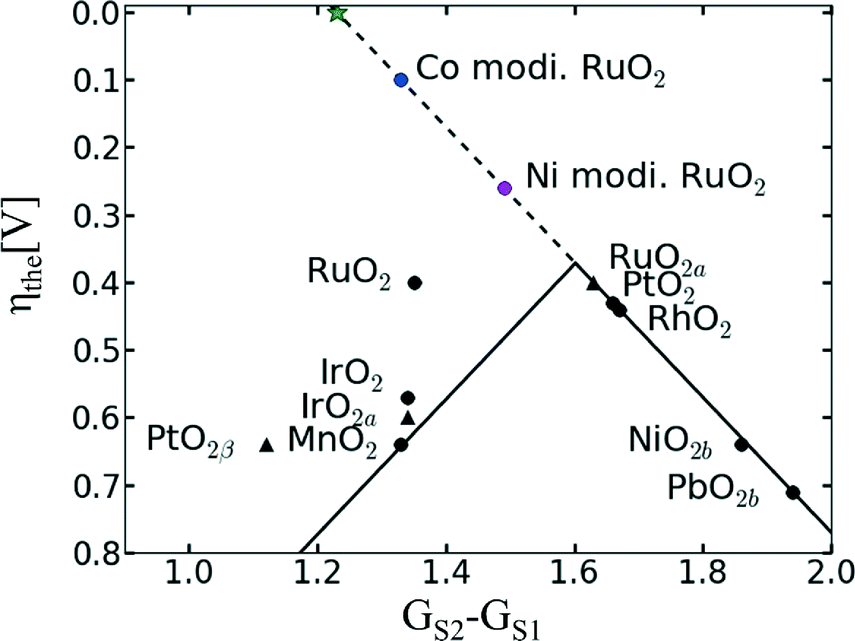 | ||
| Fig. 8 Updated volcano plot of the one shown in Fig. 5 with the overpotentials of Ni- and Co-modified RuO2. The activation of bridge sites by Ni and Co incorporation into RuO2 breaks the scaling relationship between the binding energies of reaction intermediates. The green star marks the position of an ideal catalyst. Reproduced from ref. 76 with permission from the PCCP Owner Societies. | ||
In regard to IrO2, most of the research efforts have been oriented towards enhancing the catalytic activity or to reducing the amount of Ir in the catalysts without affecting the catalytic activity. De Pauli and Trasatti studied the activity and stability of Ir–Sn mixed oxides thermally prepared on Ti substrates.77 The Tafel slope increased as the Ir content decreased. Values similar to that of pure IrO2 have been observed for electrodes with an Ir content above 10 mol%. Additional studies on Sn–Ir oxides have been carried out by Marshall et al.,78 which showed that contents up to 20 mol% of Sn in IrO2 have no significant influence on the activity determined in an aqueous acidic electrolyte. However, further galvanostatic investigations of anodic IrxSn1−xO2 powder catalysts in a PEWE cell setup performed by the same authors showed a performance reduction even upon small additions of Sn.78 A recent study demonstrates the viability of “metal oxide hybrid core–shell” nanoparticle catalysts formed through a dealloying and a selective oxidation procedure.79 Core–shell nanoparticles with a NiIr core supporting a shell of an IrOx catalyst show a 3-fold catalytic activity enhancement compared to that of Ir. The enhancement in mass activity was attributed to (i) an increase of the electrochemical active surface area of the catalyst during the selective dealloying, (ii) electronic and strain effects resulting from the presence of a Ni-containing core, and (iii) the reduction of the Ir content due to the Ni-based core.
The latter studies show that the introduction of a non-noble metal element can help to improve stability and reduce catalyst cost without affecting the catalytic activity to an unreasonable extent. In addition to this strategy, the interfacial area between the catalyst and the electrolyte can be increased by using high-area supports as in the case of single metal catalysts. Binary mixed oxide nanoparticles containing RuO2 and IrO2 dispersed on antimony-doped tin oxides achieved similar performance as thin-film electrodes of the same type but with a reduced loading of noble metals.80
A different, recent approach to enhance catalytic activity of the Ir catalyst was taken by Kadakia et al.81 who synthesised fluorine-doped IrO2 thin films. These films showed a significant increase in activity relative to pure IrO2 with dopant contents around 20 wt%. Furthermore, the onset potential of oxygen evolution was not affected by the amount of fluorine introduced. Theoretical attempts to describe the advancing effect of fluorine indicate a decrease in the difference of Gibbs energy of the rate-determining step82 based on the argument of Man et al.18 and as described in the previous section. Similar ideas have been applied to Sn0.8Ru0.2O2.83 While doping Sn0.8Ru0.2O2 with 10 wt% of fluorine allowed achieving activity similar to that of RuO2, only minor advances were achieved on the subject of stability.
In order to increase stability and to probably enhance synergetic effects, different ternary additives were introduced into the bimetallic catalyst systems. These ternary oxide catalysts are discussed in the next section.
3.3 Ternary and multimetallic oxides
Even though incorporation of Ir into Ru oxides can improve the stability of the latter catalyst, ternary Sn–Ir–Ru oxides show a further improved durability.84 Galvanostatic activity assessment of crystalline IrxRu0.5−xSn0.5O2 powders within a PEWE system revealed that oxides with 0.25 < x < 0.35 show similar performance to pure IrO2 electrodes concomitant with a decrease in overall catalyst costs.80The thermally prepared ternary mixed oxides Ru0.5Ir0.5TaOx and RuIr0.5Ta0.5Ox exhibited lower Tafel slopes and higher exchange current densities than identically synthesised RuOx.46 Higher stability under galvanostatic conditions have been reported for both oxides compared to that of RuOx. Nevertheless, more recent performance tests in PEWE water electrolysis cells employing IrxRuyTazO2 as the anode catalyst showed higher overpotential with increased Ta content within the range of applicable current densities.85
Boodts and Trasatti performed potentiodynamic investigations to elucidate activity parameters of Ru0.3Ti0.7−xSnxO2 for different compositions.86 Enhancement of activity with increasing Sn content was observed while the Tafel slope and reaction order were independent of composition and represented the value of Ru. Differences in stability relating to the Ti/Sn ratio were not explicitly identified. Replacement of Ti with Pt in Ir0.3Ti0.7−xPtxO2 ternary oxides resulted in an increase in the Tafel slope and ohmic layer resistance.87 The activity decreases with higher Pt content.
4 Catalyst materials for alkaline water electrolysers (AWEs)
Alkaline water electrolysers (AWEs) were the first low-temperature fuel cell developed in the 1960s and mainly used for space program applications. Afterwards, mostly due to the liquid electrolyte deterioration in contact with CO2, the interest in these systems has been shelved for many years. However, overcoming the previous limiting drawback of electrolyte carbonization by using a polymeric anion conductive membrane88 has raised again the interest in AFCs in the recent years. As in PEWEs, IrO2 and RuO2 are also excellent catalysts for AWE applications. However, in AWEs, the use of an electrolyte with a high pH value allows for the use of a large variety of metals as electrode material due to their high corrosion stability in this electrochemical environment. Therefore, a wide range of catalyst materials alternative to IrO2 and RuO2 can be investigated. The possible replacement of noble metal catalysts with low-cost and abundant transition metal-based oxides represents one of the major advantages of AWE devices compared to PEWEs since it allows cost reduction facilitating a widespread market penetration. However, it should also be mentioned that AWEs present generally lower voltage efficiencies at high current densities compared to PEWEs. In addition, traditional AWEs are not capable of being operated above 50 bar, so high-pressure operation as in the case of PEWEs is not applicable. This issue, however, may be overcome by alkaline membrane electrolyser systems, which in principle may be operated at p >30 bar.89Regarding OER catalyst materials for AWEs, the most promising transition can be found in the fourth row of the periodic table (the so-called 3d elements) especially Mn, Fe, Co and Ni. Among them, the most accepted catalytic activity trend is reported as Ni > Co > Fe > Mn, as shown in Fig. 9.90
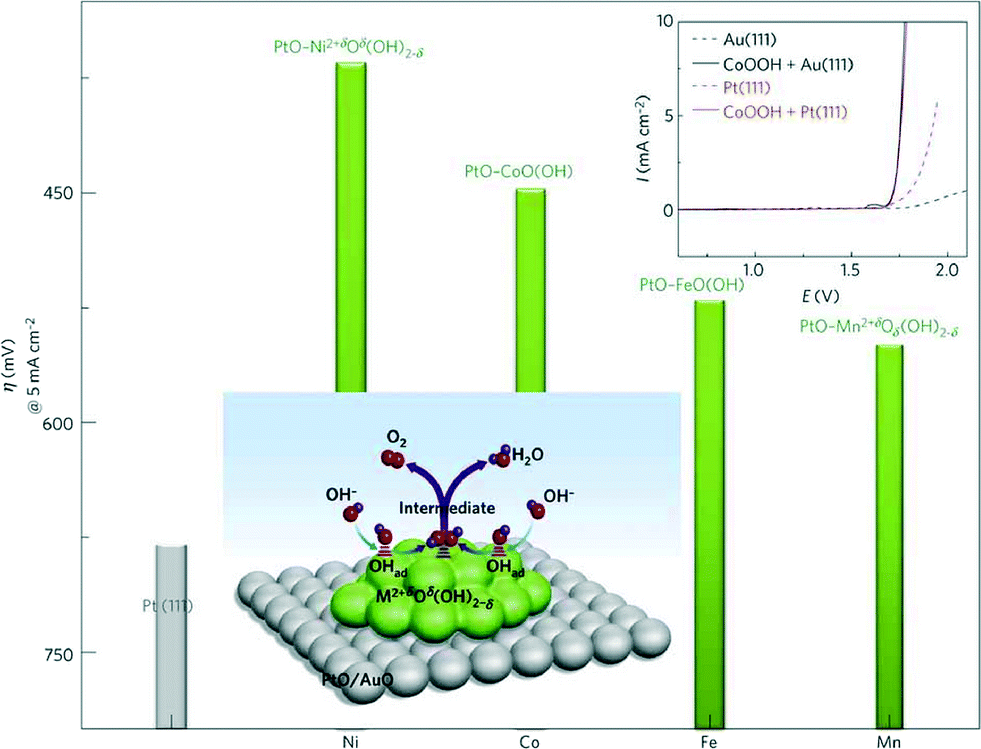 | ||
| Fig. 9 Reactivity trends (overpotential in mV at 5 mA cm−2) for the OER of 3d-metal hydr(oxy)oxide clusters deposited on Pt(111) surfaces. Top inset: a comparison of polarization curves of Pt(111), Au(111), CoOOH on Pt(111) and CoOOH on Au(111). Reproduced with permission from ref. 90. | ||
Besides binary oxides, perovskites have also recently attracted significant attention as potential catalysts for the OER. The topic of this chapter will be focused in reviewing the catalytic activities of transition metal-based catalysts for application in AWE devices. As already mentioned for PEWE catalysts, due to the high oxygen evolution overpotentials, most of the metal catalysts present an oxidised surface layer during operation. Therefore, in the following, all of the oxygen evolution catalysts will be presented as oxides.
As already discussed for IrO2 and RuO2 catalysts in the previous sections, for most of the AWE catalysts materials, the activity also depends on the processing and electrochemical pre-treatments of the catalyst.91,92 In the early 1980s, Iwakura et al.93 already indicated an effect of the substrate material on the OER overpotential of cobalt catalysts if an annealing step at high temperatures (in this case at 350 °C) was part of the synthesis route. The heat treatment led to diffusion of the substrate atoms into the cobalt oxide top layer, influencing its catalytic properties. Yeo et al.94 have recently suggested a further possible interaction between the substrate and the catalyst material. They investigated the catalytic activity of few monolayers of cobalt oxide galvanostatically deposited on different metal substrates, observing a decrease in the TOF as a function of the substrate material in the order Au > Pt > Pd > Cu > Co. In the author's model, the activity towards the OER is enhanced when the catalyst is in a higher oxidation state (here Co(IV) instead of Co(III)) since this might lead to a nucleophilic influence of the catalyst active site on incoming OH. They further suggested that a more electronegative substrate, such as Au, might act as an electron sink facilitating the oxidation of the catalyst layer on top of it. However, the influence of the substrate on the OER activity could be only observed for few monolayers of the deposited catalyst. In a different study, there was no influence observed on the OER activity of several transition metal (Ni, Co, Fe, Mn) oxide clusters using Pt(111) or Au(111) substrates (top inset of Fig. 9).90 The discrepancy between the latter studies might come from the use of different catalyst loadings/microstructures, i.e. only for low catalyst loadings the substrate might have a significant influence on the catalyst OER activity.
It is worth mentioning that besides a possible influence of the substrate on the OER activity, in several studies, the catalyst material has been mixed with carbon95–97 or supported on nickel.98,99 Carbon can be thermodynamically oxidised at a potential as low as 0.207 V (RHE).100 Due to kinetic hindrances, carbon undergoes strong corrosion above 1.1 V (RHE). Therefore, in the typical operating potentials for the OER, it is expected that carbon will be strongly corroded during operation. As a consequence, a high anodic current not only due to OER would be observed during experimental measurements. In addition to carbon, the use of a Ni substrate should also be avoided since Ni has high activity towards the OER, as will be described in detail below. Some studies have also shown that iron contamination caused by impurities in the KOH electrolyte can have an influence on the experimentally measured OER activity.101,102 Particularly, with regard to the described high OER activity of iron-doped nickel, the influence of iron on the reported catalytic performance cannot be ruled out. Other electrochemical OER measurements were carried out in a nitrogen-saturated electrolyte, which leads to a shift of the OER equilibrium potential during initial oxygen evolution. Last but not least, the methods for real surface area determination of the catalyst vary a lot between different studies. Therefore, a comparison of charge densities is proved to be difficult.
4.1 Nickel-based oxides
Nickel is one of the most promising transition metal catalysts for the OER in alkaline media. Metallic nickel immersed in an aqueous solution at open circuit potential instantaneously forms a layer of Ni(OH)2 on top of the air-formed NiO layer. The Ni hydroxide layer grows upon continuous potential cycling across the Ni(OH)2/NiOOH redox peak.103 Furthermore, the studies of Medway et al.104 on single crystal Ni(111) indicate that both the first NiO and the topmost Ni(OH)2 layers grow during potential cycling as illustrated in the sketch in Fig. 10 (upper panel). Upon the growth of the Ni(OH)2 layer, a significant increase in the OER activity is generally observed for a hydrous nickel oxide film, as shown in Fig. 10 (lower panel).105 The shift to more anodic potentials for the anodic Ni(II/III) peak105 in Fig. 10 (lower panel) suggests the formation of a more thermodynamically stable Ni(OH)2 phase and a less reversible behaviour of the surface redox couple. Fundamental understanding of the Ni(OH)2/NiOOH redox couple was provided by Bode et al.106–108 who suggested the existence of two limiting discharged phases, the α-Ni(OH)2 and the β-Ni(OH)2 phase, and two limiting charged phases, γ-NiOOH and β-NiOOH. The α-Ni(OH)2 phase (oxidation state 2.0–2.2) is significantly hydrated, poorly crystalline, and upon increasing the electrode potential can be oxidised to γ-NiOOH (oxidation state 3.5–3.67). The β-Ni(OH)2 phase (oxidation state 2.0–2.2) is largely anhydrous and crystalline, and it can be oxidised to β-NiOOH (oxidation state 2.7–3.0).103,104,109 Several authors110,111 proposed that an initially formed α-Ni(OH)2 phase could gradually change into a more crystalline β-Ni(OH)2 phase due to potential cycling in a strong base. It has been also suggested that the β-Ni(OH)2 phase is the most active for the OER since its oxidation to the β-NiOOH phase represents the optimal condition for the OER to occur.109,112,113 Besides the creation of an optimal Ni(OH)2 layer upon potential cycling, the latter can also increase the surface roughness and the amount of the electrochemically active surface area, thus leading to a higher oxygen evolution activity.114 Since the thickness of the Ni(OH)2 layer is time-dependent104,115 and it can present different physical and morphological properties, the activity of nickel-based electrodes depends strongly on their history (synthesis and potential cycling).92 Indeed, a huge spectrum of Tafel slopes, varying from about 40 to 130 mV dec−1, can be found in the literature.92,101,103,105,116–119 Several studies indicate that independent on the material processing, two regions for the Tafel slope can be identified with a change in the Tafel slope value at about 1.5 V (RHE).92,101,103,116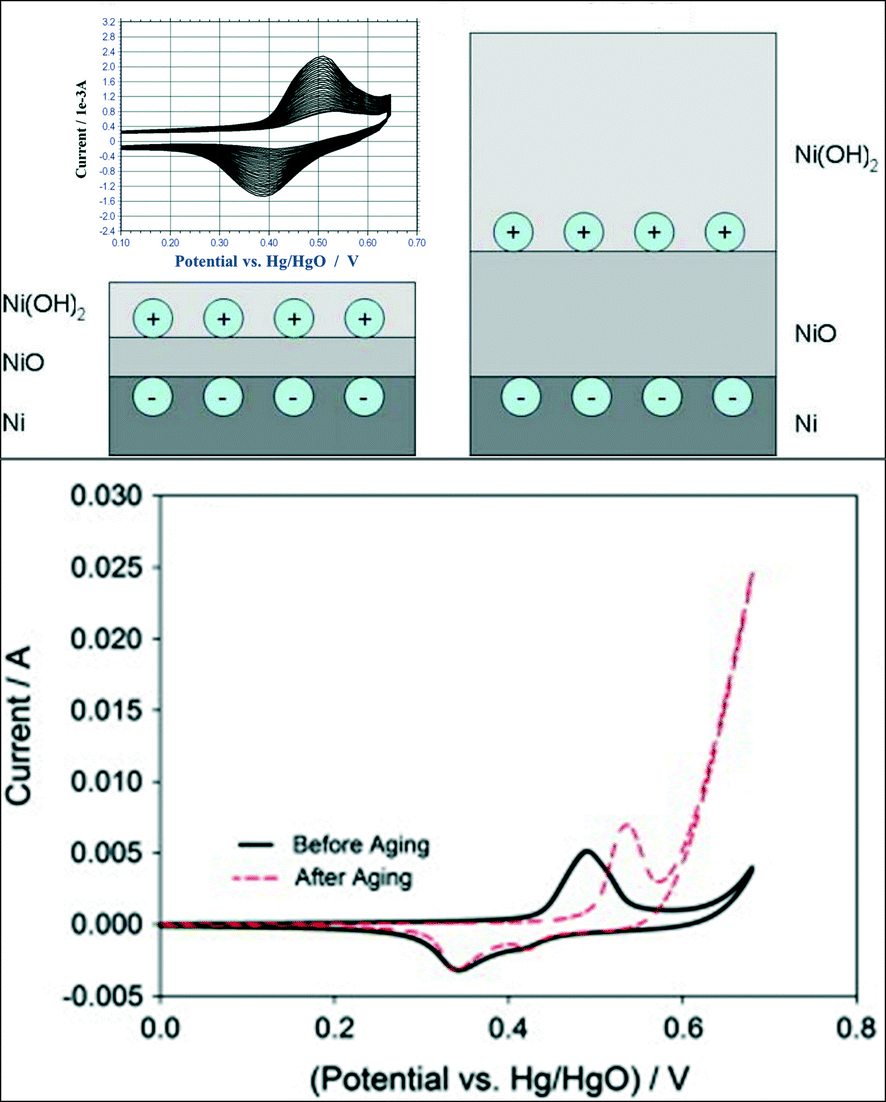 | ||
| Fig. 10 The upper panel shows a schematic diagram of the growth of the oxidic layers by cycling single crystals of Ni(111) across the Ni(OH)2/NiOOH voltammetric peaks. Reproduced with permission from ref. 104. The Ni hydroxide/oxyhydroxide voltammetric redox couple is also shown in the inset. Reproduced with permission of The Electrochemical Society.103 The lower panel shows the increase of the OER activity of a hydrous nickel oxide film after potential cycling across the Ni(OH)2/NiOOH redox peaks. Reproduced with permission from ref. 105. | ||
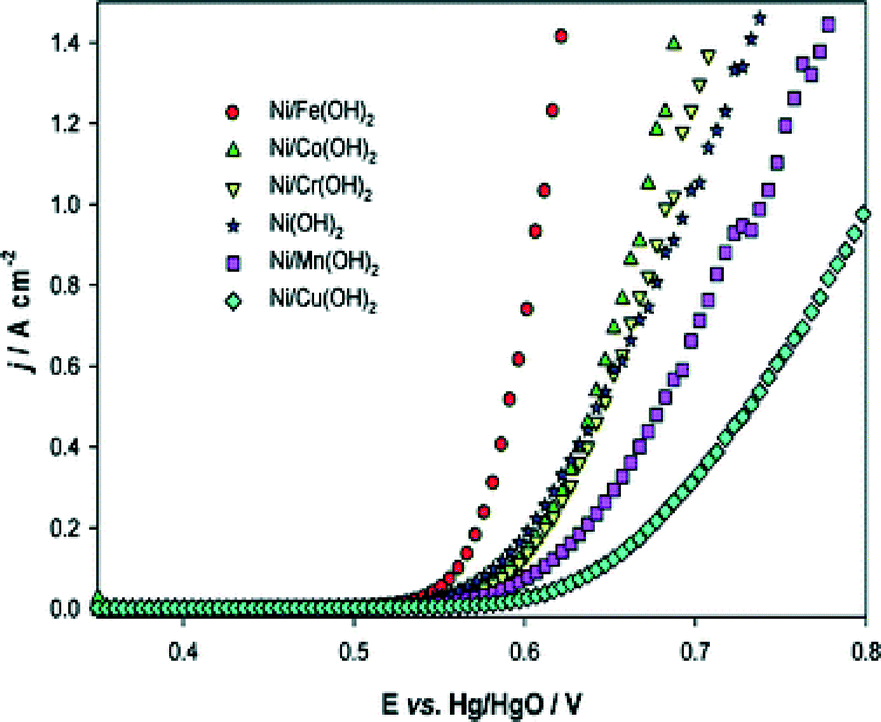
In order to improve the catalytic performance of nickel electrodes, numerous studies dealt with doped nickel, using transition metals as dopants in a wide range of compositions. As already mentioned, the electrocatalytic activities of nickel and its alloys depend on their history, e.g. the synthesis route,119 hence influences of the doping concentrations can only be described among samples synthesised identically. In addition, it should be noted that the determined surface area depends strongly on the measuring technique. It is therefore difficult to compare absolute values of surface areas and current densities respectively measured with different techniques. Li et al.120 have investigated a wide range of doped nickel-based catalysts prepared by electrodeposition of metallic salts on nickel microelectrodes. In Fig. 11, the polarisation curves of nickel oxide mixed with various first-row transition metals are shown. According to the authors, iron is the most promising alloy element for enhanced catalytic activity of nickel-based OER catalysts. This conclusion matches with the results of several other studies. Corrigan101 and Merrill et al.121 reported Tafel slopes of NiFe oxides as little as 17 and 14.8 mV dec−1, respectively. Other studies101,118 showed that already around one percent of iron doping has strong influence on the catalytic activity of electrodeposited and sputtered nickel oxide films. Particularly, for about 5 mol% of iron, a decrease of 50–60 mV dec−1 and 140–160 mV for the Tafel slope and the OER overpotential (taken at 8 mA cm−2) was observed, respectively.101,118 The latter results demonstrated that small amounts of iron impurities can have a significant influence on the activity of nickel-based catalysts. Therefore, for a true understanding of the nickel electrocatalytic activity, the use of high-purity electrolytes and a clean environment is mandatory. Additionally, given the high sensitivity of the material to metal impurities, the surface chemical composition after the electrochemical measurements should be determined. Consideration of both of the mentioned points, however, are strongly lacking in the studies provided in the literature so far.
 | ||
| Fig. 11 Steady-state polarisation curves recorded for various coatings on a Ni microdisc electrode in 1 M NaOH at 80 °C. Potential sweep rate: 1 mV s−1. Reproduced from ref. 120 with permission from the PCCP Owner Societies. | ||
The best doping concentration of Fe is indicated quite controversial in the literature. While some studies report the best OER activity at a doping concentration of about 10 mol% Fe,101,120,122 other authors claimed that the lowest Tafel slope117 or the smaller overpotential123 can be obtained by doping Ni with 40 mol% of Fe. Furthermore, the mechanism leading to superior OER activity for Ni/Fe catalysts is still rather unclear. Smith et al.117 indicated that iron as an alloying element stabilises the higher oxidation states of nickel, leading to a superior OER activity. On the contrary, Louie and Bell123 claimed that Fe incorporation into Ni increases the potential at which the Ni(OH)2/NiOOH redox reaction occurs and decreases the average oxidation state of Ni in NiOOH.
Besides the introduction of a second transition metal into the Ni structure, the catalytic activity can be also improved by using tailored morphologies. A simple way of increasing the mass specific activity is by increasing the catalytic active surface area of a catalyst. For example, Xu et al.124 synthesised NiOOH in a 3D flower-like morphology with a large surface area, as shown in Fig. 12.
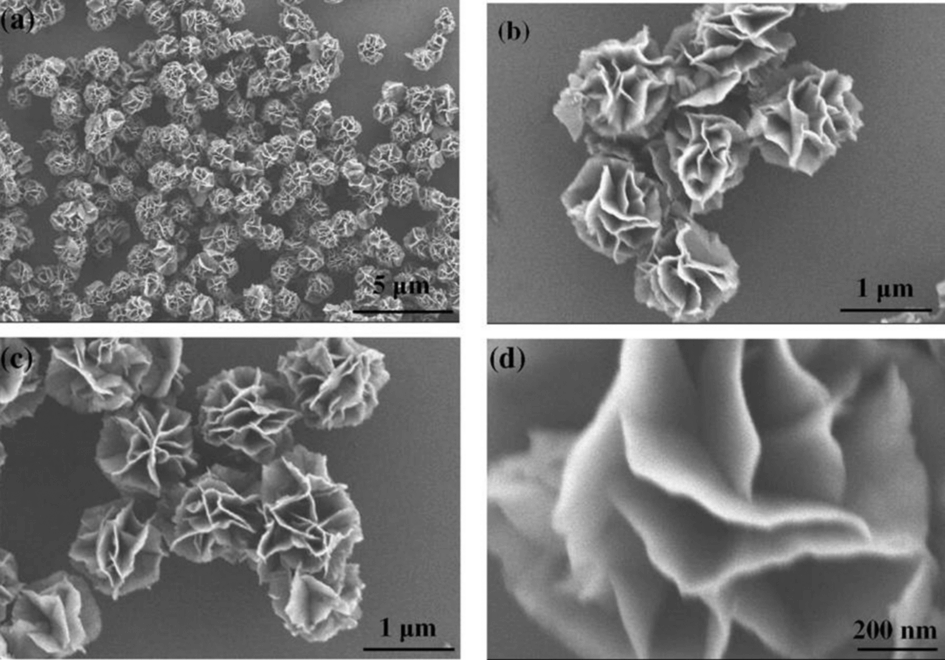 | ||
| Fig. 12 Field-emission scanning electron microscopy images of α-Ni(OH)2 with a 3D flower-like morphology at different magnifications. Reproduced with permission from ref. 124. | ||
As already discussed, the wettability of the electrode plays a decisive role for the electrolyser efficiency. At high currents, gas bubbles formed at the electrodes are responsible for high ohmic losses. Recently, Ahn et al.125 showed by a simple experiment that the detachment of gas bubbles and consequently the efficiency of an electrolyser can be significantly enhanced by increasing the surface roughness of the nickel anode.
4.2 Cobalt-based oxides
Another promising transition metal catalyst is cobalt. Smith et al.117 observed an overpotential of 0.26 V at 0.5 mA cm−2 for the OER on undoped amorphous cobalt. Like nickel, cobalt is oxidised when inserted in an aqueous electrolyte. Under an anodic potential, cobalt undergoes several oxidation steps before oxygen evolution takes place. During this process, a layered structure of oxidic cobalt species is formed when Co(II) is gradually oxidised to Co(III).91,94 Some authors even reported the formation of Co(IV) species on the outer surface of the electrode.91,126,127 The catalytic activity of cobalt depends on the oxide composition and on the electrochemical pre-treatment of the metal electrode.91 The OER generally shows two overpotential regions9,91,128–130 with different Tafel slopes with the most reported slope at low overpotentials 42 mV dec−1.91,102,117,128,129,131,132As it was already indicated in the early 1980s by Iwakura et al.,93 the catalytic activity of cobalt can be enhanced by forming solid solutions with other transition metals. Recently, Bajdich et al.133 calculated the overpotentials for the OER on two different crystallographic surfaces of CoOOH (Fig. 13). They found that the thermodynamically stable crystallographic surfaces of CoOOH under OER conditions depend on the applied potential and pH value, according to:
| Ut = 1.9 V − 0.059 V × pH | (8) |
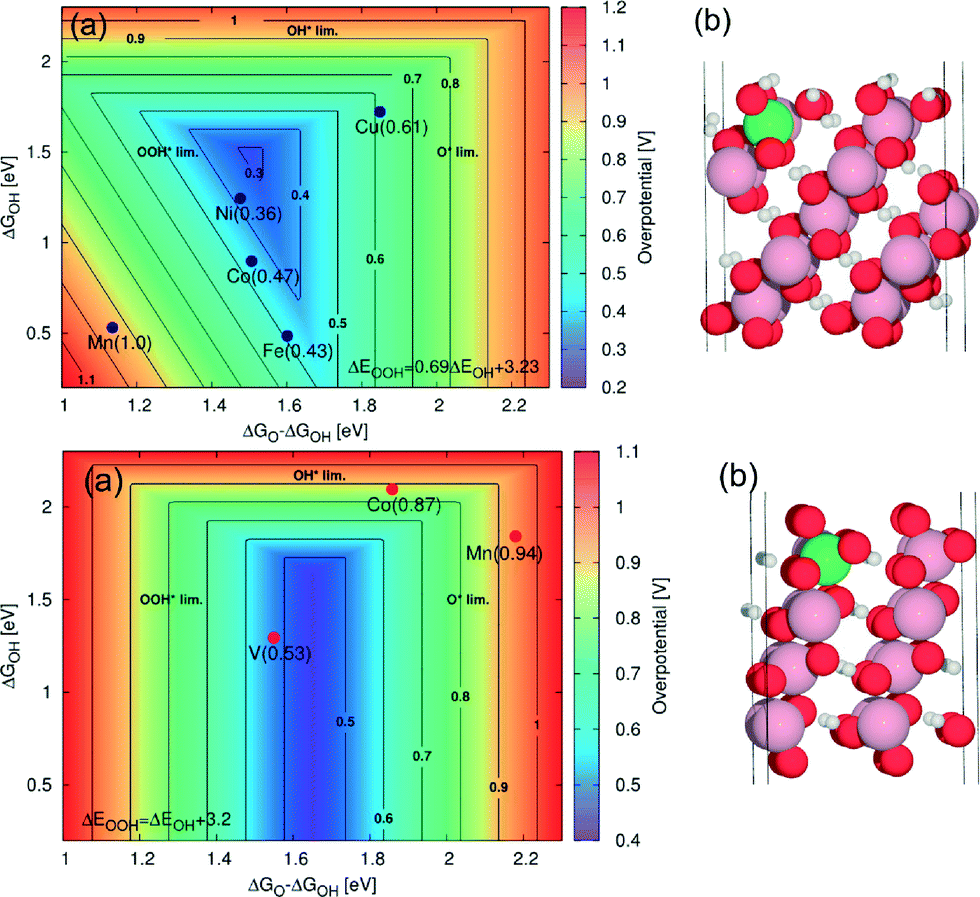 | ||
Fig. 13 (a) 2D map of theoretical overpotentials (η) for the doped (10![[1 with combining macron]](https://www.rsc.org/images/entities/char_0031_0304.gif) 4) surface (upper panel) and for the (012) surface (lower panel) of β-CoOOH as function of ΔGO – ΔGOH and ΔGOH. The individual values of η are indicated in brackets. The contour map is constructed assuming ΔEOOH = EOH + 3.2 eV. For the (104) surface (upper panel), improvement in activity relative to the undoped surface is obtained for Ni with η = 0.36 V and for Fe with η = 0.43 V. For the (012) surface (lower panel), the improvement relative to the undoped surface is obtained for vanadium with η = 0.53 V. Only the dopants with η < 1 V are shown. (b) The corresponding atomic system with a green sphere indicating the position of the dopant. Reproduced with permission from ref. 133. 4) surface (upper panel) and for the (012) surface (lower panel) of β-CoOOH as function of ΔGO – ΔGOH and ΔGOH. The individual values of η are indicated in brackets. The contour map is constructed assuming ΔEOOH = EOH + 3.2 eV. For the (104) surface (upper panel), improvement in activity relative to the undoped surface is obtained for Ni with η = 0.36 V and for Fe with η = 0.43 V. For the (012) surface (lower panel), the improvement relative to the undoped surface is obtained for vanadium with η = 0.53 V. Only the dopants with η < 1 V are shown. (b) The corresponding atomic system with a green sphere indicating the position of the dopant. Reproduced with permission from ref. 133. | ||
Particularly for alkaline media (pH ≈ 13), the transition potential Ut is about 1.13 V. Below this potential, the Co(1014) surface is the most stable (Fig. 13, upper panel), while above 1.13 V, the Co(0112) surface is predominant (Fig. 13, lower panel). From the DFT calculations, the most promising dopants appear to be Ni and V for the Co(1014) surface and the Co(0112) surface, respectively. Particularly, for long-term applications at high anodic potentials (where the Co(0112) surface is predominant), vanadium could represent a quite promising dopant for cobalt oxide.
Experimental studies on the influence of nickel as a doping element are at present quite contradictory. On one hand, Trotochaud et al.102 compared the catalytic activity of nickel, cobalt and their alloys and reported an enhanced electrocatalytic activity of the alloy catalysts. They observed a decrease in the Tafel slope (from 42 to 29 mV dec−1) and in the overpotential (from 381 to 300 mV at 1 mA cm−2) with an increasing fraction of nickel NixCo1−xOy (0 ≤ x ≤ 1). However, Fe contamination was observed by the authors, potentially affecting their results. On the other hand, Smith et al.117 reported a decreased catalytic activity of cobalt if alloyed with nickel; alloying Co with 59% nickel increased the Tafel slope from 42 to 73 mV dec−1 while the overpotential was almost constant.
Numerous research studies deal with copper-doped cobalt oxides. According to the findings of the DFT calculations of Bajdich et al.133 shown in Fig. 13, the catalytic OER activity of cobalt oxide would decrease with increasing amount of copper. Contrary to those findings, other studies have reported an increase in activity due to copper doping, indicating different optimal compositions (CuCo2O4,134 Cu0.7Co2.3O4,135 and Cu0.3Co2.7O4,99). As mentioned in the introduction, besides the catalytic activity, the electrical resistivity and especially the long-term stability are of high interest for applications. Jia et al.136 observed a large decrease in the electrical resistivity for Cu-doped cobalt oxide, reaching the minimum for the Cu0.3Co2.7O4 composition. Contradictory results to the trend of the long-term stability of CuxCo3−xO4 were observed; while Jia et al.136 and Wu et al.135 reported an increased corrosion stability of Cu0.3Co2.7O4 compared to undoped Co3O4, Berenguer et al.137 reported a higher susceptibility for corrosion with increasing copper content. However, different protocols were used to test the stability of the catalyst materials; while Jia and coworkers136 employed the electrode periodically as both anode and cathode, Berenguer and coworkers137 applied anodic potentials to achieve a constant current density of 100 mA cm−2.
With the aim of taking advantage of both nickel and copper as alloy elements, Wen et al.138 systematically investigated ternary Co–Ni–Cu alloys, showing that the highest current densities at an overpotential of 700 mV can be achieved with ternary alloys of 50–63% Co, 30–40% Ni and 5–15% Cu (Fig. 14). The catalytic activity of ternary cobalt alloys different from that of Co–Ni–Cu was also investigated. For example, Rosalbino et al.139 prepared ternary Ni60Co30M10 (M = Cr, Mn, Co, Cu) alloys and compared their catalytic OER activities. They observed decreased Tafel slopes and overpotentials in the order of enhanced activity: Ni60Co30Cr10 > Ni60Co30Mn10 > Ni60Co30Cu10 > Ni60Co40. Lee et al.140 investigated ternary Co–Cu–Zn oxides. The maximum activities they found were 70 to 85% Co, 10 to 20% Cu, and 2 to 10% Zn. Besides nickel and copper, various other transition metals were investigated as additives for cobalt oxide catalysts. However, to the best of our knowledge, no significant improvement in the catalytic activity has been reported. For example, Rios et al.141 systematically investigated MnxCo(3−x)O4 (0 ≤ x ≤ 1) spinel films and observed a slightly decreasing activity with increasing content of manganese as the Tafel slope almost did not change, while the current density decreased monotonically at a fixed potential.
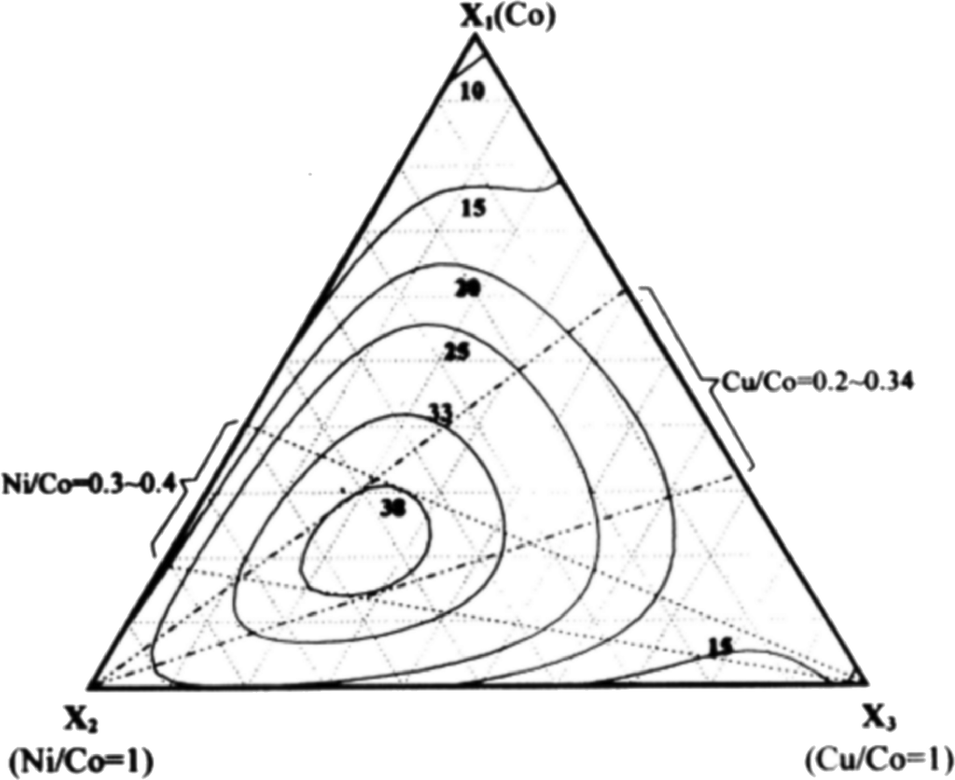 | ||
| Fig. 14 A plot of oxygen evolution activity vs. coating solution composition for Co–Ni–Cu ternary electrodes. The numbers associated with the contour lines represent the current density (mA cm−2) results. Reproduced with permission from ref. 138 | ||
Some studies also deal with carbon-supported Co-based catalysts, e.g. NiCo2O4.97 Even though an increase in performance was observed when NiCo2O4 was mixed with carbon, we cannot rule out the fact that the increase in activity is simply due to additional carbon oxidation currents. Indeed, as mentioned above, carbon is not stable at high anodic potentials and a high corrosion rate is expected.
4.3 Other transition metal-based oxides
As already mentioned, other 3d elements apart frrom Ni and Co can show a reasonable catalytic activity towards the OER. Several studies on transition metals such as Fe- or Mn-based oxides have been published so far. Unfortunately, most of the published work is based on data obtained using a nickel support or by adding carbon species to the catalyst. As already mentioned, nickel shows high catalytic activity and carbon oxidises very fast at high potentials; therefore, their use as supports makes the evaluation of the catalytic activity unreliable.In addition to the application in “dark” electrolysis, manganates and calcium manganates are widely investigated as anode materials and as photocatalysts for water splitting.148,149
4.4 Perovskites
The basic perovskite structure can be represented as ABO3, where A is the larger cation, such as a lanthanide or an alkaline earth element, and B is the smaller cation, generally a transition metal surrounded by 6 oxygen atoms forming a BO6 octahedral (Fig. 15). The ABO3 structure can accommodate cation substitution in a wide range by partial replacement of both the A and the B cation with another element giving (AxA`1−x)(ByB`1−y)O3 compositions. Such substitution leads to modification of the perovskite band structure, which in turn can modify the electrical, optical and magnetic properties of the oxides and thus may also have a significant effect on their catalytic activities. In most cases, the outer orbitals of the A ions do not play an important role in determining the perovskite electronic properties, which can be regarded as arising solely from the BO6 octahedral. This is not to say that the A ion is not important. The electrostatic potential of the A ion influences the energy of the conduction band, and its size determines a possible deviation of the crystal structure from the ideal cubic form. When the B cation is a transition metal, the outer s and p orbitals form a filled valence band and an empty conduction band separated by a large energy gap; thus, they contribute only little to the material physical properties. The electrons of interest for the conduction properties are the d-band electrons (d-band perovskites).150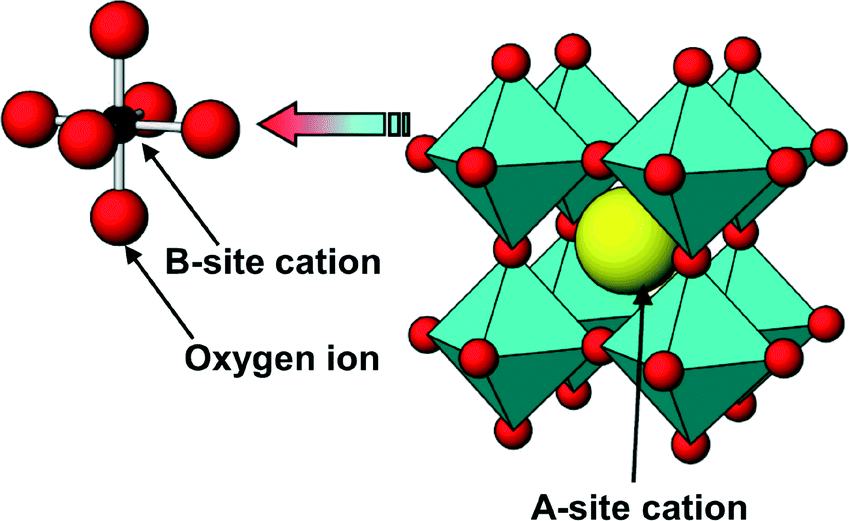 | ||
| Fig. 15 Sketch of a basic ABO3 perovskite oxide structure. | ||
The first literature correlating the perovskite band structure and its catalytic activity toward oxygen electrocatalysis goes back to the end of the 1970s. Matsumoto et al.151 initially proposed that the main parameters governing the OER at the surface of d-band perovskites are (i) the formation of a σ* band in the lattice, which should enhance the electron transfer between the OH− and the electrode surface, and (ii) the oxidation state of the transition metal cation (B site). Furthermore, Matsumoto et al.151 suggested that the OER proceeds on the surface of perovskite oxides following the so-called Krasil'shchikov path reported in Table 2. According to the authors, the rate of the 1st and 3rd reaction steps (both comprising an electron transfer) would be enhanced for those perovskites showing an extended σ* band. In contrast, the chemical reaction step (2nd step) would be favoured in the case of perovskites with the B site transition metal cation in a high oxidation state. The assumptions of the authors were partially supported by the study of La1−xSrxFe1−yCoyO3 perovskite series. Particularly, they found that the oxygen evolution overpotential at a defined current density and the Tafel slope decreased with increasing x and y in the perovskite series, with the exception of SrCoO3 and SrFeO3 compounds. The calcined SrCoO3 did not show a perovskite structure and exhibited high resistivity, which could explain the deviation from the abovementioned trend of oxygen evolution activity vs. the increase in x and y in La1−xSrxFe1−yCoyO3.
Theoretically, SrCoO3 should possess the largest σ* band and also a large amount of B-site cations in IV+ compared to that in III+ or II+ oxidation state; these would represent the optimal properties of a superior perovskite oxygen evolution catalyst according to the theory of Matsumoto et al.151 Interestingly, the DFT calculations performed by Man et al.18 showed a volcano relation between the catalyst overpotential and the intermediate adsorption energy with SrCoO3 sitting on top of the volcano plot close to LaNiO3 and SrNiO3 (Fig. 5).
It was reported by Otagawa and Bockris152 that LaNiO3 also displays excellent oxygen evolution activity with a Tafel slope of about 40 mV s−1. The authors153 suggested that the high activity of LaNiO3 was due to the weak bonding strength of OH on the perovskite surface. In a following paper,15 Bockris and Otagawa further stressed the importance of the bonding strength of surface-oxygenated intermediates on the oxygen evolution activity of perovskite oxides. They showed that for several La1−xAxBO3 perovskites (Fig. 16), the oxygen evolution activity increased with decreasing B–OH bond strength from vanadium to nickel (B-site element) and with the increase in the number of d electrons of the transition metal cations (considered in the III+ oxidation state). Besides experimental data, these authors15 also proposed (Fig. 16) a volcano plot of activity vs. intermediate bonding strength similar to that predicted by DFT calculations in ref. 18 and shown in Fig. 5. According to Bockris and Otagawa,15 the linear scaling of the oxygen evolution activity either with the intermediate bond strength or with the number of d-electrons occurs because these two material properties are interconnected. An important feature of the perovskite surface is that the BO6 symmetry is broken, and thus, the electrostatic crystalline field results affected, leading to further splitting of the eg and t2g bands. Furthermore, when the oxide surface is in contact with an aqueous solution, such as KOH, most of the oxides have an affinity for adsorption of OH ions. The surface states have wave functions which can hybridise with the orbitals of the reacting molecules to produce a surface complex. Bockris and Otagawa,15 taking into account a possible surface electronic configuration, proposed that the electrons from the d orbitals of the surface transition metals will occupy the antibonding orbitals of B–OH molecular orbitals. Thus, the authors suggested that the B–OH bond strength would decrease as the number of d electrons increases. It was also found that perovkites showing lower stability displayed higher activity.15 The author used these results to remark that perovskites able to easily lose lattice oxygens and/or easily form oxygen vacancies should display the lower bond strength with oxygenated species and, thus, the highest activity. Moreover, Trasatti154 has pointed out that for different oxide materials, a correlation between the degree of non-stoichiometry and the O2 electrocatalytic activity exists. Bockris and Otagawa15 also tried to correlate the perovskite activity with other bulk properties typical for semiconducting materials, such as flat band potential, carrier density, and Hall mobility; however, a univocal correlation was not found. The reaction mechanism proposed by Bockris and Otagawa for the OER on the perovskite surface is also reported in Table 2 (Bockris path).15,153 Basically, the water molecule originally adsorbed on a reaction site S can be replaced by an OH− by a proton transfer. Hence, an electron transfer may occur. For a wide range of perovskites, the authors indicated the electrochemical desorption of OH as the RDS. In the case of LaNiO3, they proposed that given the high oxygen vacancy concentration in the perovskite lattice (i.e. lattice oxygen loosely bound), the oxygen evolution may take place with direct participation of the surface lattice oxygens in the form of OH− ions.153
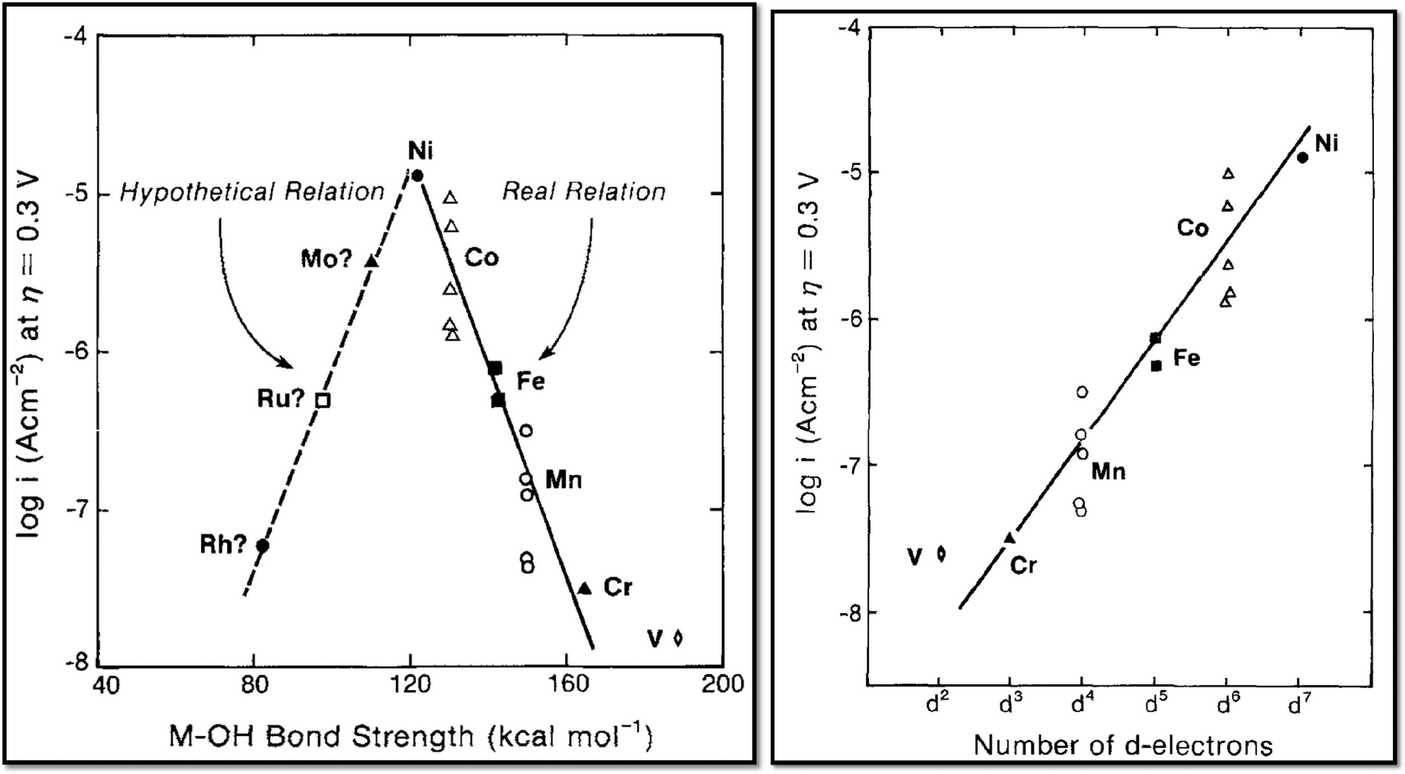 | ||
| Fig. 16 A hypothetical volcano plot for the oxygen evolution activity vs. the M–OH bond strength of LaMO3 perovskites (M = Rh, Ru, Mo, Ni, Co, Fe, Mn, Cr, and V) (left). Plot of activity vs. number of d-electrons for different B-site transition metal ions in LaMO3 perovskites (M = Ni, Co, Fe, Mn, Cr, and V) (right). Reproduced with permission of The Electrochemical Society.15 | ||
After a wide time gap, a growing number of publications on perovskite oxides for application as oxygen evolution catalysts have appeared in the last couples of years. To design superior catalyst descriptors, Suntivich et al.155 also applied an approach based on orbital principles; they reported a volcano plot showing correlation between the oxygen evolution activity of different perovskites with the eg filling. They suggested that not the whole d-band occupation influences the binding energy of surface-oxygenated species but only the eg occupancy, which can therefore be used as a descriptor for the oxygen evolution activity. They identified the Ba0.5Sr0.5Co0.8Fe0.2O3−δ (BSCF) perovskite as the most promising oxygen evolution catalyst. BSCF sits on top of the volcano plot of activity vs. eg filling,155 different from the volcano plot reported in Fig. 5 for perovskites where SrCoO3 and LaNiO3 are identified as the best oxygen evolution catalysts (however, different perovskite compositions were considered in the two studies).
Besides the earlier investigation on LaNiO3,152 more recently Hardin et al.156 showed a high mass activity for composite electrodes made of LaNiO3 nanoparticles and N-doped carbon nanotubes, suggesting the direct participation of lattice hydroxide species in the OER similar to that proposed in ref. 152.
While in the latter paper,156 it is clearly specified that carbon addition allows increasing the measured anodic current, most of the recent papers on perovskite catalysts include carbon in the electrode composition without checking its influence on the oxygen evolution activity.155–159 However, it has been recently shown for the BSCF catalyst that carbon addition results in an increase of anodic current for the composite electrode compared to a single BSCF catalyst.160 Carbon suffers from strong corrosion at the typical OER potentials, resulting in a high anodic corrosion current not only due to OER.160,161 Therefore, as already mentioned it must be avoided as a conductive agent for a correct evaluation of the oxygen evolution activity.
So far, only a few fundamental studies using perovskite thin films with controlled surface termination have been reported. Raabe et al.162 performed an in situ electrochemical electron microscopy study on Pr1−xCaxMnO3 perovskites, revealing the essential role of the oxygen vacancy formation in the OER. Furthermore, the highest oxygen evolution activity was found for 0.3 ≤ x ≤ 0.5 when the perovskite shows a p-type semiconducting behaviour.162 An additional study on thin film model electrodes has been carried out by Komo et al.163 on La0.8Sr0.2CoO3. The authors show that the (110)-oriented film has the highest activity and also the highest formation of oxygen defects (lattice expansion) compared to the (111)- and (100)-oriented films.
Theoretical calculations have also recently brought a deeper understanding of the relationship between perovskite oxygen evolution activity and surface/band structure properties. The DFT calculations performed by Man et al.18 and already discussed in the previous section (2.2) have shown a volcano plot displaying a correlation between oxygen evolution activity and surface intermediate binding energy. Again by DFT calculations, Vojvodic and Nørskov16 demonstrated a correlation between the total number of occupied states (eg and t2g states) and the adsorption energy of oxygen (Fig. 17).
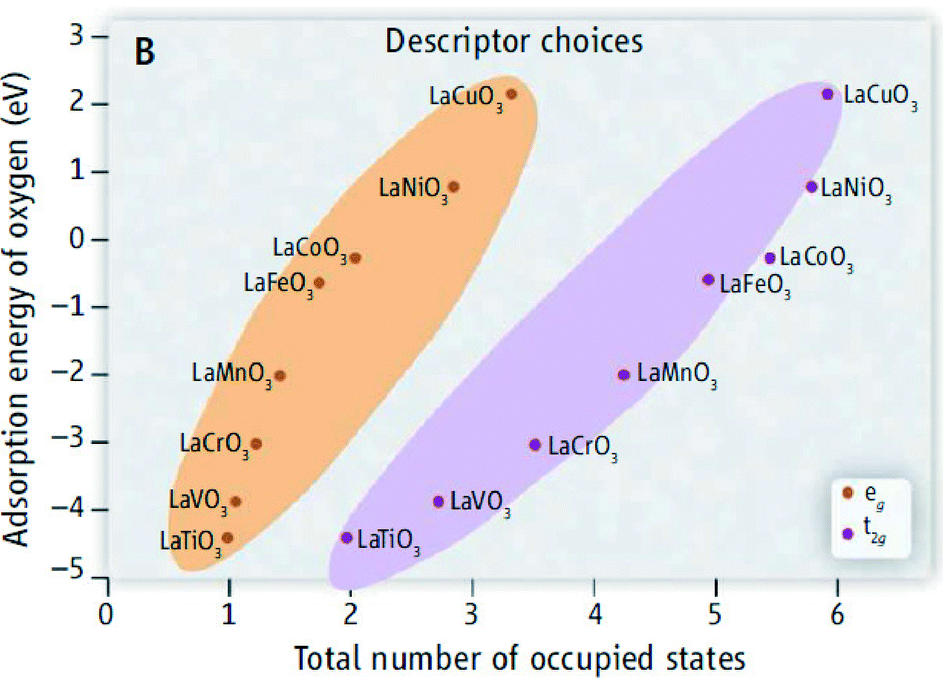 | ||
| Fig. 17 DFT calculations showing a correlation between the adsorption energy of oxygen species and the total number of occupied states. These results indicate that either the eg or the t2g symmetry occupation shows a correlation with the oxygen adsorption energy. Reproduced with permission from ref. 16. | ||
The authors suggested that while some reaction steps (such as formation of OH* and O*) can occur at a high rate when O atoms interact more strongly with the surface, other reaction steps become faster for low adsorption energy of oxygenated species. In agreement with the volcano plot of Man et al.,18 the best catalyst would be again the one showing the optimal balance in the surface-oxygen interaction energies (Sabatier principle). Furthermore, by DFT calculation, Vojvodic and Nørskov16 indicated that the oxygen adsorption energies are not only correlated to the occupancy of the eg but also of the t2g energy levels. Particularly, only the reactive states near the Fermi level will interact with the adsorbate O 2p levels, influencing the oxygen adsorption energy and hence the oxygen evolution activity. On the basis of this statement, it has been recently shown159 that among the family of double perovskites the composition PrBaCo2O5+d with the O p-band centre very close to the Fermi level can display very high oxygen evolution activity.
Conclusion and outlook
As a consequence of the future fossil fuel depletion and the energy policies of several countries to abandon nuclear energy (such as Germany, Australia, Sweden, Belgium, Switzerland, and Italy), the upcoming electric power supply will rely to a larger extent than today on fluctuating primary solar and wind energy. Hydrogen as an energy vector will play a significant role due to its long-term storage capability and flexibility since it can serve both for automotive and for stationary applications, i.e. electromobility and power-to-gas conversion, respectively. Furthermore, H2 not only can be directly converted into electrical energy by a fuel cell device but can also be used to produce syngas or synthetic natural gas.To face a hydrogen-based energy economy, electrolyser development will play an essential role since these devices can produce pressurized H2 with relatively high efficiency. The electrolyser technology is indeed already available in the market, as demonstrated by, e.g., Proton OnSite with a PEWE stack operating at 1.6 A cm−2, 50 °C, and 13 bar for about 60![[thin space (1/6-em)]](https://www.rsc.org/images/entities/char_2009.gif) 000 h without any detectable decay rate.164 The DOE target for water electrolysis efficiency points to operate at 2 A cm−2 with a cell potential of 1.5 V vs. RHE within 2017.165 Because the anode is one of the largest sources of cell efficiency loss, significant R&D165 has been directed towards the development of more active and more stable catalyst systems. Both for acidic and for alkaline applications, material composition and microstructure must be optimized to enhance the rate of the OER, thus minimizing the efficiency loss (and in the case of PEWEs, the amount of noble metal catalysts). For many catalyst materials proposed in the present review, the material composition and morphology influence not only the catalyst activity toward the OER but also its corrosion stability. In several cases, the higher the activity, the lower the stability under typical oxygen evolution conditions; however, the origin of this reverse relationship between stability and activity is not yet fully understood. Understanding the parameters governing both the OER and the catalyst corrosion process, either via theoretical or experimental tools, can lead to the design of novel catalysts or simply to reach the best trade-off between activity and stability. It must be also emphasized that composition, material preparation/processing, and morphology are all factors responsible for the electrochemical activity, current selectivity and stability of oxygen evolution anodes, and thus, development of advanced catalysts can be reached only if all these factors are fully identified and controlled.
000 h without any detectable decay rate.164 The DOE target for water electrolysis efficiency points to operate at 2 A cm−2 with a cell potential of 1.5 V vs. RHE within 2017.165 Because the anode is one of the largest sources of cell efficiency loss, significant R&D165 has been directed towards the development of more active and more stable catalyst systems. Both for acidic and for alkaline applications, material composition and microstructure must be optimized to enhance the rate of the OER, thus minimizing the efficiency loss (and in the case of PEWEs, the amount of noble metal catalysts). For many catalyst materials proposed in the present review, the material composition and morphology influence not only the catalyst activity toward the OER but also its corrosion stability. In several cases, the higher the activity, the lower the stability under typical oxygen evolution conditions; however, the origin of this reverse relationship between stability and activity is not yet fully understood. Understanding the parameters governing both the OER and the catalyst corrosion process, either via theoretical or experimental tools, can lead to the design of novel catalysts or simply to reach the best trade-off between activity and stability. It must be also emphasized that composition, material preparation/processing, and morphology are all factors responsible for the electrochemical activity, current selectivity and stability of oxygen evolution anodes, and thus, development of advanced catalysts can be reached only if all these factors are fully identified and controlled.
Acknowledgements
The authors gratefully acknowledge the Ambizione Program of the Swiss National Science Foundation, the Competence Center Energy & Mobility, Switzerland (CCEM-CH) through the project RENERG2 as well as Commission for Technology & Innovation and the Swiss Competence Center for Energy Research (SCCER) Heat & Electricity Storage for financial contributions to this work. The authors also gratefully acknowledge Umicore AG & Co. KG for providing IrTiO2 catalysts used for the measurements shown in Fig. 2 and Prof. Jan Rossmeisl, Technical University of Denmark, for fruitful discussions and for providing some figures included in the manuscript.Notes and references
- H. Ibrahim, A. Ilinca and J. Perron, Renewable Sustainable Energy Rev., 2008, 12, 1221–1250 CrossRef CAS PubMed.
- S. Trasatti, J. Electroanal. Chem., 1999, 476, 90–91 CrossRef CAS.
- R. de Levie, J. Electroanal. Chem., 1999, 476, 92–93 CrossRef CAS.
- K. E. Ayers, E. B. Anderson, C. Capuano, B. Carter, L. Dalton, G. Hanlon, J. Manco and M. Niedzwiecki, ECS Trans., 2010, 33, 3–15 CAS.
- P. Millet, R. Ngameni, S. A. Grigoriev, N. Mbemba, F. Brisset, A. Ranjbari and C. Etiévant, Int. J. Hydrogen Energy, 2010, 35, 5043–5052 CrossRef CAS PubMed.
- N. Ramaswamy and S. Mukerjee, Adv. Phys. Chem., 2012, 17 Search PubMed.
- R. Hagelüken, R. Drieselmann and K. Van den Broeck, Availability of Metals and Materials, in Precious Materials Handbook, Umicore AG & Co. KG, Hanau-Wolfgang, Germany, 2012 Search PubMed.
- Y. Matsumoto and E. Sato, Mater. Chem. Phys., 1986, 14, 397–426 CrossRef CAS.
- L. Brossard, Int. J. Hydrogen Energy, 1992, 17, 671–676 CrossRef CAS.
- M. E. G. Lyons and S. Floquet, Phys. Chem. Chem. Phys., 2011, 13, 5314–5335 RSC.
- B. Lu, C. Wang, S. Chen, Y. Jinling, G. Wang and D. Cao, J. Solid State Electrochem., 2013, 17, 2277–2282 CrossRef CAS.
- U. A. Paulus, T. J. Schmidt, H. A. Gasteiger and R. J. Behm, J. Electroanal. Chem., 2001, 495, 134–145 CrossRef CAS.
- A. J. Bard and L. R. Faulkner, Electrochemical Methods - Fundamentals and Applications, JOHN WILEY & SONS, INC., New York • Chichester • Weinheim • Brisbane • Singapore • Toronto, 2nd edn, 2001 Search PubMed.
- C. C. L. McCrory, S. Jung, J. C. Peters and T. F. Jaramillo, J. Am. Chem. Soc., 2013, 135, 16977–16987 CrossRef CAS PubMed.
- J. O. M. Bockris and T. Otagawa, J. Electrochem. Soc., 1984, 131, 290–302 CrossRef CAS PubMed.
- A. Vojvodic and J. K. Nørskov, Science, 2011, 334, 1355–1356 CrossRef CAS PubMed.
- H. Dau, C. Limberg, T. Reier, M. Risch, S. Roggan and P. Strasser, ChemCatChem, 2010, 2, 724–761 CrossRef CAS.
- I. C. Man, H.-Y. Su, F. Calle-Vallejo, H. A. Hansen, J. I. Martínez, N. G. Inoglu, J. Kitchin, T. F. Jaramillo, J. K. Nørskov and J. Rossmeisl, ChemCatChem, 2011, 3, 1159–1165 CrossRef CAS.
- M. T. M. Koper, J. Electroanal. Chem., 2011, 660, 254–260 CrossRef CAS PubMed.
- M. T. M. Koper, J. Solid State Electrochem., 2013, 17, 339–344 CrossRef CAS.
- J. Rossmeisl, A. Logadottir and J. K. Nørskov, Chem. Phys., 2005, 319, 178–184 CrossRef CAS PubMed.
- J. Rossmeisl, K. Dimitrievski, P. Siegbahn and J. K. Nørskov, J. Phys. Chem. C, 2007, 111, 18821–18823 CAS.
- J. Rossmeisl, Z. W. Qu, H. Zhu, G. J. Kroes and J. K. Nørskov, J. Electroanal. Chem., 2007, 607, 83–89 CrossRef CAS PubMed.
- J. O. M. Bockris, J. Chem. Phys., 1956, 24, 817 CrossRef CAS PubMed.
- A. I. Krasil'shchkov, Zh. Fiz. Khim., 1963, 37, 273 Search PubMed.
- W. H. Wade and N. Hackerman, Trans. Faraday Soc., 1957, 53, 1636–1647 RSC.
- W. E. O'Grady, C. Iwakura, J. Huang and E. Yeager, The Electrochemical Society, ed. M. W. Breiter, Princeton, 1974, p. 286 Search PubMed.
- W. E. O'Grady, C. Iwakura and E. Yeager, American Society of Mechanical Engineers, 1976, 76 -ENAs-37 Search PubMed.
- S. Trasatti, Electrochim. Acta, 1984, 29, 1503–1512 CrossRef CAS.
- P. Sabatier, Ber. Dtsch. Chem. Ges., 1911, 44, 1984–2001 CrossRef CAS.
- N. M. Markovic, T. J. Schmidt, V. R. Stamenkovic and P. N. Ross, Fuel Cells, 2001, 1, 105–116 CrossRef CAS.
- I. Katsounaros, J. C. Meier and K. J. J. Mayrhofer, Electrochim. Acta, 2013, 110, 790–795 CrossRef CAS PubMed.
- A. R. Zeradjanin, N. Menzel, W. Schuhmann and P. Strasser, Phys. Chem. Chem. Phys., 2014, 16, 13741–13747 RSC.
- W. J. Albery and M. L. Hitchman, Ring-Disc Electrodes, Clarendon Press edn., OxFord, 1971 Search PubMed.
- K. Zeng and D. Zhang, Prog. Energy Combust. Sci., 2010, 36, 307–326 CrossRef CAS PubMed.
- A. R. Zeradjanin, A. A. Topalov, Q. Van Overmeere, S. Cherevko, X. X. Chen, E. Ventosa, W. Schuhmann and K. J. J. Mayrhofer, RSC Adv., 2014, 4, 9579–9587 RSC.
- R. Kötz, H. J. Lewerenz and S. Stucki, J. Electrochem. Soc., 1983, 130, 825–829 CrossRef PubMed.
- R. Kötz, S. Stucki, D. Scherson and D. M. Kolb, J. Electroanal. Chem. Interfacial Electrochem., 1984, 172, 211–219 CrossRef.
- S. Stucki, G. G. Scherer, S. Schlagowski and E. Fischer, J. Appl. Electrochem., 1998, 28, 1041–1049 CrossRef CAS.
- R. Kötz, H. Neff and S. Stucki, J. Electrochem. Soc., 1984, 131, 72–77 CrossRef PubMed.
- T. Hepel, F. H. Pollak and W. E. O'Grady, J. Electrochem. Soc., 1985, 132, 2385–2390 CrossRef CAS PubMed.
- A. Damjanovic, A. Dey and J. M. Bockris, J. Electrochem. Soc., 1966, 113, 739–746 CrossRef CAS PubMed.
- M. H. Miles, E. A. Klaus, B. P. Gunn, J. R. Locker, W. E. Serafin and S. Srinivasan, Electrochim. Acta, 1978, 23, 521–526 CrossRef CAS.
- M. H. Miles and M. A. Thomason, J. Electrochem. Soc., 1976, 123, 1459–1461 CrossRef CAS PubMed.
- D. B. Rogers, R. D. Shannon, A. W. Sleight and J. L. Gillson, Inorg. Chem., 1969, 8, 841–849 CrossRef CAS.
- R. S. Yeo, J. Orehotsky, W. Visscher and S. Srinivasan, J. Electrochem. Soc., 1981, 128, 1900–1904 CrossRef CAS PubMed.
- M. W. Shafer, R. A. Figat, R. Johnson and R. A. Pollack, 30th ISE meeting, Trondheim, Extended Abstracts, 1977, p. 313 Search PubMed.
- N. M. Markovic, T. J. Schmidt, V. Stamenkovic and P. N. Ross, Fuel Cells, 2001, 1, 105–116 CrossRef CAS.
- D. Galizzioli, F. Tantardini and S. Trasatti, J. Appl. Electrochem., 1974, 4, 57–67 CrossRef CAS.
- D. Galizzioli, F. Tantardini and S. Trasatti, J. Appl. Electrochem., 1975, 5, 203–214 CrossRef CAS.
- I. Katsounaros, S. Cherevko, A. R. Zeradjanin and K. J. J. Mayrhofer, Angew. Chem., Int. Ed., 2014, 53, 102–121 CrossRef CAS PubMed.
- L. D. Burke, O. J. Murphy, J. F. O'Neill and S. Venkatesan, J. Chem. Soc., Faraday Trans. 1, 1977, 73, 1659–1671 RSC.
- C. Iwakura, K. Hirao and H. Tamura, Electrochim. Acta, 1977, 22, 329–334 CrossRef CAS.
- R. Kötz, H. J. Lewerenz, P. Brüesch and S. Stucki, J. Electroanal. Chem. Interfacial Electrochem., 1983, 150, 209–216 CrossRef.
- J. Llopis and M. Vazquez, Electrochim. Acta, 1966, 11, 633–640 CrossRef CAS.
- A. Damjanovic, A. Dey and J. O. M. Bockris, Electrochim. Acta, 1966, 11, 791–814 CrossRef CAS.
- G. Lodi, E. Sivieri, A. Battisti and S. Trasatti, J. Appl. Electrochem., 1978, 8, 135–143 CrossRef CAS.
- M. Pourbaix, Atlas of electrochemical equilibria in aqueous solutions, Pergamon Press, Oxford; New York, 1966 Search PubMed.
- S. Hackwood, L. M. Schiavone, W. C. Dautremont-Smith and G. Beni, J. Electrochem. Soc., 1981, 128, 2569–2573 CrossRef CAS PubMed.
- B. Johnson, F. Girgsdies, G. Weinberg, D. Rosenthal, A. Knop-Gericke, R. Schlogl, T. Reier and P. Strasser, J. Phys. Chem. C, 2013, 117, 25443–25450 CAS.
- T. Reier, I. Weidinger, P. Hildebrandt, R. Kraehnert and P. Strasser, ECS Trans., 2013, 58, 39–51 CrossRef PubMed.
- B. E. Conway and J. Mozota, Electrochim. Acta, 1983, 28, 9–16 CrossRef CAS.
- S. Gottesfeld and S. Srinivasan, J. Electroanal. Chem. Interfacial Electrochem., 1978, 86, 89–104 CrossRef CAS.
- J. Mozota and B. E. Conway, Electrochim. Acta, 1983, 28, 1–8 CrossRef CAS.
- D. A. J. Rand and R. Woods, J. Electroanal. Chem. Interfacial Electrochem., 1974, 55, 375–381 CrossRef CAS.
- T. Reier, M. Oezaslan and P. Strasser, ACS Catal., 2012, 2, 1765–1772 CrossRef CAS.
- E. J. Frazer and R. Woods, J. Electroanal. Chem. Interfacial Electrochem., 1979, 102, 127–130 CrossRef CAS.
- R. Kötz and S. Stucki, Electrochim. Acta, 1986, 31, 1311–1316 CrossRef.
- G. Beni, L. M. Schiavore, J. L. Shay, W. C. Dautremont-Smith and B. S. Schneider, Nature, 1979, 282, 281–283 CrossRef CAS.
- X. Wu and K. Scott, Int. J. Hydrogen Energy, 2011, 36, 5806–5810 CrossRef CAS PubMed.
- J. Xu, Q. Li, M. K. Hansen, E. Christensen, A. L. Tomás García, G. Liu, X. Wang and N. J. Bjerrum, Int. J. Hydrogen Energy, 2012, 37, 18629–18640 CrossRef CAS PubMed.
- J. Xu, D. Aili, Q. Li, E. Christensen, J. O. Jensen, W. Zhang, M. K. Hansen, G. Liu, X. Wang and N. J. Bjerrum, Energy Environ. Sci., 2014, 7, 820–830 CAS.
- R. Kötz and S. Stucki, J. Electrochem. Soc., 1985, 132, 103–107 CrossRef PubMed.
- K. C. Neyerlin, G. Bugosh, R. Forgie, Z. C. Liu and P. Strasser, J. Electrochem. Soc., 2009, 156, B363–B369 CrossRef CAS PubMed.
- R. Forgie, G. Bugosh, K. C. Neyerlin, Z. C. Liu and P. Strasser, Electrochem. Solid-State Lett., 2010, 13, D36–D39 CrossRef PubMed.
- N. B. Halck, V. Petrykin, P. Krtil and J. Rossmeisl, Phys. Chem. Chem. Phys., 2014, 16, 13682–13688 RSC.
- C. P. De Pauli and S. Trasatti, J. Electroanal. Chem., 2002, 538, 145–151 CrossRef.
- A. Marshall, B. Børresen, G. Hagen, S. Sunde, M. Tsypkin and R. Tunold, Russ. J. Electrochem., 2006, 42, 1134–1140 CrossRef CAS.
- H. N. Nong, L. Gan, E. Willinger, D. Teschner and P. Strasser, Chem. Sci., 2014, 5, 2955–2963 RSC.
- A. T. Marshall and R. G. Haverkamp, Electrochim. Acta, 2010, 55, 1978–1984 CrossRef CAS PubMed.
- K. Kadakia, M. K. Datta, P. H. Jampani, S. K. Park and P. N. Kumta, J. Power Sources, 2013, 222, 313–317 CrossRef CAS PubMed.
- O. I. Velikokhatnyi, K. Kadakia, M. K. Datta and P. N. Kumta, J. Phys. Chem. C, 2013, 117, 20542–20547 CAS.
- K. Kadakia, M. K. Datta, O. I. Velikokhatnyi, P. Jampani, S. K. Park, S. J. Chung and P. N. Kumta, J. Power Sources, 2014, 245, 362–370 CrossRef CAS PubMed.
- R. Hutchings, K. Müller, R. Kötz and S. Stucki, J. Mater. Sci., 1984, 19, 3987–3994 CrossRef CAS.
- A. T. Marshall, S. Sunde, M. Tsypkin and R. Tunold, Int. J. Hydrogen Energy, 2007, 32, 2320–2324 CrossRef CAS PubMed.
- J. F. C. Boodts and S. Trasatti, J. Electrochem. Soc., 1990, 137, 3784–3789 CrossRef CAS PubMed.
- L. A. Da Silva, V. A. Alves, S. Trasatti and J. F. C. Boodts, J. Electroanal. Chem., 1997, 427, 97–104 CrossRef CAS.
- J. R. Varcoe and R. C. T. Slade, Electrochem. Commun., 2006, 8, 839–843 CrossRef CAS PubMed.
- M. Shiels, Fuel Cells Bull., 2014, 2014, 4 Search PubMed.
- R. Subbaraman, D. Tripkovic, K.-C. Chang, D. Strmcnik, A. P. Paulikas, P. Hirunsit, M. Chan, J. Greeley, V. Stamenkovic and N. M. Markovic, Nat. Mater., 2012, 11, 550–557 CrossRef CAS PubMed.
- M. E. G. Lyons and M. P. Brandon, Int. J. Electrochem. Sci., 2008, 3, 1425–1462 CAS.
- M. E. G. Lyons and M. P. Brandon, Int. J. Electrochem. Sci., 2008, 3, 1386–1424 CAS.
- C. Iwakura, A. Honji and H. Tamura, Electrochim. Acta, 1981, 25, 1319–1326 CrossRef.
- B. S. Yeo and A. T. Bell, J. Am. Chem. Soc., 2011, 133, 5587–5593 CrossRef CAS PubMed.
- J. Ponce, E. Rios, J.-L. Rehspringer, G. Poillerat, P. Chartier and J. L. Gautier, J. Solid State Chem., 1999, 145, 23–32 CrossRef CAS.
- J. Ponce, J. L. Rehspringer, G. Poillerat and J. L. Gautier, Electrochim. Acta, 2001, 46, 3373–3380 CrossRef CAS.
- M. Srivastava, M. Elias Uddin, J. Singh, N. H. Kim and J. H. Lee, J. Alloys Compd., 2014, 590, 266–276 CrossRef CAS PubMed.
- R. N. Singh, N. K. Singh and J. P. Singh, Electrochim. Acta, 2002, 47, 3873–3879 CrossRef CAS.
- B. Lal, N. K. Singh, S. Samuel and R. N. Singh, J. New Mater. Electrochem. Syst., 1999, 2, 59–64 CAS.
- Polymer Electrolyte Fuel Cell Durability, ed. F. N. Büchi, M. Inaba and T. J. Schmidt, Springer Science and Business Media LLC, New York, 2009, pp. 199–221 Search PubMed.
- D. A. Corrigan, J. Electrochem. Soc., 1980, 134, 377–384 CrossRef PubMed.
- L. Trotochaud, J. K. Ranney, K. N. Williams and S. W. Boettcher, J. Am. Chem. Soc., 2012, 134, 17253–17261 CrossRef CAS PubMed.
- M. E. G. Lyons, R. L. Doyle, I. Godwin, M. O'Brien and L. Russell, J. Electrochem. Soc., 2012, 159, H932–H944 CrossRef CAS PubMed.
- S. L. Medway, C. A. Lucas, A. Kowal, R. J. Nichols and D. Johnson, J. Electroanal. Chem., 2006, 587, 172–181 CrossRef CAS PubMed.
- I. J. Godwin and M. E. G. Lyons, Electrochem. Commun., 2013, 32, 39–42 CrossRef CAS PubMed.
- H. Bode, K. Dehmelt and J. Witte, Z. Anorg. Allg. Chem., 1969, 366, 1 CrossRef CAS.
- H. Bode, K. Dehmelt and J. Witte, Ber. Bunsen-Ges., 1963, 67, 839–839 Search PubMed.
- H. Bode, K. Dehmelt and J. Witte, Electrochim. Acta, 1966, 11, 1079–1087 CrossRef CAS.
- M. E. G. Lyons and M. P. Brandon, J. Electroanal. Chem., 2010, 641, 119–130 CrossRef CAS PubMed.
- A. Delahaye-Vidal and M. Figlarz, J. Appl. Electrochem., 1987, 17, 589–599 CrossRef CAS.
- M. S. Kim and K. B. Kim, J. Electrochem. Soc., 1998, 145, 507–511 CrossRef CAS PubMed.
- P. W. T. Lu and S. Srinivasan, J. Electrochem. Soc., 1978, 125, 1416–1422 CrossRef CAS PubMed.
- D. Cibrev, M. Jankulovska, T. Lana-Villarreal and R. Gomez, Int. J. Hydrogen Energy, 2013, 38, 2746–2753 CrossRef CAS PubMed.
- M. R. Gennero de Chialvo and A. C. Chialvo, Electrochim. Acta, 1988, 33, 825–830 CrossRef CAS.
- M. Cappadonia, J. Divisek, T. Von der Heyden and U. Stimming, Electrochim. Acta, 1994, 39, 1559–1564 CrossRef CAS.
- M. F. Kibria and M. S. Mridha, Int. J. Hydrogen Energy, 1996, 21, 179–182 CrossRef CAS.
- R. D. L. Smith, M. S. Prévot, R. D. Fagan, S. Trudel and C. P. Berlinguette, J. Am. Chem. Soc., 2013, 135, 11580–11586 CrossRef CAS PubMed.
- E. L. Miller and R. E. Rocheleau, J. Electrochem. Soc., 1997, 144, 3072–3077 CrossRef CAS PubMed.
- E. L. Miller and R. E. Rocheleau, J. Electrochem. Soc., 1997, 144, 1995–2003 CrossRef CAS PubMed.
- X. Li, F. C. Walsh and D. Pletcher, Phys. Chem. Chem. Phys., 2011, 13, 1162–1167 RSC.
- M. D. Merrill and R. C. Dougherty, J. Phys. Chem. C, 2008, 112, 3655–3666 CAS.
- J. Landon, E. Demeter, I. Nilay, C. Keturakis, I. E. Wachs, R. Vasic, A. I. Frenkel and J. R. Kitchin, ACS Catal., 2012, 2, 1793–1801 CrossRef CAS.
- M. W. Louie and A. T. Bell, J. Am. Chem. Soc., 2013, 135, 12329–12337 CrossRef CAS PubMed.
- L. Xu, Y.-S. Ding, C.-H. Chen, L. Zhao, C. Rimkus, R. Joesten and S. L. Suib, Chem. Mater., 2008, 20, 308–316 CrossRef CAS.
- S. H. Ahn, I. Choi, H.-Y. Park, S. J. Hwang, S. J. Yoo, E. Cho, H.-J. Kim, D. Henkensmeier, S. W. Nam, S.-K. Kim and J. H. Jang, Chem. Commun., 2013, 49, 9323–9325 RSC.
- G. W. Simmons, E. Kellerman and H. Leidheiser, J. Electrochem. Soc., 1976, 123, 1276–1284 CrossRef CAS PubMed.
- G. W. Simmons, A. Vértes, M. L. Varsányi and H. Leidheiser, J. Electrochem. Soc., 1979, 126, 187–189 CrossRef CAS PubMed.
- H. Willems, A. G. C. Kobussen, J. H. W. De Wit and G. H. J. Broers, J. Electroanal. Chem. Interfacial Electrochem., 1984, 170, 227–242 CrossRef CAS.
- H. Willems, A. G. C. Kobussen, I. C. Vinke, J. H. W. De Wit and G. H. J. Broers, J. Electroanal. Chem. Interfacial Electrochem., 1985, 194, 287–303 CrossRef CAS.
- G. Wu, N. Li, D.-R. Zhou, K. Mitsuo and B.-Q. Xu, J. Solid State Chem., 2004, 177, 3682–3692 CrossRef CAS PubMed.
- I. Nikdov, R. Darkaoui, E. Zhecheva, R. Stoyanova, N. Dimitrov and T. Vitanov, J. Electroanal. Chem., 1997, 429, 157–168 CrossRef.
- J. A. Koza, Z. He, A. S. Miller and J. A. Switzer, Chem. Mater., 2012, 24, 3567–3573 CrossRef CAS.
- M. Bajdich, M. García-Mota, A. Vojvodic, J. K. Nørskov and A. T. Bell, J. Am. Chem. Soc., 2013, 135, 13521–13530 CrossRef CAS PubMed.
- K. Fatih and B. Marsan, Can. J. Chem., 1997, 75, 1597–1607 CrossRef CAS.
- X. Wu and K. Scott, J. Mater. Chem., 2011, 21, 12344–12344 RSC.
- J. Jia, X. Li and G. Chen, Electrochim. Acta, 2010, 55, 8197–8206 CrossRef CAS PubMed.
- R. Berenguer, A. La Rosa-Toro, C. Quijada and E. Morallón, J. Phys. Chem. C, 2008, 112, 16945–16952 CAS.
- T.-C. Wen and H.-M. Kang, Electrochim. Acta, 1998, 43, 1729–1745 CrossRef CAS.
- F. Rosalbino, S. Delsante, G. Borzone and G. Scavino, Int. J. Hydrogen Energy, 2013, 38, 10170–10177 CrossRef CAS PubMed.
- Y.-S. Lee, C.-C. Hu and T.-C. Wen, J. Electrochem. Soc., 1996, 143, 1218–1225 CrossRef CAS PubMed.
- E. Rios, P. Chartier and J. L. Gautier, Solid State Sci., 1999, 1, 267–277 CrossRef CAS.
- S. Joiret, M. Keddam, X. R. Nóvoa, M. C. Pérez, C. Rangel and H. Takenouti, Cem. Concr. Compos., 2002, 24, 7–15 CrossRef CAS.
- B. Messaoudi, S. Joiret, M. Keddam, H. Takenouti, M. Curie and C. P. Jussieu, Electrochim. Acta, 2001, 46, 2487–2498 CrossRef CAS.
- Y. Miyahara, K. Miyazaki, T. Fukutsuka and T. Abe, J. Electrochem. Soc., 2014, 161, F694–F697 CrossRef CAS PubMed.
- M. Morita, C. Iwakura and H. Tamura, Electrochim. Acta, 1979, 24, 357–362 CrossRef CAS.
- K. Mette, A. Bergmann, J. P. Tessonnier, M. Havecker, L. D. Yao, T. Ressler, R. Schlogl, P. Strasser and M. Behrens, ChemCatChem, 2012, 4, 851–862 CrossRef CAS.
- A. Bergmann, I. Zaharieva, H. Dau and P. Strasser, Energy Environ. Sci., 2013, 6, 2745–2755 CAS.
- A. Ramírez, P. Bogdanoff, D. Friedrich and S. Fiechter, Nano Energy, 2012, 1, 282–289 CrossRef PubMed.
- M. M. Najafpour and D. J. Sedigh, Dalton Trans., 2013, 42, 12173–12178 RSC.
- T. Wolfram and S. Ellialtioglu, Electronic and Optical Properties of d-Band Perovskites, Cambridge University Press, 2006 Search PubMed.
- Y. Matsumoto, S. Yamada, T. Nishida and E. Sato, J. Electrochem. Soc., 1980, 127, 2360–2364 CrossRef CAS PubMed.
- T. Otagawa and J. O. M. Bockris, J. Electrochem. Soc., 1982, 129, 2391–2392 CrossRef CAS PubMed.
- J. O. M. Bockris and T. Otagawa, J. Phys. Chem., 1983, 87, 2960–2971 CrossRef CAS.
- S. Trasatti, J. Electroanal. Chem. Interfacial Electrochem., 1980, 111, 125–131 CrossRef CAS.
- J. Suntivich, K. J. May, H. A. Gasteiger, J. B. Goodenough and Y. Shao-Horn, Science, 2011, 334, 1383–1385 CrossRef CAS PubMed.
- W. G. Hardin, D. A. Slanac, X. Wang, S. Dai, K. P. Johnston and K. J. Stevenson, J. Phys. Chem. Lett., 2013, 4, 1254–1259 CrossRef CAS.
- C. Jin, X. Cao, F. Lu, Z. Yang and R. Yang, Int. J. Hydrogen Energy, 2013, 38, 10389–10393 CrossRef CAS PubMed.
- C. Jin, X. Cao, L. Zhang, C. Zhang and R. Yang, J. Power Sources, 2013, 241, 225–230 CrossRef CAS PubMed.
- A. Grimaud, K. J. May, C. E. Carlton, Y.-L. Lee, M. Risch, W. T. Hong, J. Zhou and Y. Shao-Horn, Nat. Commun., 2013, 4, 2439–2439 Search PubMed.
- R. Mohamed, E. Fabbri, P. Levecque, R. Kötz, T. J. Schmidt and O. Conrad, ECS Trans., 2014, 58, 9–18 CrossRef PubMed.
- E. Fabbri, A. Rabis, R. Kotz and T. Schmidt, Phys. Chem. Chem. Phys., 2014, 16, 13672–13681 RSC.
- S. Raabe, D. Mierwaldt, J. Ciston, M. Uijttewaal, H. Stein, J. Hoffmann, Y. Zhu, P. Blöchl and C. Jooss, Adv. Funct. Mater., 2012, 22, 3378–3388 CrossRef CAS.
- M. Komo, A. Hagiwara, S. Taminato, M. Hirayama and R. Kanno, Electrochemistry, 2012, 80, 834–838 CrossRef CAS PubMed.
- E. B. Anderson, K. E. Ayers, C. B. Capuano and S. Szymanski, Long Life PEM Water Electrolysis Stack Experience and Future Directions, http://www.h2fc-fair.com/hm13/images/ppt/09tu/1530.pdf, Accessed May, 2014 Search PubMed.
- K. E. Ayers, C. B. Capuano and E. B. Anderson, ECS Trans., 2012, 12, 15–22 Search PubMed.
| This journal is © The Royal Society of Chemistry 2014 |