Dynamic behaviour of tantalum hydride supported on silica or MCM-41 in the metathesis of alkanes†
Sophie
Soignier
,
Guillaume
Saggio
,
Mostafa
Taoufik
,
Jean-Marie
Basset‡
and
Jean
Thivolle-Cazat
*
Université de Lyon, ICL, C2P2 UMR 5265 (CNRS-CPE-Université Lyon 1) LCOMS-CPE-Lyon, 43 Boulevard du 11 Novembre 1918, F-69616, Villeurbanne, France. E-mail: thivolle@cpe.fr
First published on 1st November 2013
Abstract
The metathesis of ethane and propane catalysed by tantalum hydride supported on silica or MCM-41 was studied under static and dynamic conditions. During the reaction, the rate decreased over time, indicating deactivation of the catalyst. The evolution of the catalytic system and surface species over time was monitored by various physico-chemical methods: FTIR, 13C NMR spectroscopy, elemental analysis and chemical reactivity. A carbonaceous deposit composed of unsaturated hydrocarbyl species was observed by 13C NMR. This deposit was responsible for poisoning of the catalyst. The deactivation of the catalyst proved more severe at higher temperatures and under static rather than dynamic conditions. A partial regeneration of the catalyst could be achieved during a series of repeated runs. Mechanistically, the deconvolution of the products’ distribution over time indicated the occurrence of hydrogenolysis in the early stages of the reaction, while pure metathesis dominated later on. The hydrogen was supplied by the dehydrogenation of hydrocarbyl surface species involved in the deactivation process.
Introduction
The catalytic transformation of alkanes into valuable products remains an important challenge in chemistry considering the inertness of their C–H and C–C bonds and also the considerable application potential.1–5 We reported previously the discovery of the alkane metathesis reaction, where a highly electrophilic tantalum hydride supported on silica, [(![[triple bond, length as m-dash]](https://www.rsc.org/images/entities/char_e002.gif) SiO)2Ta–H]/SiO2, 1,6 could catalytically transform at moderate temperatures any light alkane into its lower and higher homologues by both cleavage and formation of C–H and C–C bonds (eqn 1):7–9
SiO)2Ta–H]/SiO2, 1,6 could catalytically transform at moderate temperatures any light alkane into its lower and higher homologues by both cleavage and formation of C–H and C–C bonds (eqn 1):7–9 | (1) |
Kinetic studies performed at very low contact times showed that hydrogen and olefins were the primary products of the reaction suggesting that the same intermediates as those involved in olefin metathesis should be involved in this reaction. Further investigations revealed that the reaction occurred on a single site tantalum–carbene–hydride, Ta(![[double bond, length as m-dash]](https://www.rsc.org/images/entities/char_e001.gif) CHR)(H), and involved: (i) C–H activation on the metal hydride (Ta–H); (ii) α-H or β-H elimination on the tantalum–alkyl formed; (iii) olefin metathesis on the carbene moiety (TaCHR) with metallocyclobutane as a key intermediate, and (iv) hydrogenation of the new formed olefins on the metal hydride (Ta–H).8,10,11 Therefore, to support such a mechanism, a hydro-metathesis reaction was performed using an equimolar mixture of olefin and hydrogen with the same catalyst, which proved ten times more active than alkane metathesis.12 The use of 13C-monolabelled ethane also showed the occurrence of degenerative processes besides the productive one, and the total scrambling of carbons in the various products.13,14 Surface complex 1 was obtained by treatment at 150 °C under hydrogen of the perhydrocarbyl surface tantalum complexes [(SiO)Ta(CHtBu)(CH2tBu)2] and [(SiO)2Ta(CHtBu) (CH2tBu)], resulting from the reaction of [Ta(CHtBu)(CH2tBu)3],15 with the OH groups of a fumed silica (Evonik, Aerosil 200 m2 g−1) partially dehydroxylated at 500 °C.16–18 Surface complex [(SiO)2Ta–H]/MCM-41, 2, was obtained in a similar way on the mesoporous silica MCM-41 (800 m2 g−1).19 Complexes 1 and 2 were characterized by FTIR, elemental and mass balance analyses, chemical reactions and EXAFS.6,19
CHR)(H), and involved: (i) C–H activation on the metal hydride (Ta–H); (ii) α-H or β-H elimination on the tantalum–alkyl formed; (iii) olefin metathesis on the carbene moiety (TaCHR) with metallocyclobutane as a key intermediate, and (iv) hydrogenation of the new formed olefins on the metal hydride (Ta–H).8,10,11 Therefore, to support such a mechanism, a hydro-metathesis reaction was performed using an equimolar mixture of olefin and hydrogen with the same catalyst, which proved ten times more active than alkane metathesis.12 The use of 13C-monolabelled ethane also showed the occurrence of degenerative processes besides the productive one, and the total scrambling of carbons in the various products.13,14 Surface complex 1 was obtained by treatment at 150 °C under hydrogen of the perhydrocarbyl surface tantalum complexes [(SiO)Ta(CHtBu)(CH2tBu)2] and [(SiO)2Ta(CHtBu) (CH2tBu)], resulting from the reaction of [Ta(CHtBu)(CH2tBu)3],15 with the OH groups of a fumed silica (Evonik, Aerosil 200 m2 g−1) partially dehydroxylated at 500 °C.16–18 Surface complex [(SiO)2Ta–H]/MCM-41, 2, was obtained in a similar way on the mesoporous silica MCM-41 (800 m2 g−1).19 Complexes 1 and 2 were characterized by FTIR, elemental and mass balance analyses, chemical reactions and EXAFS.6,19
The latter technique indicated the presence of two σ-bonded oxygen atoms at 1.9 Ǻ in the first coordination shell of tantalum, as well as several other surface oxygen atoms (probably from Si–O–Si bridges) in a close interaction between 2.6 and 2.9 Å for about 50 to 80% of the tantalum sites.6,19 Hence, surface tantalum hydride was likely to coexist with a trishydride on the sites free of interactions with donating oxygens.
The reactions of 1 with cycloalkanes, or 2 with methane showed a decrease of the rate over time suggesting a heterogeneity of the surface tantalum sites6,19,20 as was also observed in the case of silica-supported zirconium hydride.21 Such a behaviour could be related to the presence of interacting surface oxygen atoms which would slow down the reactivity of tantalum hydride species, as did coordinating molecules such as PMe3.22 Similar observations have been mentioned in the literature regarding the use of silica-supported lanthanide centres23,24 or also a tungsten imido neopentylidene complex,25 as well as reduced Cr(II) sites affording propagating species of various reactivity in polymerisation.26,27
In addition, selective poisoning experiments with dry oxygen pulses on species 1 revealed that only 50% of the tantalum hydride sites were active in the alkane metathesis reaction; active species were assumed to be freed from interaction with the support surface.28 Furthermore, during the alkane metathesis, the reaction rate decreased with time, indicating a deactivation process of the catalyst.7–9 Herein we wish to report a comparative study of the metathesis of ethane and propane on tantalum hydride, using both silica and MCM-41 as supports. The performances of the catalyst were evaluated at different temperatures and pressures under static or dynamic conditions in order to determine the optimal productivity during ethane metathesis. In addition, the deactivation of the catalyst needs to be understood in order to find ways to improve its stability. On-stream deactivation and evolution of the catalytic system and surface species were also monitored by various physico-chemical methods.
Results and discussion
I Study of the metathesis of ethane and propane in a continuous flow reactor
The metathesis of propane catalyzed by the silica-supported tantalum hydride [(SiO)2Ta–H]/SiO2, 1, in a continuous flow reactor has been reported previously.8 Tantalum hydride [(SiO)2Ta–H]/MCM-41, 2, was also prepared on mesoporous silica in order to increase the metal content and improve the characterization.19 It was used to study the metathesis of ethane and propane under static and dynamic conditions.
SiO)2Ta–H]/MCM-41,192, (300 mg, wt% Ta = 11.7) was loaded directly into the continuous flow reactor. The metathesis of ethane was studied at 150 °C with a 3 Nml min−1 flow rate under various pressures (1, 5 and 10 bar); conversions and turnover number (TON) are given in Fig. 1.
 | ||
| Fig. 1 Conversion (1) and TON (2) versus time for ethane metathesis catalyzed by [(SiO)2Ta–H]/MCM-41, 2, (300 mg, wt% Ta = 11.7) under 1 (◇), 5 (□) and 10 (△) bar (150 °C, 3 Nml min−1) | ||
The conversions were found to increase rapidly up to maxima of 7, 12 and 17% as a function of pressure, before decreasing to pseudo steady states. Cumulated TON also increased with time and reached respective values of 90, 170 and 230 after 133 h. It turns out that both ethane conversion and TON increased with pressure (Fig. 1). Moreover, the catalyst deactivation appeared moderate when the pseudo steady state was reached. Mainly methane and propane were formed with smaller amounts of iso and n-butane. Whatever the pressure, the distribution of products at steady state proved very similar (Table 1).
SiO)2Ta–H]/MCM-41, 2, (300 mg, wt% Ta = 11.7) at different pressures in dynamic conditions (150 °C, 3 Nml min−1)
| P (bar) | CH4 | C3H8 | iC4H10 | nC4H10 | iC4/nC4 |
|---|---|---|---|---|---|
| 1 | 55.3 | 39.6 | 3 | 2.1 | 1.43 |
| 5 | 54.8 | 39.5 | 3.3 | 2.4 | 1.37 |
| 10 | 55.5 | 38.2 | 3.4 | 3.4 | 1 |
Considering the product distribution of the reaction under 1 bar (Fig. 2-1), large quantities of methane were evolved initially, whereas a small amount of propane was formed; the curves then converged to reach a plateau after about 33 h (55% for methane and 39.4% for propane). Lower quantities of butane and isobutane were present throughout the reaction (2 and 3%, respectively) as well as traces of hydrogen (about 0.3%). According to the previously proposed mechanism,8 butanes necessarily arise from a secondary reaction.
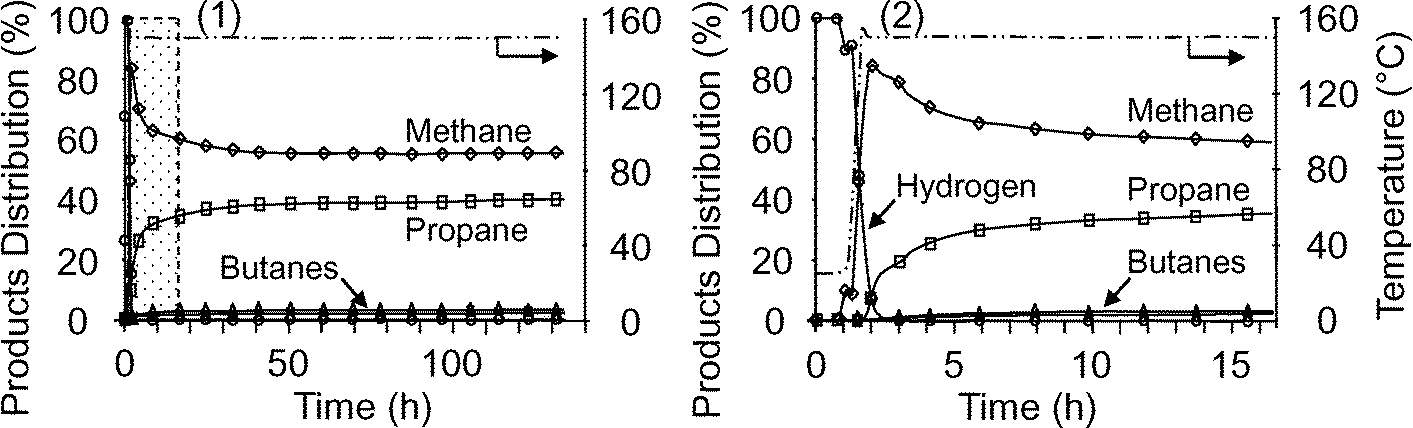 | ||
| Fig. 2 Products distribution versus time for ethane metathesis under 1 bar, 3 Nml min−1 and 150 °C, catalyzed by [(SiO)2Ta–H]/MCM-41, 2, (300 mg, wt% Ta = 11.7): (1) alkanes and H2 selectivities; (2) enlargement of the dashed region [0–16 h]. | ||
As shown in the enlargement of Fig. 2-1 (0 to 16 h), only hydrogen can be observed initially (Fig. 2-2), while methane appeared during heating of the reactor (50 min). The propane formation started when the reactor temperature reached the plateau. The appearance of hydrogen corresponded to the initiation of the reaction during which the C–H bonds of ethane were activated by species 2; about 80% of species 2 was converted during the activation step after 6 hours according to the infrared study (vide infra). The amount of methane increased up to a maximum of 84%, while hydrogen decreased throughout from 100%. As ethane metathesis is expected to produce comparable amounts of methane and propane, the observed excess of methane should result from another reaction, likely ethane hydrogenolysis.29,30 The origin of the hydrogen necessary for such a reaction probably does not arise from the C–H bond activation alone but should also involve other processes related to deactivation (vide infra). A similar evolution of products was observed under 5 or 10 bar of ethane.
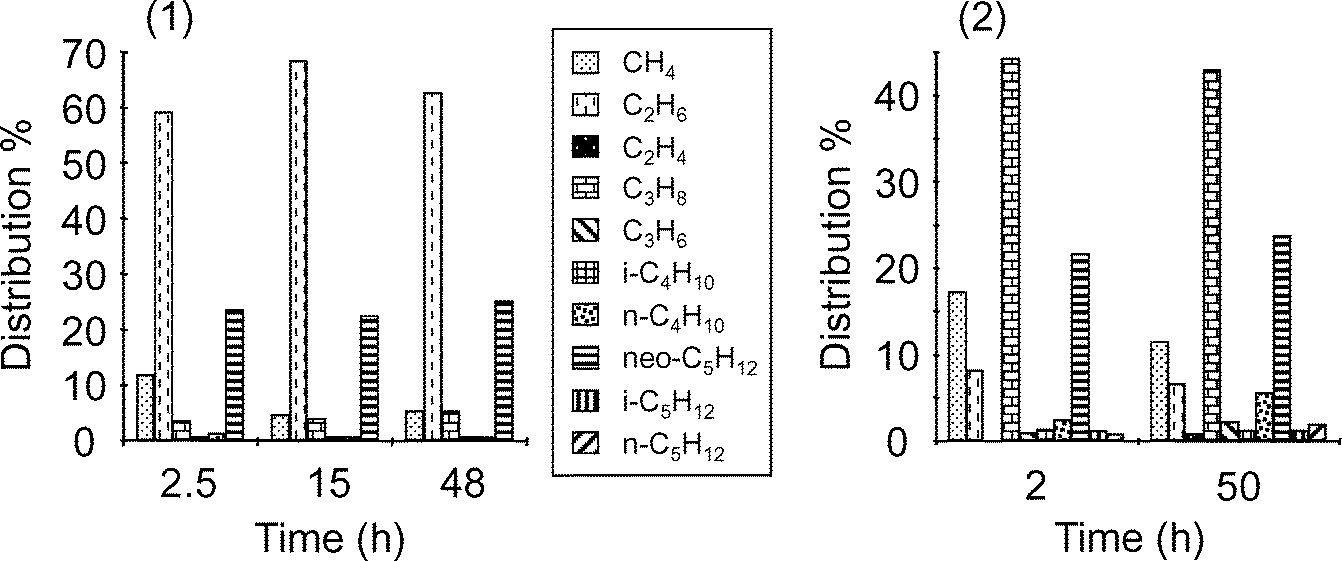
Concerning the products of the reaction (Fig. 3), a mixture of lower and higher homologues was formed that included methane, ethane, butane, isobutane, pentane and isopentane; the amount of methane decreased progressively along the reaction time, whereas that of the other products reached a pseudo plateau after 40 h. Then after 116 h, the following values were obtained: ethane (49.5%) > butane (31.8%) > pentane (6.8%) > isobutane (4.5%) > methane (4.4%) > isopentane (2%) > hydrogen (0.9%). These data proved quite comparable to those obtained in the case of the Aerosil-silica as support.8
 | ||
| Fig. 3 Products distribution versus time for propane metathesis under 1 bar, 3 Nml min−1 and 150 °C, catalyzed by [(SiO)2Ta–H]/MCM-41, 2, (300 mg, wt% Ta = 11.7): (1) alkanes and H2 selectivities; (2) enlargement of the dashed region [0–16 h]. | ||
The enlargement of Fig. 3-1 at the beginning of the reaction (Fig. 3-2) shows firstly the sole presence of hydrogen, followed by the appearance of methane and ethane during heating of the reactor; both these products passed through maxima (47 and 43.1%, respectively) when the temperature reached the plateau. In parallel, the amount of hydrogen decreased. Again the formation of higher homologues, butane, isobutane, pentane and isopentane, started when the temperature reached the plateau.
The formation of hydrogen again corresponded to the initiation of the reaction during which the C–H bond activation of propane on species 2 took place; differing from ethane, this activation step proceeded rapidly since after 30 min about 90% of the ν(Ta–H) bands were lost according to the infrared study (vide infra). The initial formation of methane and ethane was likely the result of propane hydrogenolysis.29,30 As for ethane, such a process is likely related to the deactivation process. Butane formation indicated that the metathesis reaction had started, which also contributed to the formation of methane and ethane.8
Case of ethane. In order to evaluate to what extent the hydrogenolysis reaction can occur alongside the metathesis, some calculations were made using the products’ distribution previously obtained, to deconvolute both processes; as metathesis is assumed to produce equimolar quantities of higher and lower homologues, any excess of the latter was ascribed to hydrogenolysis (see ESI† for the calculation method).
The total TOF (turnover frequency) of the reaction was first plotted versus reaction time for the various experiments performed under 1, 5 and 10 bar of ethane (Fig. 4-1). As observed for the conversion of ethane, the TOF presented maxima which increased with pressure; the following pseudo plateau for each of them was also situated at a higher value when the pressure was higher. Under 1 and 5 bar, two maxima were observed, whereas under 10 bar they coalesced, probably because of the contact time which increased with the pressure. Starting from the distribution of the various products, this TOF was deconvoluted between the hydrogenolysis and the metathesis reactions.
 | ||
| Fig. 4 Ethane metathesis (at 150 °C, 3 Nml min−1) catalyzed by [(SiO)2Ta–H]/MCM-41, 2, (300 mg, wt% Ta = 11.7) under 1 (◇), 5 (□) and 10 (△) bar: (1) total TOF; (2) TOF of hydrogenolysis reaction; (3) TOF of metathesis reaction and (4) percentage of metathesis contribution versus time. | ||
Fig. 4-2 shows ethane hydrogenolysis TOF. As in the previous case, the TOF over time presented two maxima under 1 bar, which progressively coalesced when the pressure reached 10 bar. Again, the height of these maxima increased with the pressure; the maximal rates of the pure hydrogenolysis obtained under 10, 5 and 1 bar corresponded to the following values: 4.3, 3.24 and 2.16 mol of ethane (mol Ta)−1 h−1, respectively. After 8 h, this TOF became very small and close to 0. The presence of the first maximum corresponded to the temperature plateau accompanied by the C–H bond activation step on species 2; the second peak is assigned to a dehydrogenation process during the start of the metathesis reaction, involving also the deactivation of the catalyst. Fig. 4-3 corresponds to the TOF of the pure ethane metathesis which presented only one maximum for each pressure and pseudo plateau situated at different values according to the pressure; the values of the maxima and of the pseudo plateau increased with the pressure. The maximal rates of the pure metathesis obtained under 10, 5 and 1 bar corresponded to the following values: 3.4, 2.48 and 1.48 mol of ethane (mol Ta)−1 h−1; from these maxima a decrease of the rates was observed indicating the deactivation of the catalyst. In the range of 16–41 h, corresponding to the pseudo plateau, the TOF of pure metathesis decreased twice as fast under 10 bar than under 1 bar. This deactivation process could lead to the formation of hydrogen, explaining the presence of a second peak in the figures related to the hydrogenolysis or the total TOF (Fig. 4-1 and 4-2). From Fig. 4-2 and 4-3, the contribution of the metathesis reaction in the global process during the reaction time was deduced (Fig. 4-4). Independently from the pressure, the evolution of the various curves appears very close, which indicates that the effect of pressure on the rates of hydrogenolysis and metathesis was comparable. For each experiment, it clearly appears that the contribution of the hydrogenolysis was high at the beginning, whereas that of the metathesis reaction increased rapidly afterwards; after 33 h, the contribution of this latter ranged between 97 to 100% for the various pressures employed.
Again, the occurrence of a hydrogenolysis reaction at the beginning of the process raised the question of the source of the hydrogen. First of all, in each experiment a hydrogen release was detected at the beginning of the reaction; Fig. 5-1 showed a first peak at room temperature giving the same amount of hydrogen evolved per tantalum (about 0.25 H2 per Ta) for each experiment; this value can correspond to the liberation of hydrogen from a tantalum trishydride species (about 25%) since the activation of ethane cannot take place significantly under these conditions. As reported in the literature, the formation of a σ-alkane complex can be envisaged which would help with the hydrogen release.31 When the temperature was raised, a second peak appeared, corresponding to the C–H bond activation of ethane. This peak decreased faster under pressure, probably because the space velocity of the reactant gas decreased inside the reactor when the pressure increased, thus raising the contact time (Fig. 5-1).
 | ||
| Fig. 5 Ethane metathesis (at 150 °C, 3 Nml min−1) catalyzed by [(SiO)2Ta–H]/MCM-41, 2, (300 mg, wt% Ta = 11.7) under 1 (◇), 5 (□) and 10 (△) bar: (1) detected hydrogen: mol H2 (mol Ta)−1 min−1 and (2) calculated amount of hydrogen contributing to hydrogenolysis: cumulated mol H2 per mol Ta versus time. | ||
Then, the hydrogen corresponding to the C–H bond activation of ethane would react and be consumed more significantly under pressure to perform hydrogenolysis. Thus, the cumulated amounts of hydrogen liberated per tantalum varied from 0.6 to 1.2 when the pressure decreased from 10 to 1 bar (cf.Table 2). Naturally, this hydrogen detected by GC was not consumed in hydrogenolysis. Therefore, the distribution of the various products was also used to evaluate the amount of hydrogen responsible for the excess of lower homologues, i.e. methane, resulting from hydrogenolysis (see ESI† for the details of the calculations). Fig. 5-2 shows that the amount of hydrogen increased with pressure and the reaction time. After 41 h, 3.9 (1 bar), 5.2 (5 bar) and 7.9 (10 bar) mol H2 per mol Ta were determined. Table 2 sums up the various data concerning (i) the hydrogen detected, (ii) the hydrogen which participated in the hydrogenolysis and (iii) that arising from the deactivation process, deduced from (i) and (ii) (see the details of the calculations in Table 2). It turns out that the amounts of the last two types of hydrogen increased with the pressure. Since the pressure increased the contact time and the surface concentration of the reactants and products, this could favour the dehydrogenation process.
| Pressure (bar) | Total H2 detected | Total H2 needed for hydrogenolysis | Total H2 coming from deactivationa |
|---|---|---|---|
| (mol per mol Ta) | (mol per mol Ta) | (mol per mol Ta) | |
| a H2 coming from deactivation was determined as the sum of the second and third columns, to which an amount of 2.25 H2 arising from a mixture of 25% (TaH3) and 75% (Ta–H) was subtracted. Indeed, H2 needed for hydrogenolysis = H2 arising from deactivation + H2 coming from Ta–hydrides − H2 detected. From ref. 19 (EXAFS) and 28, it was deduced that the tantalum hydrides were a mixture of 25% (TaH3) and 75% (Ta–H) which contributed to H2 release and C–H bond activation for a total amount of 2.25 H2 produced per Ta when a trisalkyl–tantalum complex was formed. | |||
| 1 | 1.1 | 3.85 | 2.7 |
| 5 | 0.7 | 5.2 | 3.65 |
| 10 | 0.6 | 7.9 | 6.25 |
Case of propane. The deconvolution between hydrogenolysis and metathesis was also applied to the case of propane. In general, under 1 bar at 150 °C, propane behaved similarly to ethane with the particularity of showing a sharp and unique initial maximum for the total TOF of hydrogenolysis and metathesis, as well as for the TOF of each reaction (Fig. S2†). IR analysis indicated that the C–H activation of propane was faster than that of ethane (ν(Ta–H) bands disappeared within 30 min) and the deactivation proved to be more rapid. This data explains why no separation of peaks corresponding to these two processes was observed. Therefore, the percentage of metathesis reached a plateau faster, with a value of about 95.5%, slightly lower than in the case of ethane (96.5 to 99.5%). Even with some experimental error, it seems that some hydrogenolysis was occurring during the reaction due to some possible residual deactivation. In fact, in the range of 16–41 h corresponding to the pseudo plateau, the TOF of the pure metathesis of propane decreased 2.5 times faster than in the case of ethane. The propane metathesis maximum TOF appeared to be about 3 times higher than that of ethane with a value of 5.17 mol of propane (mol Ta)−1 h−1, instead of 1.48 mol of ethane (mol Ta)−1 h−1.
Regarding the detected hydrogen per tantalum (Fig. S3-1†), the first peak evolved at room temperature corresponded to an amount (0.29 H2 per Ta) comparable to the case of ethane (0.25 H2 per Ta), The second peak, previously assigned to C–H activation, was smaller because the propane is expected to have been consumed more rapidly by the hydrogenolysis. The amount of hydrogen necessary for the hydrogenolysis reaction grew continuously over time (Fig. S3-2†). This suggests a continuous residual deactivation process supplying this hydrogen throughout the reaction. After 41 h, the hydrogen coming from the deactivation process was estimated to be 8.35 H2 per Ta (Fig. S3-2†: 10 H2 per Ta needed for hydrogenolysis + 0.6 H2 per Ta detected − 2.25 H2 per Ta coming from Ta-hydrides). By comparison with the value obtained in similar conditions with ethane (2.7 H2 per Ta), this amount of hydrogen indicated a stronger deactivation in the case of propane.
II Effect of reaction conditions on the deactivation of the catalyst
 | ||
| Fig. 6 Comparison of alkane metathesis catalyzed at 150 °C by [(SiO)2Ta–H]/MCM-41, 2, and performed under batch (empty symbols, P = 0.8 bar) or dynamic conditions (full symbols, 3 Nml min−1, 1 bar) for ethane (▼, ▽) or propane (■, □). | ||
SiO)2Ta–H]/SiO2, 1, during a series of catalytic runs of propane metathesis performed on the same catalyst in a batch reactor (Fig. 7). After each run performed at 150 °C, the catalyst was treated under hydrogen at 150 °C for 15 h, in order to hydrogenolyse the hydrocarbyl species which could have formed on the surface. Indeed, during such a treatment, an evolution of methane was observed.
 | ||
| Fig. 7 Propane metathesis catalyzed by [(SiO)2Ta–H]/SiO2, 1, in a batch reactor (P = 0.8 bar, T = 150 °C): evolution of the TON versus time, obtained during a series of alternate run and regeneration processes (PH2 = 0.8 bar, T = 150 °C, t = 15 h); run 5 was performed after a regeneration time of 36 h. | ||
It turns out that after each regeneration treatment under hydrogen, the catalytic activity was partially restored but a decrease in TON of about 15% was observed; however, a prolonged treatment under hydrogen (run 5) resulted in a better activity recovery. An average of 1.6 ± 0.3 mol CH4 per mol Ta was evolved at each regeneration and 2.9 mol after 36 h. The deactivation of the catalyst can have different origins: formation of unsaturated tantalum species and/or blocking of active sites by coke or polymers, as reported for different supported olefin metathesis catalysts. Two approaches were used to elucidate this point. The first one was to study at a molecular level the evolution of the surface species during the metathesis reaction by infra-red and solid state NMR spectroscopy. The second one consisted of the determination of the nature of hydrocarbyl–tantalum species by hydrolysis of the catalyst at different reaction times.
III Study of the evolution of surface species during the metathesis reaction
SiO)2Ta–H] supported both on silica or MCM-41 was monitored by IR spectroscopy during the metathesis performed at 150 °C in a batch reactor. Several spectra were recorded at various reaction times. At the beginning of the reaction, the ν(Ta–H) bands centred at 1830 cm−1 decreased rapidly, but again the reactivity of tantalum hydride slowed down over time as observed in the case of methane. The curves differed slightly according to the support but showed the same trend (Fig. 8). Different behaviour for the species supported on Aerosil and MCM-41 was also mentioned previously in the case of zirconium.32 In parallel, ν(C–H) and δ(C–H) vibration modes corresponding to alkyl groups increased progressively to reach a plateau of intensity in the same period of time (Fig. S5†). More precisely, the ν(C–H) bands at wavenumbers of 2956, 2905, 2864, and 2815 cm−1 were assigned to νas(CH3), νas(CH2), νs(CH3), and νs(CH2) vibration modes. Concerning δ(CH) bands, mainly two peaks at wavenumbers of 1466 cm−1, corresponding to δas(CH3) and δs(CH2), and 1364 cm−1 corresponding to δs(CH3) were observed. These bands showed no significant evolution after 5–6 hours, which means that the IR technique did not prove sensitive enough to perceive any change in the surface species.
 | ||
| Fig. 8 Evolution of the intensity of ν(Ta–H) bands versus time during the activation at 150 °C of methane (■), ethane (▲, △) and propane (◆, ◇) (PCnH2n+2 = 0.8 bar), on tantalum hydride supported on MCM-41 (full symbols) or Aerosil silica (empty symbols). | ||
SiO)2Ta–H] in the same direction.
As observed with ethane, ν(C–H) and δ(C–H) bands appeared progressively, the intensities of which rapidly reached a plateau. They correspond to wavenumbers situated at 2962, 2938, 2911 and 2873 cm−1, and 1463 and 1369 cm−1, somewhat similar to those obtained with ethane (Fig. S6†).
SiO)2Ta–H]/SiO2, 1.
 | ||
| Fig. 9 Distribution of hydrocarbons liberated by hydrolysis of the catalyst at different reaction times during ethane (1) or propane (2) metathesis performed at 150 °C on [(SiO)2Ta–H]/SiO2, 1, in batch conditions (0.8 bar). | ||
The results obtained in Fig. 9 show that in each case, the main gas liberated by hydrolysis was the reagent ethane or propane, representing around 65 and 45% respectively; a certain quantity of methane was also present. A significant amount of neopentane was also released at any reaction time, around 25%, suggesting that some low-reactive tantalum centres bearing neopentyl or neopentylidene groups have not undergone hydrogenolysis during the preparation of the hydride from the tantalum–hydrocarbyl precursor. The other compounds correspond to the products of metathesis and appear in weaker amounts in both cases (total 6–15%). After a period of 48 h, some olefins were detected.
After a short reaction time, the amount of alkanes evolved ranged between 1.4 to 1.8 mol per Ta, depending on the precise reaction time, the reagent or the temperature, whereas hydrogen varied between 0.4 to 0.6 mol per Ta (Fig. 10). These values decreased during the reaction time to stabilize below unity for the alkanes and close to zero for hydrogen when the reaction was conducted at 150 °C; this indicates that non hydrolysable species were growing on some tantalum sites which were poisoned. Moreover, the curves decreased more rapidly in the case of propane (Fig. 10-2) compared to ethane, showing a stronger deactivation. Similarly, the curve decrease was quicker for ethane metathesis conducted at 200 °C versus 150 °C, again in relation with a faster deactivation. Interestingly, the curves tend to extrapolate to a value of two for alkanes and one for hydrogen at reaction time zero; this would correspond to an average formula [(SiO)2Ta(H)(R)2] which may be looked at as the precursor of the active form of the catalyst, the alkyl–alkylidene tantalum species [(SiO)2Ta(CH–R′)(R)].8 If we consider that the remaining active Ta species keep the same structure, it can be deduced that 50 to 65% of tantalum sites and probably the most active ones were poisoned after about 50 h at 150 °C. Some remaining neopentyl groups were also displaced from tantalum during the metathesis reaction since the total amount of alkanes evolved decreased with time and the proportion of neopentane stayed rather constant (Fig. 9).
 | ||
| Fig. 10 Number of mol of alkanes and hydrogen per Ta, liberated by hydrolysis of surface species at various reaction times of alkane metathesis performed in batch: ■, □ alkanes; ◆, ◇ hydrogen: (1) metathesis of ethane on [(SiO)2Ta–H]/SiO2, 1, at 150 °C (full symbols), or [(SiO)2Ta–H]/MCM-41, 2, at 200 °C (empty symbols); (2) metathesis of propane on [(SiO)2Ta–H]/SiO2, 1, at 150 °C. | ||
In order to get further information, the deuterolysis of these surface species in the case of propane was performed using CD3OD. The products were analyzed by GC–MS and the same distribution of alkanes as in the case of water (Fig. 9) was obtained with various deuteration degrees and a proportion of isotopomers slightly changing with reaction time. In a global observation, d0 and d1 alkanes tended to decrease with reaction time, from around 40 to 20% and 55 to 40%, respectively. Conversely, d2 and d3 alkanes tended to increase from 8 to 25% and 5 to 15%, respectively. The presence of d0 alkanes can be explained by the occurrence of α-H elimination processes between alkyl ligands,15 whereas that of d2 and d3 alkanes suggests the formation of alkylidene and unexpected alkylidyne tantalum species.
Furthermore, the formation of unsaturated products proved higher at 200 °C under static conditions than at 150 °C, as the NMR spectra showed better resolved peaks, particularly at 110 and 120 ppm (Fig. S8†). Elemental analysis confirmed a higher amount of deposited carbon with 7.3 C per Ta at 200 °C instead of 4.8 C per Ta at 150 °C. This is also in agreement with the stronger deactivation observed in catalysis at higher temperatures (Fig. S4†).
In the same way, a 13C NMR spectrum recorded at the end of propane metathesis (Fig. S9†) performed at 200 °C and 1 bar showed similarly, two series of peaks around 20 ppm and 110–130 ppm with a high intensity. The elemental analysis of carbon also indicated a higher accumulation of carbonaceous deposit in the case of propane compared to ethane with a ratio C/Ta = 8.8 versus 7.3 for ethane.
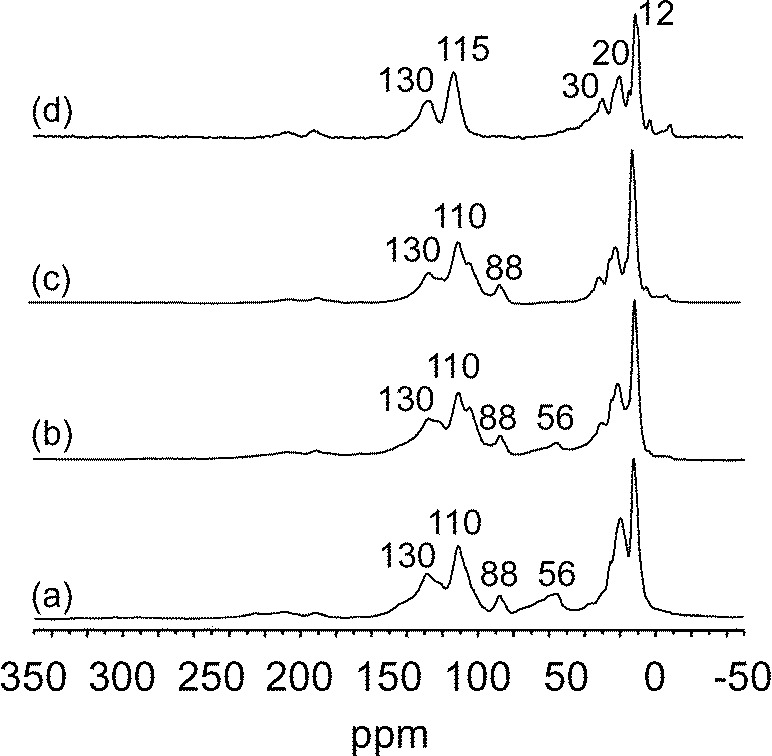
SiO)2Ta–H]/MCM-41, 2, at 200 °C under 0.8 bar during 30 min, 2 h and 50 h (Fig. 11). The 13C CP MAS NMR spectrum after 30 min of reaction presented five main peaks centred at 9, 20, 33, 56 and 65 ppm with shoulders at 75 and 88 ppm. As observed in the case of methane, two weak peaks were present at 220 and 305 ppm, which can be assigned respectively to carbene and carbyne species.36 With increasing reaction time, the spectrum evolved significantly; in particular the broad peak centred at 60 ppm (corresponding reasonably to tantalum–alkyl species) decreased notably for the benefit of new peaks at 110 and 130 ppm which increased (Fig. 11b). After 50 h (Fig. 11c), the spectrum obtained was fairly similar to that found with non-labelled ethane (Fig. S7†) with peaks corresponding to methyl groups (12–20 ppm) and unsaturated species (110–130 ppm). The peak at 130 ppm corresponds to a range of aromatic species. The peak at 110 ppm was previously observed when tantalum hydrides interacted with cyclopentane leading to tantalum–cyclopentadienyl species.28,37
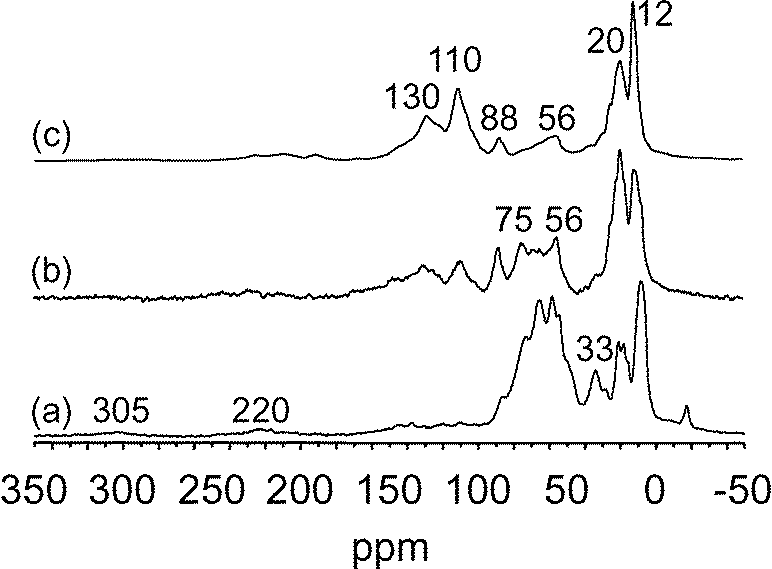 | ||
| Fig. 11
13C CP MAS NMR spectra of surface species obtained after metathesis of 13C bi-labelled ethane (0.8 bar) on [(SiO)2Ta–H]/MCM-41, 2, at 200 °C in batch conditions, during 30 min (a); 2 h (b); 50 h (c). | ||
In order to establish a parallel with the hydrolysis experiments (vide supra), the last sample (Fig. 11c) was treated with a vapour of acetic acid and the corresponding NMR spectrum was recorded (Fig. 12). It appears that the peaks at 110–130 ppm were not much affected by this treatment; only the peaks at 12–20 ppm decreased comparatively and the small peaks between 50 and 100 ppm disappeared. The former species (110–130 ppm) then appeared strongly bonded to tantalum and capable of withstanding hydrolysis; reasonably, they should be responsible for the catalyst deactivation during alkane metathesis. On the contrary, the other peaks which disappeared would correspond to species affording the liberation of hydrocarbons during hydrolysis (Fig. 9 and 10). Indeed, the treatment with acetic acid liberated 0.34 Cn per Ta (0.3 Cn per Ta in the case of H2O) corresponding to 0.57 equiv. C1 per Ta (0.6 equiv. C1 per Ta in the case of H2O); the distribution of alkanes and alkenes was comparable to that obtained with water vapour.
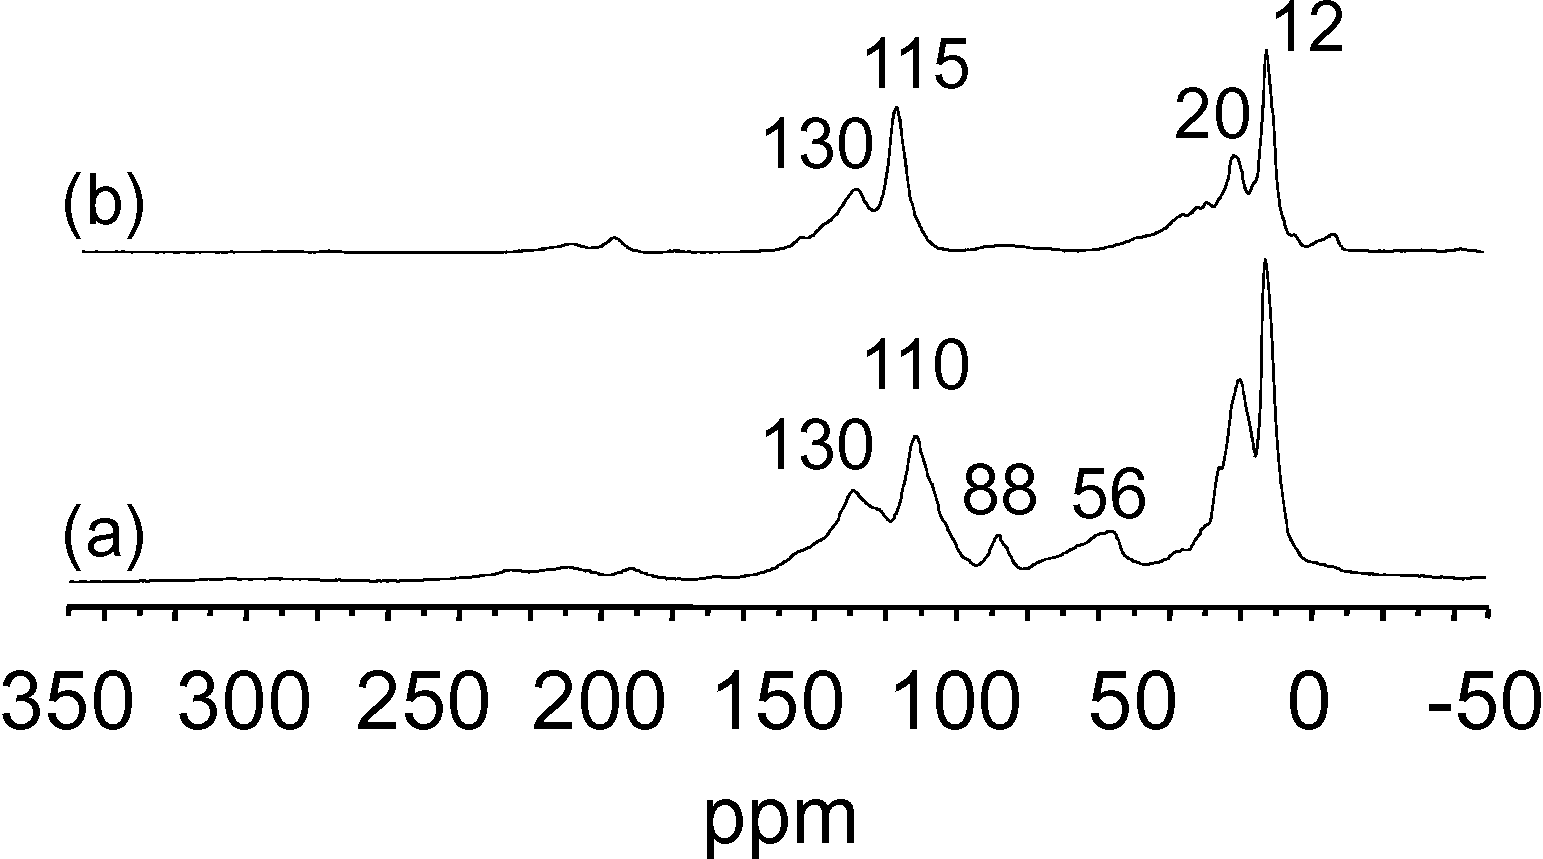 | ||
| Fig. 12
13C CP MAS NMR spectra of surface species obtained after metathesis of 13C bi-labelled ethane (0.8 bar) on [(SiO)2Ta–H]/MCM-41, 2, at 200 °C in batch conditions, 50 h (a); then treatment of (a) under a vapour of acetic acid (b). | ||
In order to investigate the possibility of regeneration of the catalyst, the surface species also underwent treatment under H2 at 150 and 200 °C for various periods of time (Fig. 13). The treatment at 150 °C for 15 h did not modify the NMR spectrum significantly (Fig. 13b); however some alkanes were evolved in the gas phase (0.62 C1, 0.33 C2, 0.11 C3 per Ta or 1.61 equiv. C1 per Ta). After 15 h at 200 °C, only the peak at 50 ppm disappeared and, if the treatment was prolonged for 24 h more, the peaks became thinner but remained at 12, 22, 30, 115 and 130 ppm. At the end, a mixture of C1 to C3 alkanes (corresponding to 3.6 total equiv. C1 per Ta) was liberated in the gas phase, whereas 1.9 C per Ta remained on the solid according to elemental analysis. It is interesting to note that the treatment under hydrogen at 150 °C and 200 °C allows the elimination of more carbon (3.6 total equiv. C1 per Ta) from the surface than the hydrolysis (0.6 total equiv. C1 per Ta with water or acetic acid). This is a reason why a partial regeneration could be achieved as observed above (Fig. 7). It is likely that hydrolysis only cleaves the Ta–C bonds of Ta–alkyl and Ta–alkylidene species, while hydrogenolysis should be able to also cleave the C–C bonds of the strongly bonded species. It is surprising that the presence of part of the peaks at 12, 22 and 30 ppm assigned to methyl or methylene groups indicates resistance to the treatment by acetic acid or by hydrogenolysis at 200 °C. These peaks seem to be associated with those at 115 and 130 ppm, which also remained after these treatments. These various peaks could correspond to strongly bonded cyclic or linear olefinic species (115 and 130 ppm) with possible alkyl substituent (12, 22 and 30 ppm); particularly, tantalum–cyclopentadienyl species giving a peak at 115 ppm were seen to totally poison the catalyst during the hydrogenolysis of cycloalkanes.37
 | ||
| Fig. 13
13C CP MAS NMR spectra of surface species obtained after metathesis of 13C bi-labelled ethane (0.8 bar) on [(SiO)2Ta–H]/MCM-41, 2, at 200 °C in batch conditions, 50 h (a); treatment of (a) under 0.8 bar of H2 at 150 °C, 15 h (b); treatment of (b) under 0.8 bar of H2 at 200 °C, 15 h (c); treatment of (c) under 0.8 bar of H2 at 200 °C, 24 h (d). | ||
In summary, the evolution of the catalyst during the alkane metathesis reaction was studied using the harsher conditions which favoured the deactivation, that is in a batch reactor and at higher temperatures. The deactivation proved moderate under dynamic conditions and mild temperature. IR spectroscopy allowed us to follow the evolution of the tantalum hydride at the beginning of the reaction but did not yield precise information on the nature of the resulting surface species. The hydrolysis of surface species at different times of reaction revealed the presence of a Ta–hydrocarbyl species likely related to the metathesis catalytic process itself, whereas 13C NMR showed the strongly bonded surface species to be responsible for the deactivation of the catalyst.
Conclusion
The origin of the deactivation of the catalyst during the metathesis reaction of ethane and propane under static and dynamic conditions was discussed. In the early stages of the reaction, a dehydrogenation of the hydrocarbyl surface species was shown to take place leading to the formation of an unsaturated poisoning carbonaceous deposit. In parallel, the hydrogen produced by this process led to an alkane hydrogenolysis side-reaction, which became rapidly limited in the time. Studies are in progress to improve the reaction conditions as well as the catalyst formulation in order to avoid the occurrence of such deactivation.Experimental section
General procedures
All experiments regarding the handling of air sensitive compounds were carried out under a dry argon atmosphere using standard Schlenk and glove-box techniques. For the synthesis and treatment of the surface species, high-vacuum lines (1.34 Pa) and glove-box techniques were used. Diethyl ether and pentane were used directly from the solvent dispenser mBRAUN MB SPS-800. All gaseous alkanes and hydrogen (N25, Air Liquide) were purified over freshly regenerated X-11 BASF catalyst/molecular sieves (4 Å) prior to use. [Ta(CHtBu)(CH2tBu)3] was prepared as described in the literature.19 [(SiO)2Ta–H]/SiO2, 1,6 and [(SiO)2Ta–H]/MCM-41, 2,19 were prepared as reported previously.
Elemental analyses were performed at the University of Bourgogne in Dijon for carbon, and at the Service Central d'Analyse in Solaize (France) for tantalum.
Transmission IR spectra were recorded on a Nicolet 5700 FT-IR spectrometer, using an airtight glass cell equipped with CaF2 windows.
1H MAS and 13C CP-MAS solid-state NMR spectra were recorded on a Bruker Avance-500 spectrometer with a conventional double-resonance 4 mm CP-MAS probe at the Laboratoire de Chimie Organométallique de Surface in Ecole Supérieure de Chimie Physique Electronique de Lyon (ESCPE). The samples were introduced under argon in a glove-box into a 4 mm zirconia rotor, which was then tightly closed. The spinning frequency was set to 10 kHz for all the experiments reported herein. Chemical shifts were given with respect to TMS as the external reference for the 1H and 13C-NMR. The 13C CP NMR spectra were recorded under proton decoupling TPPM-15. The contact time for CP was 2 ms. An exponential line broadening of 50 Hz was applied before Fourier transformation.
Monitoring of the metathesis reaction in an infrared cell
Silica or MCM-41 (50 mg) were pressed into a 17 mm self-supporting disk and put into the IR glass cell, then treated at 500 °C under vacuum (1.34 Pa) for 15 h. The [Ta(CHtBu)(CH2tBu)3] complex was sublimed at 80 °C onto the silica disk; the excess of physisorbed complex was removed by a reverse sublimation at 80 °C and trapped in liquid nitrogen. After evacuation of argon, dry hydrogen (80 kPa) was introduced into the cell and the disk was heated at 150 °C to form the supported tantalum hydride. After evacuation of the gas phase, ethane or propane was introduced (0.8 bar) through a molecular sieve and deoxo-catalyst trap and the cell was heated to 150 °C. From time to time, the cell was cooled and the gas phase trapped in liquid nitrogen in order to record IR spectra. In parallel, the gas phase was analyzed by expanding aliquots in a small volume for injection in GC. Alkanes were titrated on a Hewlett-Packard 5890 series II gas chromatograph equipped with a flame ionization detector and an Al2O3–KCl on fused silica column (50 m × 0.32 mm).
Metathesis of alkanes in a batch reactor
[(SiO)2Ta–H]/SiO2, 1, (300 mg; 5.95 wt% Ta) or [(SiO)2Ta–H]/MCM-41, 2, (150 mg; 11.7 wt% Ta) were charged within a glove-box into a glass reactor (500 ml). After evacuation of argon, the reactor was filled again with ethane or propane (0.8 bar) through a molecular sieve and deoxo-catalyst trap then heated to 150 °C in an oven. The reaction products were analyzed periodically by GC as was done from the IR cell.
Monitoring of the surface species by hydrolysis after alkane metathesis
The catalyst was introduced into a batch reactor as described above and the metathesis reaction run for a given time. After stopping, the gas phase of the reactor was evacuated and a vapor of water (18 Torr) was introduced. Alkanes were analyzed as above and hydrogen on an Intersmat IGC 120MB gas chromatograph equipped with a katharometer detector and a filled molecular sieves column (3 m × 3.2 mm).Metathesis of alkanes in a continuous flow reactor
[(SiO)2Ta–H]/MCM-41, 2, (250 mg; 11.7 wt% Ta) was charged within a glove-box into a stainless steel 0.5 inch diameter continuous flow reactor fitted with a four-channels isolating valve. After connection to the rack, all the tubing was purged under a flow (3 ml min−1) of the desired alkane. The four-channel valve was then switched on and the alkane was sent through the catalytic bed with a flow rate (3 ml min−1) maintained constant using a mass flow controller, then the oven was heated to 150 °C within 50 min. The gas products, alkanes and hydrogen were analyzed on line with a Varian micro-GC CP-4900 using capillary columns (10 m PPU; 6 m 5CB; 10 m Al2) and katharometer detectors.
Acknowledgements
The authors wish to kindly acknowledge ESCPE-Lyon, CNRS, UCB-Lyon and particularly the BP Chemicals Company which supported this work.References
- Activation and Functionalization of Alkanes, ed. C. L. Hill, J. Wiley & Sons, Inc., New York, 1989 Search PubMed.
- R. H. Crabtree, J. Organomet. Chem., 2004, 689, 4083–4091 CrossRef CAS PubMed.
- A. S. Goldman, A. H. Roy, Z. Huang, R. Ahuja, W. Schinski and M. Brookhart, Science, 2006, 312, 257–261 CrossRef CAS PubMed.
- C.-Y. Chen, D. J. O'Rear and S. R. Brundage, Chevron U.S.A. Inc., Patent application, WO2002000578, 2002 Search PubMed.
- M. C. Haibach, S. Kundu, M. Brookhart and A. S. Goldman, Acc. Chem. Res., 2012, 45, 947–958 CrossRef CAS PubMed.
- V. Vidal, A. Theolier, J. Thivolle-Cazat, J. M. Basset and J. Corker, J. Am. Chem. Soc., 1996, 118, 4595–4602 CrossRef CAS.
- V. Vidal, A. Theolier, J. Thivolle-Cazat and J. M. Basset, Science, 1997, 276, 99–102 CrossRef CAS.
- J.-M. Basset, C. Coperet, L. Lefort, B. M. Maunders, O. Maury, E. Le Roux, G. Saggio, S. Soignier, D. Soulivong, G. J. Sunley, M. Taoufik and J. Thivolle-Cazat, J. Am. Chem. Soc., 2005, 127, 8604–8605 CrossRef CAS PubMed.
- J.-M. Basset, C. Coperet, D. Soulivong, M. Taoufik and J. Thivolle-Cazat, Acc. Chem. Res., 2010, 43, 323–334 CrossRef CAS PubMed.
- N. Merle, F. Stoffelbach, M. Taoufik, E. Le Roux, J. Thivolle-Cazat and J.-M. Basset, Chem. Commun., 2009, 2523–2525 RSC.
- A. Garron, F. Stoffelbach, N. Merle, K. C. Szeto, J. Thivolle-Cazat, J.-M. Basset, S. Norsic and M. Taoufik, Catal. Sci. Technol., 2012, 2, 2453–2455 CAS.
- V. Polshettiwar, J. Thivolle-Cazat, M. Taoufik, F. Stoffelbach, S. Norsic and J.-M. Basset, Angew. Chem., Int. Ed., 2011, 50, 2747–2751 CrossRef CAS PubMed.
- O. Maury, L. Lefort, V. Vidal, J. Thivolle-Cazat and J.-M. Basset, Angew. Chem., Int. Ed., 1999, 38, 1952–1955 CrossRef CAS.
- O. Maury, L. Lefort, V. Vidal, J. Thivolle-Cazat and J.-M. Basset, Organometallics, 2010, 29, 6612–6614 CrossRef CAS.
- R. R. Schrock and J. D. Fellmann, J. Am. Chem. Soc., 1978, 100, 3359–3370 CrossRef CAS.
- V. Dufaud, G. P. Niccolai, J. Thivolle-Cazat and J.-M. Basset, J. Am. Chem. Soc., 1995, 117, 4288–4294 CrossRef CAS.
- L. Lefort, M. Chabanas, O. Maury, D. Meunier, C. Copéret, J. Thivolle-Cazat and J.-M. Basset, J. Organomet. Chem., 2000, 593–594, 96–100 CrossRef CAS.
- E. Le Roux, M. Chabanas, A. Baudouin, A. de Mallmann, C. Coperet, E. A. Quadrelli, J. Thivolle-Cazat, J.-M. Basset, W. Lukens, A. Lesage, L. Emsley and G. J. Sunley, J. Am. Chem. Soc., 2004, 126, 13391–13399 CrossRef CAS PubMed.
- S. Soignier, M. Taoufik, E. Le Roux, G. Saggio, C. Dablemont, A. Baudouin, F. Lefebvre, A. De Mallmann, J. Thivolle-Cazat, J.-M. Basset, G. Sunley and B. M. Maunders, Organometallics, 2006, 25, 1569–1577 CrossRef CAS.
- O. Maury, G. Saggio, A. Theolier, M. Taoufik, V. Vidal, J. Thivolle-Cazat and J.-M. Basset, C. R. Acad. Sci., 2000, 3, 583–587 CAS.
- C. Thieuleux, E. A. Quadrelli, J.-M. Basset, J. Doebler and J. Sauer, Chem. Commun., 2004, 1729–1731 RSC.
- M. Taoufik, A. de Mallmann, E. Prouzet, G. Saggio, J. Thivolle-Cazat and J.-M. Basset, Organometallics, 2001, 20, 5518–5521 CrossRef CAS.
- R. Anwander and R. Roesky, J. Chem. Soc., Dalton Trans., 1997, 137–138 RSC.
- R. M. Gauvin, L. Delevoye, R. A. Hassan, J. Keldenich and A. Mortreux, Inorg. Chem., 2007, 46, 1062–1070 CrossRef CAS PubMed.
- F. Blanc, J. Thivolle-Cazat, J.-M. Basset, C. Coperet, A. S. Hock, Z. J. Tonzetich and R. R. Schrock, J. Am. Chem. Soc., 2007, 129, 1044–1045 CrossRef CAS PubMed.
- L. Zhong, M.-Y. Lee, Z. Liu, Y.-J. Wanglee, B. Liu and S. L. Scott, J. Catal., 2012, 293, 1–12 CrossRef CAS PubMed.
- C. A. Demmelmaier, R. E. White, J. A. van Bokhoven and S. L. Scott, J. Catal., 2009, 262, 44–56 CrossRef CAS PubMed.
- G. Saggio, M. Taoufik, J.-M. Basset and J. Thivolle-Cazat, ChemCatChem, 2010, 2, 1594–1598 CrossRef CAS.
- M. Chabanas, V. Vidal, C. Coperet, J. Thivolle-Cazat and J.-M. Basset, Angew. Chem., Int. Ed., 2000, 39, 1962–1965 CrossRef CAS.
- V. Polshettiwar, F. A. Pasha, A. De Mallmann, S. Norsic, J. Thivolle-Cazat and J.-M. Basset, ChemCatChem, 2012, 4, 363–369 CrossRef CAS.
- W. H. Bernskoetter, C. K. Schauer, K. I. Goldberg and M. Brookhart, Science, 2009, 326, 553 CrossRef CAS PubMed and references therein.
- X.-X. Wang, L. Veyre, F. Lefebvre, J. Patarin and J.-M. Basset, Microporous Mesoporous Mater., 2003, 66, 169–179 CrossRef CAS PubMed.
- D. R. Lide, Handbook of Chemistry and Physics, 77th edn, 1997 Search PubMed.
- J.-M. Basset, A. Baudouin, F. Bayard, J.-P. Candy, C. Coperet, A. De Mallmann, G. Godard, E. Kuntz, F. Lefebvre, C. Lucas, S. Norsic, K. Pelzer, A. Quadrelli, C. Santini, D. Soulivong, F. Stoffelbach, M. Taoufik, C. Thieuleux, J. Thivolle-Cazat and L. Veyre, in Modern Surface Organometallic Chemistry, ed. J.-M. Basset, R. Psaro, D. Roberto and R. Ugo, Wiley-VCH Verlag GmbH & Co, Weinheim, 2009, pp. 23–73 Search PubMed.
- V. Vidal, A. Theolier, J. Thivolle-Cazat and J.-M. Basset, J. Chem. Soc., Chem. Commun., 1995, 991–992 RSC.
- D. Soulivong, S. Norsic, M. Taoufik, C. Coperet, J. Thivolle-Cazat, S. Chakka and J.-M. Basset, J. Am. Chem. Soc., 2008, 130, 5044–5045 CrossRef CAS PubMed.
- F. Rataboul, M. Chabanas, A. De Mallmann, C. Copéret, J. Thivolle-Cazat and J.-M. Basset, Eur. J. Chem., 2003, 9, 1426–1434 CrossRef PubMed.
Footnotes |
| † Electronic supplementary information (ESI) available: Graphs, tables, FTIR and NMR spectra and details of calculations. See DOI: 10.1039/c3cy00545c |
| ‡ Present address: KAUST Catalysis Center (KCC), King Abdullah University of Science and Technology, Thuwal, Kingdom of Saudi Arabia |
| This journal is © The Royal Society of Chemistry 2014 |