 Open Access Article
 This Open Access Article is licensed under a
 Creative Commons Attribution 3.0 Unported Licence
Label-free characterization of biomembranes: from structure to dynamics
Alireza
Mashaghi
*a,
Samaneh
Mashaghi
b,
Ilya
Reviakine
cd,
Ron M. A.
Heeren
e,
Vahid
Sandoghdar
f and
Mischa
Bonn
g
aDepartment of Bionanoscience, Kavli Institute of Nanoscience, Delft University of Technology, Lorentzweg 1, 2628 CJ Delft, The Netherlands. E-mail: A.MashaghiTabari@tudelft.nl; Fax: +31 15 27 88780; Tel: +31 15 2788780
bZernike Institute for Advanced Materials, University of Groningen, 9747 AG Groningen, The Netherlands
cInstitute of Functional Interfaces (IFG), Karlsruhe Institute of Technology (KIT), Hermann-von Helmholtz-Platz 1, 76344 Eggenstein-Leopoldshafen, Germany
dFaculty of Engineering, the University of the Basque Country (UPV/EHU) Alameda Urquijo s/n., 48013, Bilbao, Spain
eFOM Institute AMOLF, Science Park 104, 1098 XG Amsterdam, The Netherlands
fMax Planck Institute for the Science of Light, D-91058 Erlangen, Germany
gMax Planck Institute for Polymer Research, Ackermannweg 10, D-55128 Mainz, Germany
First published on 20th November 2013
Abstract
We review recent progress in the study of the structure and dynamics of phospholipid membranes and associated proteins, using novel label-free analytical tools. We describe these techniques and illustrate them with examples highlighting current capabilities and limitations. Recent advances in applying such techniques to biological and model membranes for biophysical studies and biosensing applications are presented, and future prospects are discussed.
1. Introduction
Cell membranes are involved in mechanical, electrical, signalling and transport processes in cells and are the single barrier separating the intracellular environment from the extracellular space. Understanding the chemical composition, structure and dynamics of membranes is of utmost importance to biology, medicine and technology.1–5 To this end, a myriad of techniques have been developed over the years. Among these, methods based on fluorescently labelling membrane proteins and lipids such as fluorescence microscopy, fluorescence recovery after photobleaching (FRAP) and fluorescence resonant energy transfer (FRET) have been particularly instrumental in advancing our understanding of membrane processes. However, labelling phospholipids leads to significant changes in their molecular shape and physicochemical properties, which may influence lipid spatial distribution, lipid dynamics, and functioning of the membrane. Furthermore, for in vivo medical applications, it would be advantageous to use label-free methods to study membrane properties. Hence efforts along several research avenues have been made to investigate membrane lipids and associated proteins in their native states, i.e. without labelling them. Recent methodological developments have originated from various disciplines of physics, analytical chemistry, optics, nanotechnology and applied mathematics. In particular, the development of laser technology, sensitive detection methods and novel metal nanostructures now permits for sensitive detection of phospholipid structures at high spatial (sub-micron) and temporal (picosecond) resolution. Here, we review the state-of-the-art label-free membrane characterization techniques. We discuss the strengths and limitations of each approach in resolving the structure and dynamics of engineered model membranes, native biomembranes and other lipid assemblies in vitro and in vivo.2. Mass spectrometry
The development of electrospray ionization (ESI)6 and matrix assisted laser desorption-ionization (MALDI)7 in the 1980s has enabled mass spectrometric analysis of large intact biomolecules such as membrane lipids (seeBox 1 for the working principles). Smaller biomolecular species can be directly identified by high-resolution accurate mass analysis, whereas more complex species require structural elucidation using a tandem mass spectrometry strategy. Tandem MS involves gas-phase isolation of a precursor ion followed by the generation of structure elucidating fragments through controlled dissociation. Most mass spectrometric studies focus on the analysis of biomolecular extracts from cells and tissue. Good examples are the shotgun lipidomics studies by Shevchenko et al.8 However, mass spectrometry has evolved beyond the analysis of extracts as a direct surface imaging tool (see Fig. 1) that enables the direct, label-free characterization of biomolecules in thin tissue sections and supported membranes.9 The resolution of imaging mass spectrometry depends upon the image generation method, microprobe or microscope,10 and the desorption and ionization technique used. When a laser is used to desorb and ionize molecules from a sample surface, the lateral resolution is theoretically limited to the optical diffraction limit. However, by reducing the spot size and approaching the diffraction limit, the amount of generated ions decreases and the sensitivity limits the practical lateral resolution; therefore typically a spot size >10 microns is used to generate a sufficient number of ions for molecular imaging in the microprobe mode. Another type of imaging mass spectrometry relies on the use of an energetic primary ion beam that ablates the sample surface and generates secondary ions, the so-called secondary ion mass spectrometry (SIMS) analysis. Much higher (sub-micrometer) lateral resolution can be achieved with SIMS as compared to common laser ablation-based methods.11
Box 1. Mass spectrometryMass spectrometry is an analytical research method that allows the structural analysis and identification of molecules based on their molecular weight in a label-free manner. It is a powerful technique that is used to identify unknown compounds, to quantify known materials, and to elucidate the structure and chemical properties of molecules. It generally involves a three-step process of ionization, mass separation and detection. The ionization step is required to ensure that electric or magnetic fields can be employed to separate the species of interest using physical forces. These forces are in turn employed in a mass spectrometer to mass separate ions generally by taking advantage of the mass dependent differences in velocity the ions attain after acceleration to the same kinetic energy. This is particularly so for time-of-flight mass spectrometers in which ions travel a fixed distance but with mass dependent differentiating velocities. Some mass spectrometers employ spatial separation of different masses by exclusively using electrical or magnetic forces to allow one specific mass to travel from the source to the detector. These are the mass filters such as quadrupole instruments or magnetic sector analyzers. Modern mass spectrometers are often hybrid instruments that aim at improved throughput and sensitivity by storing and mass separating ions in ion traps to ensure no ions get lost for detection. The analysis of lipid membranes requires ionization techniques that are capable of desorption and ionization of lipid moieties from membrane surfaces. These techniques can be particle-based or photon-based. The particle-based techniques typically employ a charged particle that is accelerated to the membrane surface. Secondary ions are released upon impact of the primary particle and are subsequently analyzed by a mass spectrometer. This approach is commonly referred to as secondary ion mass spectrometry (SIMS). The photon-based approaches involve the irradiation of the membrane with a laser beam that imparts sufficient internal energy into the surface such that it results in the ablation and ionization of surface lipids. An energy-absorbing matrix is employed to ameliorate the internal energy imparted in the lipid molecules that would result in extensive fragmentation. This approach is referred to as matrix assisted laser desorption and ionization (MALDI). SIMS is extremely surface sensitive whereas MALDI probes the matrix crystals added to a surface at substantial depth. SIMS is more energetic and particularly suitable for lipids and small molecules. MALDI is typically used for less abundant lipids and peptides and proteins due to its higher sensitivity compared to SIMS. The usefulness of both methods is crucially dependent on the preparation of proper sample surfaces.Both SIMS and MALDI are suitable to generate molecular images of lipid distribution of complex surfaces. The ionization beams are microfocused such that local information is probed from a single spot. After successive analysis of multiple spots across a surface an image can be constructed. This is often referred to as the microprobe mode of analysis. The spatial resolution is governed by the focusability of the ionizing beams. This can be as small as 50 nm for SIMS and 5 micrometers for MALDI and is largely determined by the sensitivity of detection. |
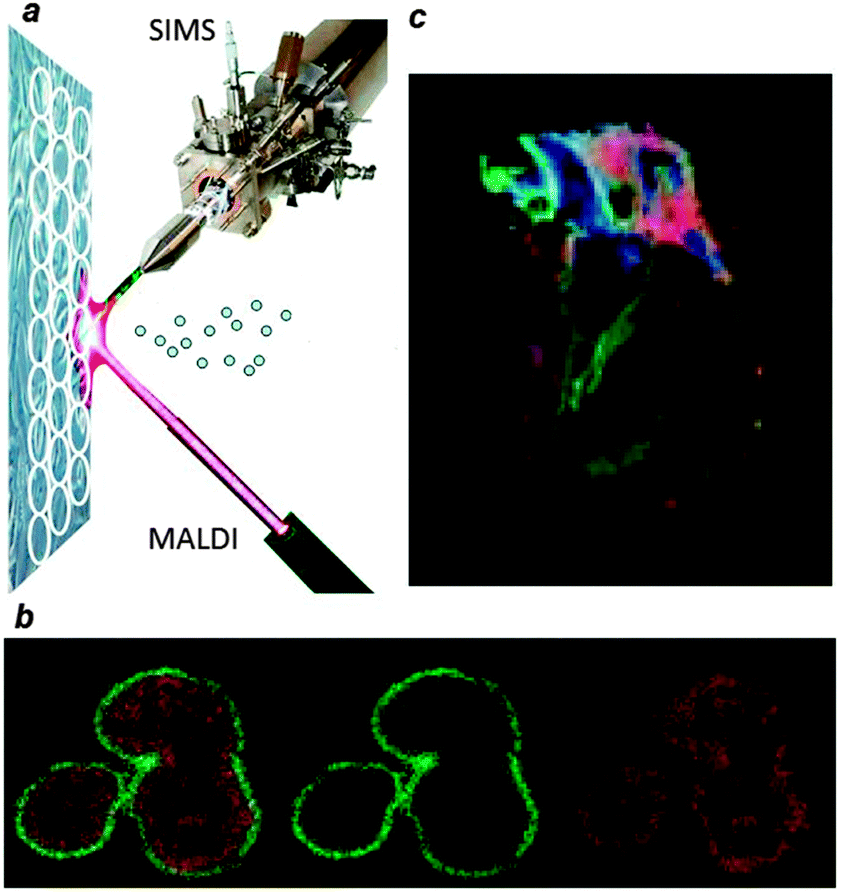 | ||
| Fig. 1 (a) A schematic overview of multimodal imaging mass spectrometry. Two desorption and ionization techniques, SIMS and MALDI, are alternately used to probe a small area on a surface, indicated with a circle. Ions generated from each position are mass analyzed and result in a set of complex, complementary spectra. The spatial resolution of SIMS allows for the analysis of the lipid composition of individual, single neuroblastoma cells (b) whereas MALDI enables the lipid exploration of larger surfaces such as the heart tissue section depicted in (c). | ||
2.1. Secondary ion mass spectrometry
SIMS analysis of biological samples can be conducted using pulsed or continuous primary ion beams. The secondary ions can be detected either by a time-of-flight (ToF) mass spectrometer (so-called ToF-SIMS) or by using a magnetic sector mass spectrometer. ToF-SIMS in the static mode is the most commonly used approach for SIMS analysis of lipid membranes. Recently SIMS has also been combined with a Fourier transform ion cyclotron resonance mass spectrometer (FT-ICR-MS) to take advantage of mass spectral resolving powers upwards of 200![[thin space (1/6-em)]](https://www.rsc.org/images/entities/char_2009.gif) 00012 in an m/z range up to 2000 Da. ToF-SIMS has a typical resolving power of 15000 but an m/z range that extends well above 15 kDa.
00012 in an m/z range up to 2000 Da. ToF-SIMS has a typical resolving power of 15000 but an m/z range that extends well above 15 kDa.
The main challenges of ToF-SIMS analysis of biological membranes are the sensitivity, spatial resolution, specificity, and quantification. There is a trade-off between specificity and spatial resolution: larger lipid fragments often exhibit a lower yield, leading to poorer signal-to-noise ratios, so that ultimately a larger area must be illuminated. Multiple strategies have been proposed to overcome this challenge, including the use of polyatomic primary ion sources, such as C60+ or Arn+ (n > 100) based primary ion columns. Under optimized conditions,13 ToF SIMS imaging of specific unlabelled lipid fragments is possible with sub-100 nm lateral resolution using 80 keV Bi3+ as the primary ion source which provides a better focusing capability.
Efforts aimed at quantifying the composition of phospholipid membranes by ToF SIMS have had limited success. The challenge lies in the fact that the yield of lipid species depends on the molecular environment, lipid packing density and the structure of the lipid assembly. For example, lipids in a bilayer organization show a strong (5–10 times) enhancement in the yield as compared to amorphous lipid samples. These issues can be only partly resolved if one corrects the signals based on sensitivity factors measured on calibration samples or the use of isotope-labelled internal standards.
Another major challenge has been to prepare a supported lipid bilayer and preserve its structure during the analysis. Winograd and coworkers14,15 have studied phosphatidylethanolamine (PE) induced domain formation in a phosphatidylcholine/phosphatidylethanolamine/cholesterol (PC/PE/Chol) model membrane. In this study Langmuir–Blodgett lipid monolayers were deposited onto self-assembled monolayers of alkane thiols on gold. The appearance of cholesterol-rich domains was then studied using ToF-SIMS and atomic force microscopy (AFM). Boxer and co-workers have developed16,17 a method by which supported phospholipid bilayers were freeze-dried while their integrity was preserved. The samples were then studied successfully by dynamic SIMS elemental analysis at the nanoscale, a technique which allows for high resolution SIMS imaging. In 2007, Fredrik Hook et al. performed a systematic study of various preparation protocols: freeze-dried supported phosphatidylcholine (POPC) bilayers, Langmuir–Blodgett (LB) POPC monolayers, and disordered thick POPC films were investigated.18 They found that the results obtained for LB monolayers and supported bilayers (SPBs) differ from those obtained for disordered lipid films, indicating that the bilayer structure is at least partly retained in vacuum.
SIMS has been used to probe the lipid composition of cellular membranes. Several interesting studies reported on the unique lipid composition at the plasma membrane sites of fusion between Tetrahymena cells19,20 and of the plasma membrane of fibroblasts.21 These studies provide a unique opportunity to analyse the local composition of the membranes and correlate composition with biological function. Further success in this direction came from the application of principal component analysis to discriminate between the ToF-SIMS spectra of four unlabelled phosphatidylcholines (DLPC, DMPC, DPPC, DSPC) and to visualize the distributions of each phospholipid species with significantly higher specificity and contrast than that of individual TOF-SIMS ion images.22
One important challenge in the field is depth profiling of a phospholipid bilayer and characterizing the composition of each leaflet. This is important because biological membranes have asymmetric lipid distribution and the establishment and maintenance of the asymmetry is vital for a variety of membrane processes. Depth resolution is a key factor to assess molecular depth profiling and 3D mass spectrometric imaging.23 The use of polyatomic primary ions has led to a significant reduction of subsurface damage,24 which improves the relevance of depth profiling studies as well as the useful depth resolution.
In summary, SIMS can be employed to study detailed lipid identities and distributions in three dimensions with submicron resolution on cellular and synthetic systems. The combination of shallow depth profiling and molecular imaging offers detailed insight into static membrane structures.
2.2. MALDI-MSI
The low yield of intact lipid species and the presence of extensive fragment peaks are among the drawbacks of SIMS. They can be overcome by the use of matrix-assisted laser desorption/ionization (MALDI) MS. MALDI-MS provides a more gentle ionization approach compared to SIMS as the matrix containing the sample absorbs UV laser light, leading to the ablation of the upper layer (∼micron) of the matrix material and a reduced number of fragmentation-related peaks. Subsequent protonation or deprotonation of biomolecules allows for the detection of more intact biomolecules. As such, MALDI-MS has allowed for the detailed structural investigation of a wide variety of lipid classes. Lipid analysis with MALDI-MS has been shown to produce lipid and metabolite signals directly from various tissue sections. Optimization of the matrix has been shown to allow for direct cell typing in various diseases based on lipid profiling.As in all molecular imaging techniques discussed in this review, the highest obtainable spatial resolution is a key issue. Cellular resolution (<5 micrometers), without compromising the original spatial distributions of the molecules of interest, has been obtained by a number of groups.25,26 The MALDI matrix crystals that are typically applied to the analyzed surface must have dimensions smaller than the finest spatial detail to be observed. New matrices such as 9 aminoacridine (9-AA) are often used to investigate lipid distributions in both positive and negative ion modes. The use of similar matrices in SIMS can be employed to enhance the molecular ion signal. This approach is called matrix enhanced SIMS (Fig. 1). In all cases, great care must be taken in the sample preparation to not perturb the endogenous distribution before imaging.
Several innovative high-resolution MALDI-MSI approaches have been developed that employ high mass resolution and accurate mass analysis for lipid imaging on single cells.27 Numerous compounds including small metabolites such as adenine, guanine, and cholesterol as well as different lipid classes such as phosphatidylcholine, sphingomyelin, diglycerides, and triglycerides were detected and identified based on high resolution. High mass resolution spectra were acquired with an Orbitrap mass spectrometer from an individual spot of 7 micrometers in diameter on a HeLa cell. These measurements provide molecularly specific images of larger metabolites (phospholipids) in native single cells. The combination of surface sensitive SIMS and MALDI-MSI is being developed as a multimodal imaging approach that offers complementary molecular imaging and spatial detail.
3. Quartz crystal microbalance
Mass spectrometry provides excellent spatially resolved molecular identification capabilities. It is, however, not the ideal technique to study mesoscopic (dynamic) rearrangements of lipid structures, which occur, for example, when vesicles transform into bilayers supported on solid surfaces.28 It is similarly difficult to follow such reorganization of the lipid material at an interface by optical mass-sensitive techniques such as surface plasmon resonance (SPR) or ellipsometry.29 Quartz crystal microbalance, or QCM, is ideally suited for the task of monitoring such reorganizations selectively and sensitively (Fig. 2). QCM consists of a piezoelectric quartz crystal disc with electrodes coated on its faces. An oscillating electric field is applied to the electrodes that causes the crystal to vibrate. Crystals used in QCM vibrate in a thickness-shear mode. Because shear waves decay very rapidly, QCM is surface sensitive.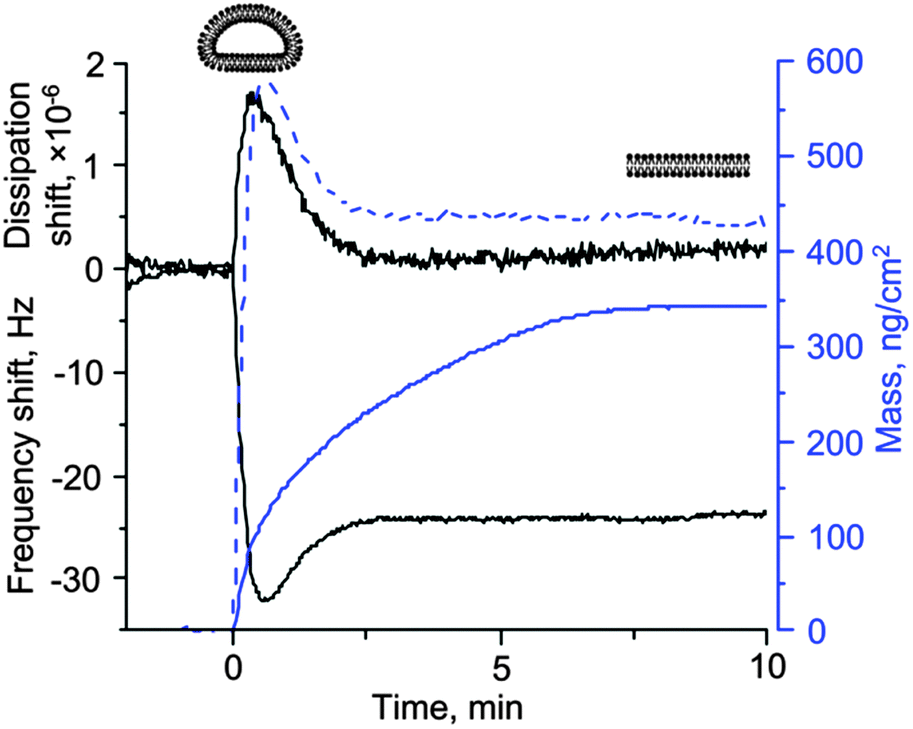 | ||
| Fig. 2 Bilayer formation from sonicated dioleoyl choline liposomes on silica is monitored by optical (ellipsometry) and acoustic (quartz crystal microbalance) techniques. For QCM, the raw data (frequency and dissipation shifts, black solid lines) are plotted as well as the mass derived from the frequency shift using the Sauerbrey relationship30 (m = 18.1 Δf, where Δf is the frequency shift in Hz, dashed blue line). For ellipsometry, the optical mass is plotted directly (solid blue line). There is a very clear difference between the two responses. While QCM data contain the extrema in the signals (frequency and dissipation), first identified by Keller and Kasemo,34 the optical response simply shows a continuous increase in the mass of the lipids present on the surface and is not able to distinguish between adsorbed liposomes and bilayers (diagrams shown above the curves). Note also that the final mass obtained by the two techniques is not the same. This could be due to the residual liposomes associated with the bilayer or imprecise assumptions used in the calculation of the optical mass from the raw ellipsometric data. For the QCM signals, the data on the 5th overtone, scaled by the overtone order, are plotted. Credits: the data were obtained using a combined QCM-D–Ellipsometry instrument based on the M2000 V spectroscopic ellipsometer from Woollam, Inc. (NE, U.S.A.) and Q-Sense E1 system (Biolin Scientific AB, Västra Frölunda, Sweden) equipped with an open module with a home-made trapezoidal glass cuvette clamped to it over the crystal. The data are courtesy of Dr Ralf Richter from CIC biomaGUNE (Spain) and the Max Planck Institute for Intelligent Systems (Stuttgart, Germany). | ||
In a typical QCM experiment, the resonance frequency of such a crystal is being measured together with the energy losses during the oscillations. Energy losses can be described by the bandwidth of the resonance (half-band half-width) or, equivalently, dissipation. The resonance frequency is proportional to the crystal thickness. Therefore, when material adsorbs to the surface (the crystal becomes thicker), the frequency decreases. In the simplest case, described by the so-called Sauerbrey relationship, this decrease in frequency is proportional to the mass per unit area of the material adsorbed to the surface.30 Importantly, in liquids, the solvent also contributes to the mass that is sensed by QCM.
The key advantage of QCM over numerous other techniques is that it is sensitive not only to the amount of material on the surface but also to the way in which the material is distributed and is attached to the surface, and its mechanical properties. Therefore, depending on the type of experiment, one may probe the mechanics of the contact between the adsorbate and the surface, mechanical properties of the adsorbate itself, or its geometry/arrangement on the surface. Further details are discussed in detail in the recent review,29 which also describes the measurement methodology and data analysis. Applications of QCM to the bilayer formation are discussed in ref. 31.
QCM work on liposomes, lipid bilayers, and monolayers can be traced to the mid-90s32,33 although true breakthrough came in 1998 with the work by Keller and Kasemo.34 These authors showed that QCM could distinguish between adsorbed liposomes, bilayers, and monolayers due to unique frequency and dissipation signatures associated with the formation of these structures. It was followed by a detailed study of the lipid dynamics at surfaces (reviewed in ref. 28). A recent interesting application of QCM is the study of phase transitions in adsorbed liposomes.35
QCM has been combined with a number of optical, spectroscopic, and microscopic techniques. A combination of QCM-D and electrochemical impedance spectroscopy (EIS) was successfully applied to follow supported lipid bilayer formation on silicon oxide coated crystals.36 The platform allows for real-time analysis of structural and electrical properties of phospholipid assemblies. QCM-D combination with ellipsometry was used to study in real time the transfer of glycolipids between supported bilayers and liposomes37 and to analyze in situ the clustering of a membrane-binding protein annexin A5,38 while a QCM–AFM combination was used to investigate the physical origin of energy dissipation in layers consisting of isolated particles (such as viruses or liposomes),39,40 which led to the studies of liposome deformation by QCM.39,41 QCM based methods offer the ability to study membrane dynamics on the millisecond timescale in a label-free manner, which are inaccessible with other characterization techniques.
4. Force methods: atomic force microscopy and surface force apparatus
Atomic force microscopy (AFM)42 is based on an atomically sharp tip mounted on a spring cantilever that is raster-scanned across a sample surface. Cantilever deflection, which is proportional to the force between the tip and the sample, is monitored with an optical system. Sharpness of the tip means that it senses forces from a highly localized area, thus allowing the tip–sample interaction force to be mapped at very high spatial resolution (subatomic in ultra-high vacuum, subnanometer in liquids). In the most common operational modes (contact, intermittent contact (tapping)), such maps reveal the surface topography of the sample, although they can also reveal surface charge density, adhesion, and other parameters, under appropriate conditions. AFM has been extensively reviewed in the literature.43–45 Compared to ToF SIMS, X-ray photoelectron spectroscopy, QCM and many other label free techniques, the primary merits of AFM are its extremely high spatial resolution and the ability to monitor the dynamics of processes in situ and in liquids at high spatial resolution.Historically, membrane-related AFM imaging work developed in two directions. On the one hand, Andreas Engel and co-workers, relying on their extensive expertise in transmembrane protein structure analysis by electron crystallography, pushed the limits of resolution achievable with AFM on two-dimensional crystals of transmembrane proteins. They reported in-plane resolutions better than 0.5 nm.46–52 Depth resolution in AFM is limited by thermal fluctuations of the cantilever.53
This work later led to research on native membranes – complex non-crystalline lipid/protein assemblies – where the dynamics of single transmembrane protein molecules could be observed.54
On the other hand, Shao and colleagues pursued the studies of non-crystalline specimens. They looked at lipid bilayers supported on mica and found domains, defects and ripple phases; they used these bilayers to study membrane-bound proteins such as cholera toxin, etc. (reviewed in ref. 55 and, more recently, in ref. 56). Cholera toxin subunit B5 to this day remains the best specimen for training students in the art of high-resolution AFM because of the ease of sample preparation and clarity with which various imaging artefacts can be visualized; one of us (IR) used it to train numerous graduate students over the years.
Combining the resolution and ability to follow dynamics, AFM was used to investigate the structure and self-organization of membrane-bound proteins such as annexin A557,58 and streptavidin.59 AFM also became a particularly useful tool for studying mesoscale transformations of lipids at surfaces (liposome rupture and supported bilayer formation, changes in phospholipid membranes during interaction with antibiotics and peptides, solubilization of a supported bilayer by a detergent)28,52,60–62 and investigating lipid phase behaviour (domain formation). Domain formation in supported lipid bilayers has become a major research topic; this phenomenon is largely inaccessible to any other technique. Most notable in this context is the impressive body of work by Longo and co-workers (see, e.g., ref. 63). A review on this topic has recently appeared.64 The work by Kraft et al., where AFM was combined with ex situ secondary ion mass spectrometry, has already been mentioned above.65 AFM continues to provide unique insight into the structure and dynamics of biological macromolecules and their assemblies.
The early methodological studies showed that resolution in biological AFM is primarily a function of the tip–sample interaction area; therefore minimizing tip–sample interactions leads to higher resolution. This can be achieved by balancing van der Waals and electrostatic interactions48 and minimizing the applied forces, and by ensuring that the samples are very flat and immobile – hence the success of the approach with imaging two-dimensional crystals. On the other hand, this places severe limitations on the types of samples that could be studied at high resolution: they need to be very flat and contain tightly packed, immobile motifs. These limitations can be circumvented to some extent, thanks to the recent introduction of imaging modes that are based on dynamically collecting force-distance data at every pixel in the image and moving from pixel to pixel far away from the surface. Because the motion of the tip near the surface is strictly in the z-direction, there is (almost) no lateral force. This way of acquiring topography images also offers better control over the normal tip–sample forces.66
Force measurements by AFM have a venerable history. An AFM tip is a very sensitive force probe. By moving the tip towards and away from the surface instead of laterally as is done when collecting an image, and observing its deflection, one can sample tip–surface interactions. In this way, electrostatic and van der Waals forces between different materials were initially measured,67 and later, breakthrough forces related to hole formation in lipid bilayers were studied.68
In much the same way one can also investigate the properties of molecules tethered between the tip and the surface by using the so-called single molecule force spectroscopy (pulling experiments). Most readers will be familiar with the classical work on protein titin.69 Using this approach, one can measure the anchoring force of hydrophobic alpha helical peptides in phospholipid membranes70 and also describe unfolding of transmembrane proteins, such as bacteriorhodopsin.71 Unfolding and extracting a single protein from a phospholipid bilayer typically requires a force in the range of 100–150 pN,72 which is accessible with AFM in both air and liquid environments.
One severe drawback of AFM is the slow imaging speed. As the AFM tip is raster-scanned over the sample, the time points in the beginning and end of an image are not the same, imposing severe limitations on imaging fast processes. Ultra-fast AFM has recently been developed to address this limitation and promises new and unique insight into lipid dynamics at surfaces.73–75
Another limitation of AFM pertains to the lack of chemical sensitivity. In an effort to circumvent this limitation, several groups investigated bilayer mechanics in different phases, because mechanical response is related to composition.76–79 Similarly, functionalizing AFM tips allows one to infer surface chemical compositions and variations based on tip–sample interactions (adhesion, etc.).66 This approach, so-called chemical force microscopy,80 has successfully been applied to chemical characterization of bacterial cell surfaces.81,82 Conductive cantilevers can be used to perform electrochemical microscopy. This allows one to simultaneously study the structure and the enzymatic activity of single membrane proteins in real-time.83 However, a more promising research direction is to combine the high lateral resolution of an AFM with the chemical sensitivity of another technique, e.g., by collecting the material locally and analysing it by mass spectrometry.
While AFM allows determination of short-range forces with pN resolution, long and medium range forces can be measured by surface force apparatus (SFA) which probes the cooperative, ensemble-averaged interactions between many molecules and a membrane or between two opposing phospholipid bilayers.84 In 1993 van der Waals interactions between two mica supported phospholipid bilayers were measured using SFA.85 Another label free method to measure forces between phospholipid membranes is the osmotic stress/X-ray diffraction method which can measure pressure–distance relations for phospholipid bilayers.86
5. Label-free optical methods: plasmonics, wave-guide spectroscopy and interferometry
5.1. Surface plasmon spectroscopy
One of the label-free sensing concepts that has been introduced for phospholipid membrane characterization and to probe membrane–protein and drug interactions is surface plasmon resonance (SPR) spectroscopy.87 Surface plasmons are coherent collective spatial oscillation of the conduction electrons in a metal driven by an incident electromagnetic wave. Depending on the refractive index and geometry of the system, certain plasmon modes are supported at the metal–insulator interfaces. A change in the refractive index in close proximity to the metal surface, for example by adsorption of macromolecules, will lead to a change in the supported modes. This property can be exploited to sense supported phospholipid monolayers, bilayers and liposomes, and biomolecular interactions (e.g. protein binding) occurring at the phospholipid interface. In addition to extended surfaces, metallic nanostructures can also support SPR that are now localized to a subwavelength region (LSPR, also called particle plasmons).88 This allows for miniaturization of the sensing platform and low-cost microscopy readout.89 While exciting surface plasmons require the usage of grating, prism, or high numerical aperture objective to match the k-vectors of the incident light and the plasmon mode, particle plasmons can be excited readily by shining light directly onto the metal nanostructure.One main obstacle in applying SPR and LSPR to study lipid bilayers lies in the fact that self-assembly of lipid bilayers from vesicles is not straightforward on silver and gold. One way to resolve this issue is to have a thin layer of e.g. silicon oxide on top of the gold or silver surface. Alternatively one can use gold substrates with holes: either the membrane will be spanning the hole aperture or it will cover the internal walls of the pore. In the latter case the walls must be covered with a thin layer of silicon oxide or similar bilayer compatible materials.89
An example of a recent application of LSPR is the quantification of protein binding to membranes in vitro (see Fig. 3a) with accuracy comparable to fluorescence correlation spectroscopy (FCS). In this approach,90 Ag@SiO2 core–shell nanocube particles are exposed to lipid vesicles, leading to spontaneous assembly of lipid bilayers on nanocubes. The nanocube particles show sharp quadrupolar LSPR scattering peaks (see the figure). Protein binding results in a shift in the LSPR extinction spectrum. The advantage of this approach as compared to FCS also lies in the fact that this LSPR based approach has a much broader working concentration range. The approach, while being cheap and highly practical, provides a remarkable sensitivity of 0.19 ng cm−2. Efforts have also been made to probe the binding kinetics of membrane proteins in vivo (Fig. 3b) using surface plasmon resonance microscopy (SPRM). This approach allows for real-time monitoring of single cells, measuring the distribution of membrane proteins and their local association–dissociation rate constants for various ligands.91
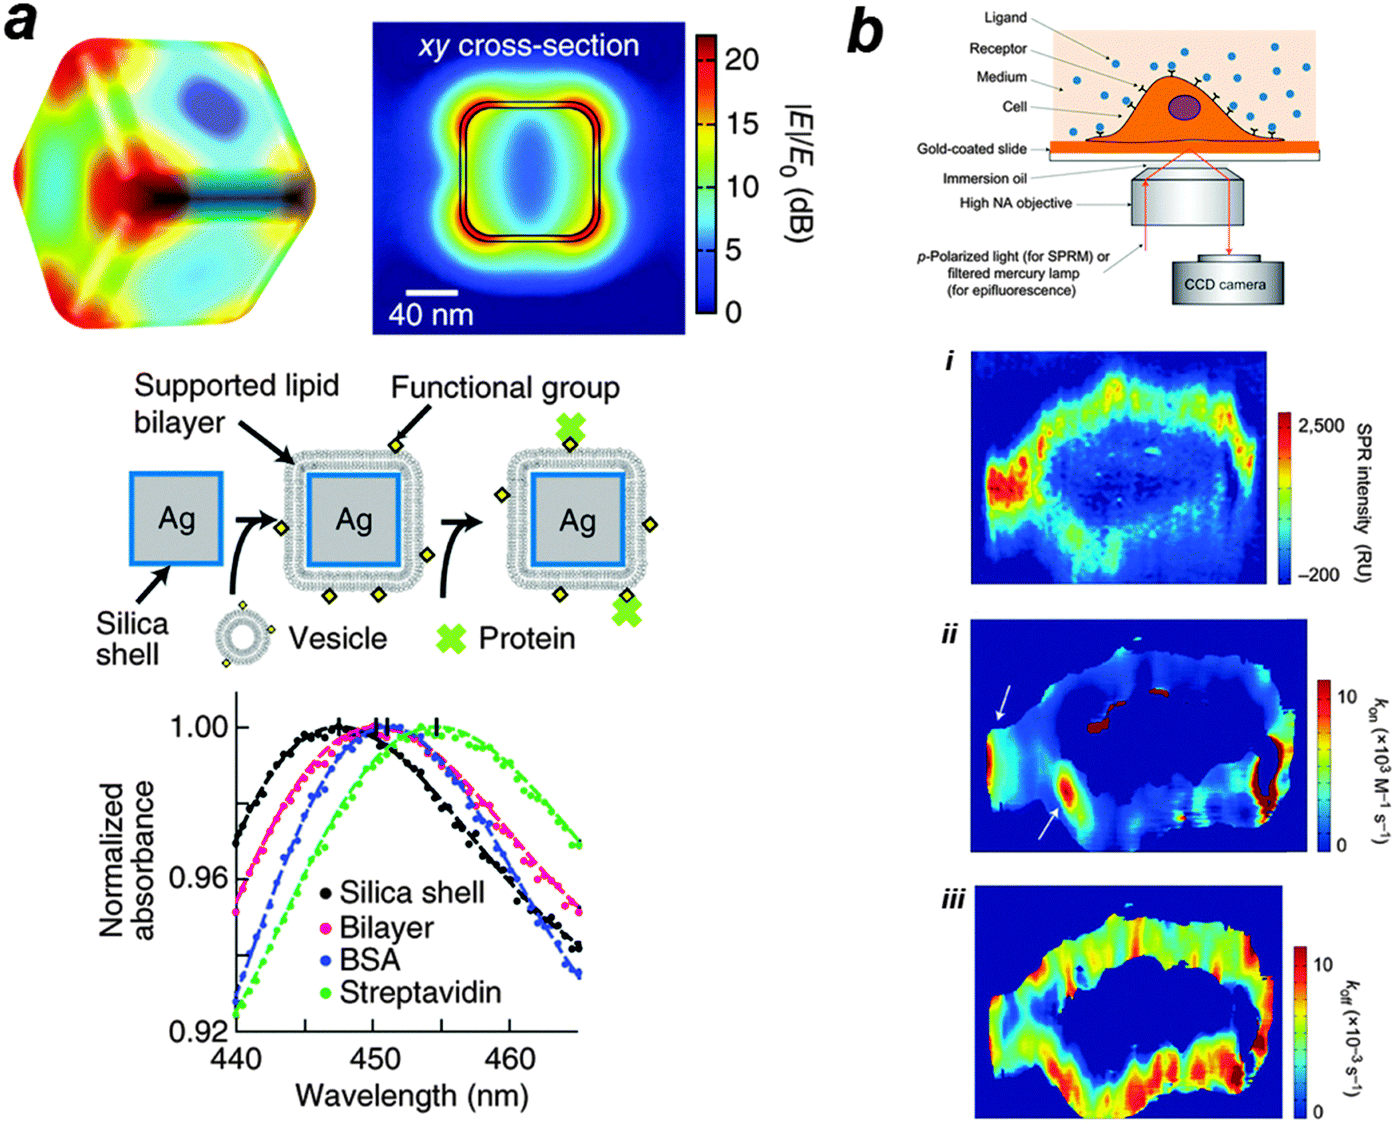 | ||
| Fig. 3 (a) In vitro label-free measurement of membrane–protein binding using plasmonic nanocube sensors. The computed electric field norm (|E|/E0) of a nanocube at resonance (n = 1.33303, λ0 = 474 nm) is shown. In this approach, supported lipid bilayers are formed by vesicle fusion onto the silica surface, and protein binding is monitored by shifts in the LSPR extinction spectrum. Typical spectra of membrane coverage and protein binding to the membrane surfaces are presented. Sequential addition of lipid vesicles, BSA and streptavidin causes LSPR red shifts. The figure is adapted from ref. 90 with permission. (b) In vivo label-free measurement of membrane-protein binding using SPR microscopy. A p-polarized laser beam is directed onto a gold coated glass coverslip through an oil-immersion objective to create SPR on the gold surface, which is imaged with a CCD camera. The method is then used to map glycoprotein distribution and to measure binding kinetics of glycoprotein to a lectin, i.e. WGA. (i) The distribution of GlcNAc-containing glycoproteins was quantified by the SPR signal increment after WGA binding. (ii, iii) The local SPR sensorgrams were fitted pixel by pixel with a first-order kinetics model to map the local association (ii) and dissociation (iii) rate constants. The white arrows indicate relatively fast binding regions. The figure is adapted from ref. 91 with permission. | ||
5.2. Waveguide spectroscopy
Another possibility for confining light close to a surface is waveguide spectroscopy. In particular, dual polarization interferometry (DPI) allows for accurate determination of phospholipid bilayer thickness and mass.92 Unlike SPR, where only a single polarized light mode (TM) can excite the surface plasmon and as a result thickness and refractive index cannot be determined independently, two independent measurements with two different polarizations can be conducted in a waveguide by DPI, leading to high-resolution determination of thickness and refractive index for an isotropic membrane. For anisotropic films additional parameters have to be measured independently to be used in the analysis, which for example can be done using in situ coupled plasmon waveguide resonance spectroscopy (CPWR). This variant of SPR measures the resonance with excitation light polarized parallel and perpendicular to the membrane plane and, thus, reveals the anisotropic optical properties of phospholipid membranes. As compared to conventional SPR, CPWR is more sensitive and has a higher spectral resolution. The thin metallic film in CPWR is covered with a thick dielectric layer that acts as an optical amplifier and allows for having a desired surface chemistry for lipid membrane studies.93,945.3. Interferometry
Interferometric techniques are well established in optical measurements and analytics. For example, interferometry is used for detecting very thin layers of material on surfaces through constructive or destructive interferences caused by multiple reflections from various interfaces. Because the total reflection (or transmission) signal is a sinusoidal function of the optical path difference Δx/λ, even Angstrom variations can cause notable changes in the signal. The only fundamental limiting factor in detecting interferometric variations is the shot noise of the incident light. As a result, submonolayers of proteins and lipids can be readily detected.95Standard interferometry using extended illumination does not provide any lateral information. However, interference phenomena can be combined with microscopy in methods such as phase contrast and differential interference microscopy, which have been commercially available in modern instruments. Recently, these methods have been extended to the interferometric detection and microscopy of scattering (iSCAT) from nano-objects such as gold nanoparticles,96,97 viruses98–100 and even single non-fluorescent molecules.101,102 The essence of this approach is in interfering the small amount of light scattered by a nanoparticle with the incident beam or part of it. Confocal or wide-field illumination and detection can be then used to image, localize and track individual particles. In particular, a virus or a gold nanoparticle can act as a scattering label for tracking lipid diffusion with nanometer precision98,99 even in the axial direction.103,104
6. Label-free vibrational microscopy
Spontaneous Raman spectroscopy and microscopy provide label-free chemical contrast based on specific vibrational signatures of chemical bonds and, therefore, constitute a useful tool in label-free imaging (Fig. 4, Box 2). However, conventional Raman spectroscopy, which relies on the highly inefficient process of inelastic light scattering, suffers from low efficiency and sensitivity. To enhance the Raman signal, coherent, stimulated nonlinear Raman spectroscopic methods have been developed. The essence of stimulated Raman approaches is that two light fields (i.e. laser pulses) are incident onto the sample, where the difference frequency of the pulses matches the vibrational resonance under study. Two types of coherent nonlinear Raman spectroscopic approaches have been developed sufficiently to study lipids with submicron spatial resolution: (1) coherent anti-Stokes Raman scattering (CARS) spectroscopy, which is a parametric generation spectroscopy technique without transfer of energy to or from the sample; and (2) stimulated Raman scattering (SRS) spectroscopy,105 which is a nonlinear dissipative optical spectroscopy technique. In addition to the many-fold increase in sensitivity, the advantages of these nonlinear Raman approaches include their inherent depth section (due to the CARS/SRS signals generated only at the focus of the different laser beams) and the improved spatial resolution owing to the nonlinear nature of the stimulated Raman processes.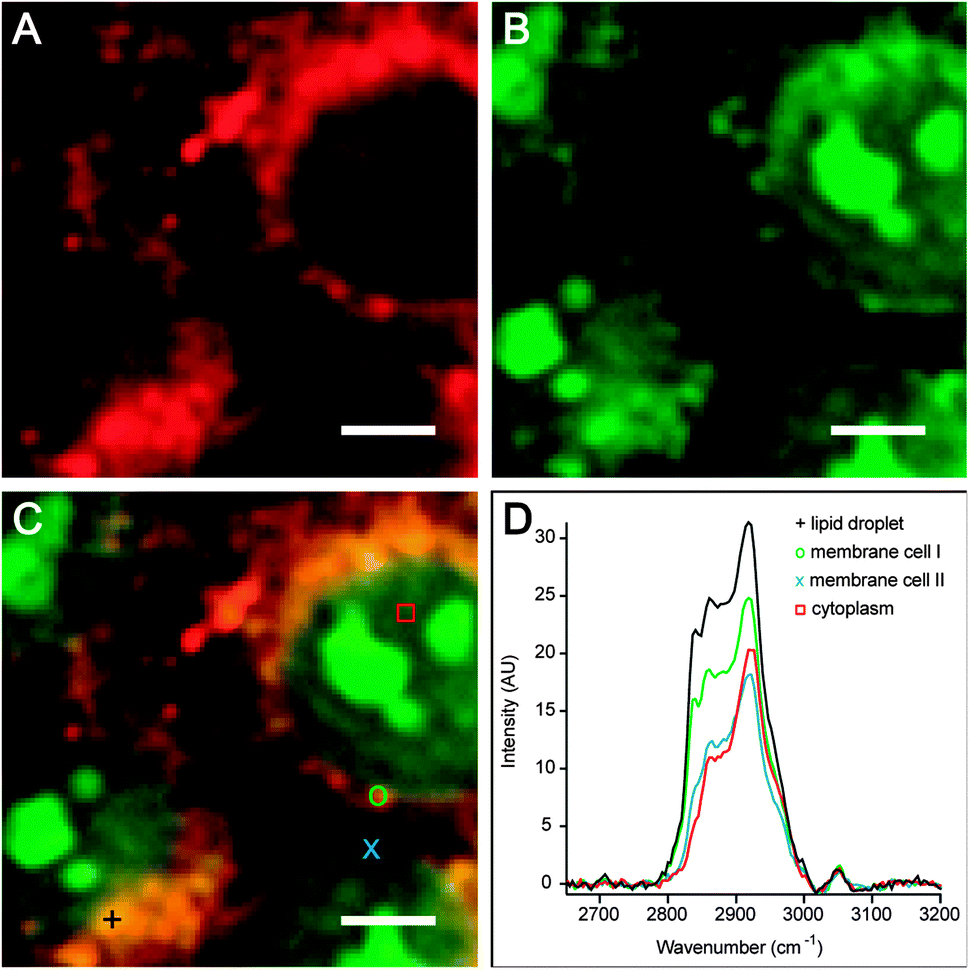 | ||
| Fig. 4 Hyperspectral image plots of HCT116 (colorectal carcinoma) cells after 12 h of culture from multiplex CARS microscopy. (A) Intensity map primarily showing CH2 symmetric vibrations [2840–2846 cm−1], which allows label-free identification of cell membranes and lipid droplets. (B) Intensity map showing CH3 vibrations [2900–2930 cm−1], which is indicative of protein organization. (C) Overlay of A and B clearly shows that cellular structures containing only protein (green) or lipids (red) are identifiable from label-free microspectroscopy. Inspection of the overlay demonstrates the appearance of condensed protein, possibly chromatin masses, that does not co-localize with membrane structures. (D) Raman spectra from different voxels in C provide quantitative information on the respective lipid composition and lipid–protein ratio. Scale bar = 5 μm. Image courtesy of N. Billecke, W. Gebhardt, and S. H. Parekh (Max Planck Institute for Polymer Research). | ||
Box 2. Infrared and Raman spectroscopyThe challenge we face here clearly lies in obtaining information about molecular composition and conformation of the different membrane constituents, their dynamics and their orientation. The additional challenge lies in studying specifically the membrane interface and not the bulk. It is evidently challenging to ‘watch’ selectively these few layers of molecules.One solution to these challenges is contained within the molecules themselves: the chemical bonds that connect the atoms in a molecule act like tiny springs, so that the molecules exhibit molecular vibrations. Many molecular vibrations of lipids exist, but an important one is the stretching motion of hydrogen atoms relative to the carbon atoms in a lipid alkyl chain. Different parts of molecules exhibit different characteristic vibrations. Moreover, the precise frequency of the vibrations is determined by the strength of the chemical bond (‘the spring constant’), the masses of the atoms involved and the local environment of the molecule. Hence, by determining the vibrational properties of molecules we can typify functional groups, and identify their local environment. This is the basis of vibrational spectroscopy, which generally uses infrared light to interrogate molecular vibrations. Infrared spectroscopy makes use of the fact that vibrations of molecules often absorb light at specific infrared frequencies that are characteristic of their structure. These absorptions are resonant frequencies, i.e. the frequency of the absorbed infrared light matches the frequency of the bond or group that vibrates. In conventional infrared spectroscopy, the mid-infrared region, ranging from approximately 4000 to 400 cm−1 (2.5–25 μm), is used to study the fundamental vibrations and the associated rotational–vibrational structure. In Raman spectroscopy, light is inelastically scattered from vibrations, and the energy difference between the incoming photon and the outgoing photon corresponds to the vibrational energy. Conventional infrared and Raman spectroscopy has been used extensively as an analytical tool in a wide range of disciplines because of its ease of use and its relatively high information content. It has been, and is continuing to be, a standard spectroscopy tool in most chemistry laboratories. There are, however, several drawbacks of conventional infrared spectroscopy that can be identified. First of all, its time resolution is limited to the time it takes to record a spectrum, typically in the range of seconds. Secondly, the spatial resolution is limited – through the diffraction limit – to several micrometers, due to the long wavelength of infrared radiation. Thirdly, it is very challenging to obtain specific information on surfaces with this technique: methods have been developed to interrogate exclusively the outermost few micrometers of the material, but this still corresponds to thousands of molecules, whereas the true surface region is typically only a few molecules thick. In this review, we note a few extensions of infrared and Raman spectroscopy that allow overcoming these barriers, at least in part. |
CARS microscopy has been applied to image the structure and dynamics of lipids, which have abundant C–H stretching oscillators constituting a spectrally isolated Raman band. The approach has enabled imaging lipids within cells and tissues, as well as lipid imaging of organs and even organisms.106–110 While multiplex CARS microscopy111 (where an entire vibrational spectrum is acquired at each spatial point) is able to quantify the local degree of lipid saturation and localization in the sample, a drawback of CARS is its inability to identify the acyl chain length and its limited capability to differentiate between chemically similar headgroups such as sphingomyelins and phosphatidylcholines. Nonetheless, the combination of submicron spatial resolution, chemical imaging and virtually zero sample preparation makes CARS imaging a useful complement to MS methods.
7. Surface enhanced and tip enhanced Raman spectroscopy
Surface-enhanced Raman scattering (SERS) combines spontaneous Raman spectroscopy with the local field enhancement capability of gold or silver nanostructures to amplify the signal by 3–4 orders of magnitude.112 Using ultrasensitive detectors, SERS allows for single molecule spectroscopy: since the local fields of metallic nanostructures can be highly confined, the lateral resolution can be two orders of magnitude better than the diffraction limit.113,114In 1994, Chazalet et al. performed SERS analysis of hydrated phospholipid bilayers. In this study, the membrane was prepared by the Langmuir–Blodgett technique on a high index rutile prism on which a silver coating (15 nm thick) had been deposited. The prepared SLBs were enclosed in a water-tight box and the prism was illuminated with a laser beam at an incident angle greater than the limiting reflection angle. They found that hydrated and non-hydrated phospholipids have distinct SERS spectra and that the phospholipid monolayers can be distinguished from bilayers.115 In another effort, Sweetenham et al. performed SERS analysis on a Langmuir–Blodgett phospholipid bilayer deposited on large-scale two-dimensional arrays of metallic nanostructures.116 Phospholipid monolayers, prepared at the air–water interface, have been the subject of SERS analysis as well. In one experiment, an organized monolayer of negatively charged tetramyristoyl cardiolipins was used as a template for the electrochemical deposition of silver for signal enhancement. The method has been used to estimate the pH at the metal–phospholipid interface.117
A major step in enhanced Raman spectroscopy of phospholipid membranes was enabled by the introduction of tip enhanced Raman spectroscopy (TERS).118 In this method, the strong enhancement in SERS is combined with the high spatial resolution (<30 nm) of scanning probe imaging. In TERS, the lightning rod antenna effect at a metallic tip (AFM, scanning probe of a shear force microscope, or an STM) is used to enhance the electric field intensity of the excitation beam and the emission rate.119 This can be used to perform both morphological and chemical analyses simultaneously of lipid mixtures and study domain formation.
8. Label free, surface-specific spectroscopy
Membranes are dynamic entities with molecular processes occurring at timescales ranging from hours as in lipid flip-flop to femtoseconds as in energy dissipation. The dynamics of a membrane are not only important functionally but can also be used to infer structural and chemical information about it. The structure and dynamics of a membrane depend on the interactions between lipids, proteins and the interfacial water molecules. The difficulty of label-free detection of the dynamics lies in the fact that the membrane is very thin since the lipid double layer is roughly 5 nm thick with 0.5 nm interfacial water layers on both sides.Relative surface-sensitivity can be achieved in attenuated total reflection Fourier transform infrared (ATR-FTIR) spectroscopy. ATR-FTIR makes use of total internal reflection of infrared light resulting in an evanescent wave, which extends into the sample over a length scale of typically 1 micrometer (the exact value is determined by the wavelength of the infrared light, the geometry of the experiment and the indices of refraction of the ATR crystal and the medium under study). ATR-FTIR spectroscopy and imaging have been extensively and successfully used for label-free characterization of the structure and dynamic of biomembranes. A number of reports have been published revealing the structure of surface-adsorbed lipid bilayers,120 lipid vesicles and the interactions with other (biological) molecules,121,122 as well as dynamic processes in biological samples including aorta, skin and live cells, see e.g. Nadtochenko et al.123 For a recent review of ATR-FTIR studies of biological membranes, see Kazarian et al.124
Where ATR-FTIR is a linear spectroscopy, recent advances in nonlinear surface spectroscopy have allowed for direct probing of membrane structures and dynamics in a label-free manner through (the temporal evolution of) the vibrational spectrum of the membrane molecules.125–128 Specifically, the symmetry breaking that occurs at the phospholipid interface enables the 2nd order nonlinear optical process of sum frequency generation (SFG). In an SFG experiment, a visible and a mid-infrared laser pulse are spatially and temporally overlaid onto the sample surface. Because the symmetry is broken at the interface, the laser pulses can interact with the lipids at the interface to generate the sum frequency of the visible and mid-infrared light. This process is dramatically enhanced if the infrared light is resonant with vibrational modes of the lipid interface. From the resulting spectra, the amplitudes and frequencies of surface vibrations are extracted, indicating the composition and molecular conformations of the interfacial species. Specifically for lipids, the CH2 and CH3 vibrations are sensitive markers of lipid organization. As in an all-ordered, saturated alkyl chain the organization of CH2 groups is highly symmetric, the SFG signal associated with those groups is very low; as the lipid tail becomes disordered, the CH2 signal increases. Moreover, different lipids exhibit different vibrational spectra, especially when they have different head groups. SFG spectroscopy can, therefore, readily be used to characterize the composition and the structure of phospholipid membranes and several other interfaces (see, e.g., Fig. 5). The technique is non-invasive and provides sub-(lipid)monolayer sensitivity. Because ultrashort laser pulses are used in these experiments, the changes in the spectra following a specific excitation or temperature jump can be readily determined. In this way, timescales from ∼50 fs (5 × 10⁻¹⁴ s) to ms are accessible.
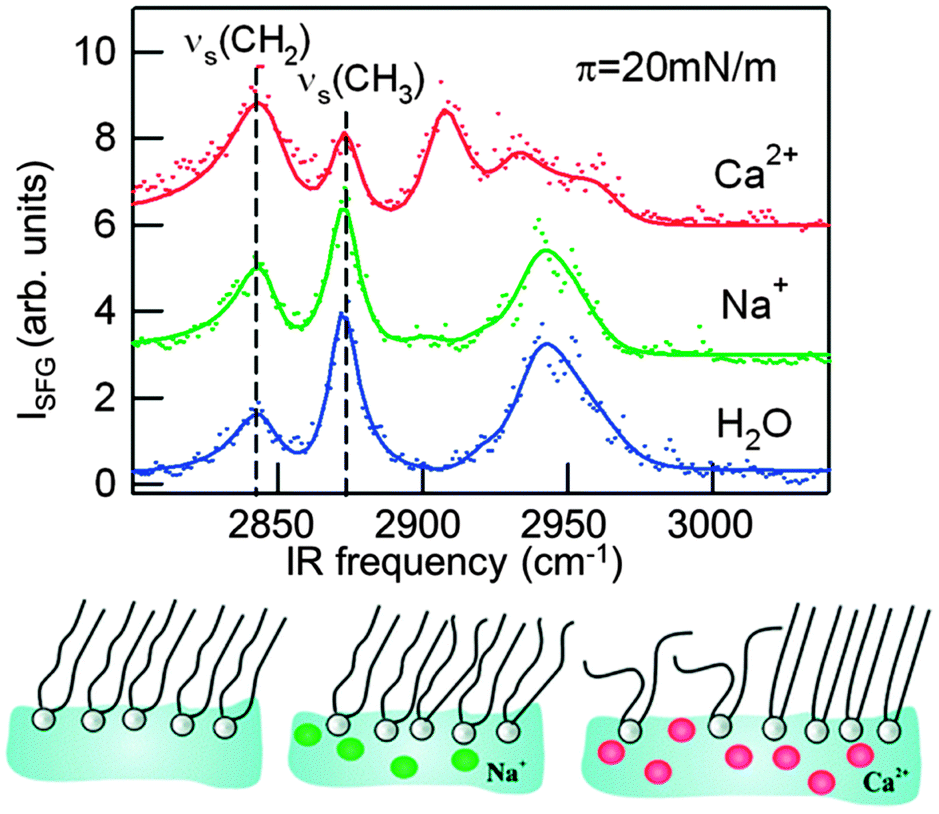 | ||
| Fig. 5 Vibrational sum-frequency generation spectra reveal the different effects of sodium and calcium ions on the lipid organization in a monolayer of the zwitterionic phospholipid L-1,2-dipalmitoyl-sn-glycerol-3-phosphocholine (DPPC) at a surface pressure of π = 20 mN m−1. Sodium ions only subtly affect the monolayer structure, while the effect of calcium is large and depends strongly on the surface pressure. For pressures between 5 and 25 mN m−1, Ca2+ ions induce disorder in the monolayer, as evident here from the increase in the methylene symmetric stretch (νs CH2) intensity and the decrease in the methyl symmetric stretch (νs CH3).129 | ||
Indeed, major progress was made by the emergence of ultrafast SFG spectroscopy enabled by the development of IR pump–probe laser techniques, which provides access to information on the structural dynamics of phospholipid membranes. In ultrafast spectroscopy, a very intense ultrashort IR pump pulse locally excites a molecular vibration and subsequently an IR probe pulse monitors the effect of this excitation on other vibrational modes and the subsequent relaxation of the vibrational excitation at different delay times after the excitation process. In this way, transient spectra can be collected on time scales as short as 100 fs allowing for following the dynamics of the phospholipid membranes in real time. Vibrational energy transfer between modes can be used to elucidate structural correlations between membrane constituents and dynamics of membrane molecules.19,130
SFG combined with pump–probe laser technology allows for time-resolved SFG which has been recently applied to phospholipid membranes to study the structure of lipids, interfacial water and vibrational energy transfer across the lipid leaflets. While static and time-resolved SFG techniques are suited for analyzing engineered lipid monolayers and bilayers, the phospholipids in cellular membranes can in principle be detected using static and pulse-probe IR spectroscopy. Because the measurements are performed in transmission mode, the tissue sections have to be thin enough to allow the transmission of the wave. The challenge, however, will be the interpretation of the complex signal and to reach a good signal-to-noise ratio. This can be achieved if the observer focuses on the vibrational modes that are specific to phospholipids.
9. Neutron reflectometry
The distinctive feature of reflectometric and other scattering techniques is their unique ability to “look within” the material beneath the interface at very small length scales. Specular, elastic reflection of X-rays or neutrons allows the distribution of material perpendicular to the interface to be probed.131 Reflectometry can therefore be used to study lipid composition of both the inner and the outer leaflets of supported bilayers132–135 (Fig. 6). It can also be used to look at the lipid bilayer underneath a bound protein136,137 or bilayers coated with adsorbed polymers, investigate the location of a molecule within the bilayer, etc. There are detailed reviews of neutron reflectometry on lipid bilayers137–141 and X-ray reflectometry and its applications to biological membranes at the solid–liquid interface.142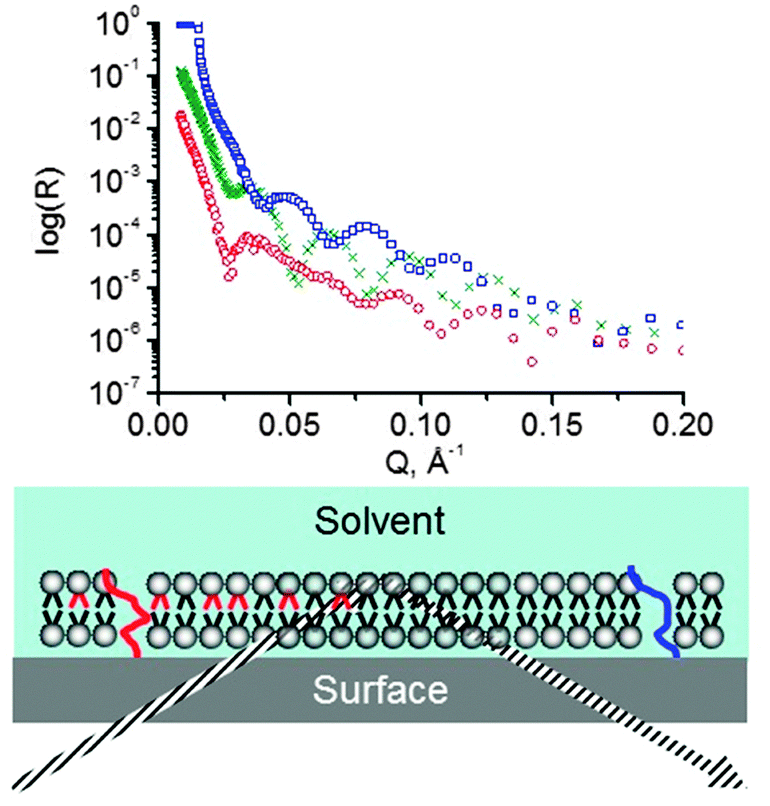 | ||
| Fig. 6 Schematic representation of a neutron reflectometry experiment. A neutron (grey dashed lines) beam goes through the substrate (silicon block) and is reflected from the substrate/lipid and lipid/solvent interfaces. The resulting reflectivity curves (above) are fitted with a model that yields the scattering length density (sld) distribution in the direction normal to the interface (red and blue overlays over the lipid molecules). In this case, on the left the bilayer is asymmetric while on the right it is symmetric. If one of the two lipids is deuterated (black) and the other one is not (red), this asymmetry can be detected (notice that the red and the blue sld profiles are different). The asymmetry may be caused by a number of factors (see references in the text): the “red” and the “black” lipids typically differ in some way – e.g., headgroup or chain length/composition. Deuteration is not the cause of the asymmetry but merely enables its detection. The sld profiles, as well as the reflectivity data, shown in this figure are from an actual experiment where lipid distribution on TiO2 was studied (figure credit: Reviakine et al. KIT). | ||
The particular advantage offered by neutron reflectometry is, of course, contrast variation.143 Scattering length density of hydrogen is very different from that of deuterium, while they are rather similar from a chemical point of view. It is standard practice to perform neutron reflectometry experiments in at least three different mixtures of D2O and H2O – three “contrasts”. This provides three sets of data that have to be fitted with one model describing the distribution of lipid material along the direction normal to the surface. Having to fit three data sets with one model considerably constrains the choice of the fitting parameters (those familiar with ellipsometry will recall that the contrast variation method is also useful there for the determination of optical properties of thin films144). Furthermore, by using selectively deuterated species, experiments revealing the location of the particular species of interest within the bilayer can be designed.
10. Conclusions and outlook
There is very rapid development in membrane measurement techniques that do not rely on labelling membrane molecules. These new approaches enable studying the structure and dynamics of membranes on ultrafast time and nanometer length scales (see Table 1). New technical developments in spectroscopy, laser technology and plasmonics are expected to push the boundaries even further and to provide invaluable opportunities for biophysical studies and enhanced biosensing. X-ray photoelectron spectroscopy has recently been added to the arsenal of label-free membrane characterization techniques and has been used to detect and quantify PIP2 phospholipids in supported lipid bilayers.145 Confining light fields to below the diffraction limit has recently become possible by passing light through random media with nanoscale refractive-index inhomogeneities.146 Advances in the development of broadband ultrafast lasers and in the fabrication of new nonlinear optical materials have pushed the available frequency spectrum that could be generated and detected in the time domain to beyond 100 THz.147 THz spectroscopy combined with a combination of other spectroscopic techniques such as ultrafast infrared (fs-IR) and dielectric spectroscopy (FD-GHz) allows one to trace the motion of water molecules interfacing with biomolecules and phospholipids in real time.148 Finally in silico methods, particularly large-scale ab initio techniques, have recently been developed to investigate the structure149 and dynamics150 of membranes, providing complementary information to that derived from label-free experimental methods.| Technique | Spatial resolution (x−y) | Spatial resolution (z) | Time resolution | Chemical information |
|---|---|---|---|---|
| ToF SIMS | <100 nm | 1–5 nm (combined with dynamic SIMS) | Static | YES |
| MALDI MSI | 740 nm (microscope mode) 5 μm (microprobe mode) | 50 μm | Static | YES |
| SERS | <1 μm153 | ∼3 μm | ∼1 min | YES |
| TERS | 15 nm118 | — | minutes | YES |
| AFM | 0.5 nm53 | 0.1 nm | 1 s | NO (for standard AFM) |
| LSPR | nm154 | — | ∼1 ps | NO |
| iSCAT | 1 nm in localization99 | 1 nm | 1–10 μs | NO |
| TRSFG | Down to 1 μm (in principle diffraction limited) | — | 50–100 fs | YES |
| Static SFG | Down to 1 μm (in principle diffraction limited) | — | Static (minutes) | YES |
| Pulse probe IR | 100 μm (in principle diffraction limited) | — | — | YES |
| XPS | 0.5–100 μm | 100 nm | Static | YES |
| CARS | 250 nm155 | 500 nm | ∼ms | |
| QCM-D | — | — | 5 ms | NO |
To date, applications of the label-free techniques have mostly focused on imaging lipids and proteins in model systems, monitoring their structure and dynamics during membrane processes and studying membrane–protein interactions. The techniques do provide the researchers with the previously unavailable ability to dynamically monitor biological systems with chemical specificity in native or near-native states with minimal modifications. There remains great potential for these techniques to image exogenous molecules, to perform high-throughput screening and to visualize chemical reactions that are of relevance to biology and medicine. A significant challenge facing researchers in this area is to shift the focus from model, near-native systems17,151,152 to the actual native systems. Examples of how this is already approached with AFM and SIMS are presented in this Review, but significant challenges remain ahead, together with great potential for new discoveries. Given the recent commercialization of label free technologies such as CARS microscopy, QCM-D, and dual polarization interferometry, we envision their wide usage in a variety of applications in the near future. In other words, the future is bright, in a label-free way.
Acknowledgements
The authors are grateful to Dr Sapun Parekh for critical reading of the manuscript and Dr Andreas Engel for discussions.Notes and references
- S. J. Singer and G. L. Nicolson, Science, 1972, 175, 720–731 CAS.
- K. Jacobson, E. D. Sheets and R. Simson, Science, 1995, 268, 1441–1442 CAS.
- M. P. Wymann and R. Schneiter, Nat. Rev. Mol. Cell Biol., 2008, 9, 162–176 CrossRef CAS PubMed.
- A. Shevchenko and K. Simons, Nat. Rev. Mol. Cell Biol., 2010, 11, 593–598 CrossRef CAS PubMed.
- S. Mashaghi, T. Jadidi, G. Koenderink and A. Mashaghi, Int. J. Mol. Sci., 2013, 14, 4242–4282 CrossRef CAS PubMed.
- S. F. Wong, C. K. Meng and J. B. Fenn, J. Phys. Chem., 1988, 92, 546–550 CrossRef CAS.
- M. Karas, U. Bahr and F. Hillenkamp, Int. J. Mass Spectrom., 1989, 92, 231–242 CrossRef CAS.
- C. S. Ejsing, J. L. Sampaio, V. Surendranath, E. Duchoslav, K. Ekroos, R. W. Klemm, K. Simons and A. Shevchenko, Proc. Natl. Acad. Sci. U. S. A., 2009, 106, 2136–2141 CrossRef CAS PubMed.
- K. Chughtai and R. M. A. Heeren, Chem. Rev., 2010, 110, 3237–3277 CrossRef CAS PubMed.
- S. L. Luxembourg, T. H. Mize, L. A. McDonnell and R. M. A. Heeren, Anal. Chem., 2004, 76, 5339–5344 CrossRef CAS PubMed.
- B. Fuchs, R. Suss and J. Schiller, Prog. Lipid Res., 2010, 49, 450–475 CrossRef CAS PubMed.
- D. F. Smith, E. W. Robinson, A. V. Tolmachev, R. M. Heeren and L. Pasa-Tolic, Anal. Chem., 2011, 83, 9552–9556 CrossRef CAS PubMed.
- A. Gunnarsson, F. Kollmer, S. Sohn, F. Hook and P. Sjovall, Anal. Chem., 2010, 82, 2426–2433 CrossRef CAS PubMed.
- L. Zheng, C. M. McQuaw, A. G. Ewing and N. Winograd, J. Am. Chem. Soc., 2007, 129, 15730–15731 CrossRef CAS PubMed.
- D. M. Cannon, M. L. Pacholski, N. Winograd and A. G. Ewing, J. Am. Chem. Soc., 2000, 122, 603–610 CrossRef CAS.
- C. G. Marxer, M. L. Kraft, P. K. Weber, I. D. Hutcheon and S. G. Boxer, Biophys. J., 2005, 88, 2965–2975 CrossRef CAS PubMed.
- Y. H. M. Chan and S. G. Boxer, Curr. Opin. Chem. Biol., 2007, 11, 581–587 CrossRef CAS PubMed.
- C. Prinz, F. Hook, J. Malm and P. Sjovall, Langmuir, 2007, 23, 8035–8041 CrossRef CAS PubMed.
- S. G. Ostrowski, C. T. Van Bell, N. Winograd and A. G. Ewing, Science, 2004, 305, 71–73 CrossRef CAS PubMed.
- M. E. Kurczy, P. D. Piehowski, C. T. Van Bell, M. L. Heien, N. Winograd and A. G. Ewing, Proc. Natl. Acad. Sci. U. S. A., 2010, 107, 2751–2756 CrossRef CAS PubMed.
- J. F. Frisz, K. Lou, H. A. Klitzing, W. P. Hanafin, V. Lizunov, R. L. Wilson, K. J. Carpenter, R. Kim, I. D. Hutcheon, J. Zimmerberg, P. K. Weber and M. L. Kraft, Proc. Natl. Acad. Sci. U. S. A., 2013, 110, E613–E622 CrossRef CAS PubMed.
- B. Vaezian, C. R. Anderton and M. L. Kraft, Anal. Chem., 2010, 82, 10006–10014 CrossRef CAS PubMed.
- C. Y. Lu, A. Wucher and N. Winograd, Anal. Chem., 2011, 83, 351–358 CrossRef CAS PubMed.
- S. Ninomiya, K. Ichiki, H. Yamada, Y. Nakata, T. Seki, T. Aoki and J. Matsuo, Rapid Commun. Mass Spectrom., 2009, 23, 1601–1606 CrossRef CAS PubMed.
- A. F. M. Altelaar, I. M. Taban, L. A. McDonnell, P. D. E. M. Verhaert, R. P. J. de Lange, R. A. H. Adan, W. J. Mooi, R. M. A. Heeren and S. R. Piersma, Int. J. Mass Spectrom., 2007, 260, 203–211 CrossRef CAS PubMed.
- S. S. Rubakhin, W. T. Greenough and J. V. Sweedler, Anal. Chem., 2003, 75, 5374–5380 CrossRef CAS.
- Y. Schober, S. Guenther, B. Spengler and A. Rompp, Anal. Chem., 2012, 84, 6293–6297 CrossRef CAS PubMed.
- R. P. Richter, R. Berat and A. R. Brisson, Langmuir, 2006, 22, 3497–3505 CrossRef CAS PubMed.
- I. Reviakine, D. Johannsmann and R. P. Richter, Anal. Chem., 2011, 83, 8838–8848 CrossRef CAS PubMed.
- G. Sauerbrey, Z. Phys., 1959, 155, 206–222 CrossRef CAS.
- N. J. Cho, C. W. Frank, B. Kasemo and F. Hook, Nat. Protocols, 2010, 5, 1096–1106 CAS.
- P. A. Ohlsson, T. Tjarnhage, E. Herbai, S. Lofas and G. Puu, Bioelectrochem. Bioenerg., 1995, 38, 137–148 CrossRef CAS.
- A. Janshoff, C. Steinem, M. Sieber and H. J. Galla, Eur Biophys. J. Biophys. Lett., 1996, 25, 105–113 CrossRef CAS.
- C. A. Keller and B. Kasemo, Biophys. J., 1998, 75, 1397–1402 CrossRef CAS.
- G. Ohlsson, A. Tigerstrom, F. Hook and B. Kasemo, Soft Matter, 2011, 7, 10749–10755 RSC.
- E. Briand, M. Zach, S. Svedhem, B. Kasemo and S. Petronis, Analyst, 2010, 135, 343–350 RSC.
- I. Carton, L. Malinina and R. P. Richter, Biophys. J., 2010, 99, 2947–2956 CrossRef CAS PubMed.
- I. Carton, A. R. Brisson and R. P. Richter, Anal. Chem., 2010, 82, 9275–9281 CrossRef CAS PubMed.
- E. Tellechea, D. Johannsmann, N. F. Steinmetz, R. P. Richter and I. Reviakine, Langmuir, 2009, 25, 5177–5184 CrossRef CAS PubMed.
- E. Rojas, M. Gallego and I. Reviakine, Anal. Chem., 2008, 80, 8982–8990 CrossRef CAS PubMed.
- I. Reviakine, M. Gallego, D. Johannsmann and E. Tellechea, J. Chem. Phys., 2012, 136, 084702 CrossRef PubMed.
- G. Binnig and C. F. Quate, Phys. Rev. Lett., 1986, 56, 930–933 CrossRef.
- R. J. Colton, D. R. Baselt, Y. F. Dufrene, J. B. D. Green and G. U. Lee, Curr. Opin. Chem. Biol., 1997, 1, 370–377 CrossRef CAS.
- A. Engel, C. A. Schoenenberger and D. J. Müller, Curr. Opin. Struct. Biol., 1997, 7, 279–284 CrossRef CAS.
- P. K. Hansma, J. P. Cleveland, M. Radmacher, D. A. Walters, P. E. Hillner, M. Bezanilla, M. Fritz, D. Vie, H. G. Hansma, C. B. Prater, J. Massie, L. Fukunaga, J. Gurley and V. Elings, Appl. Phys. Lett., 1994, 64, 1738–1740 CrossRef CAS.
- F. A. Schabert, C. H. Henn and A. Engel, Science, 1995, 268, 92–94 CAS.
- J. B. Heymann, D. J. Müller, E. M. Landau, J. P. Rosenbusch, E. Pebay-Peyroula, G. Buldt and A. Engel, J. Struct. Biol., 1999, 128, 243–249 CrossRef CAS PubMed.
- D. J. Müller, D. Fotiadis, S. Scheuring, S. A. Müller and A. Engel, Biophys. J., 1999, 76, 1101–1111 CrossRef.
- S. Scheuring, P. Ringler, M. Borgnia, H. Stahlberg, D. J. Müller, P. Agre and A. Engel, EMBO J., 1999, 18, 4981–4987 CrossRef CAS PubMed.
- D. J. Müller, J. B. Heymann, F. Oesterhelt, C. Moller, H. Gaub, G. Buldt and A. Engel, Biochim. Biophys. Acta, Biomembr., 2000, 1460, 27–38 CrossRef.
- S. Scheuring, D. J. Müller, H. Stahlberg, H. A. Engel and A. Engel, Eur Biophys. J. Biophys. Lett., 2002, 31, 172–178 CrossRef CAS PubMed.
- R. Brasseur, M. Deleu, M. P. Mingeot-Leclercq, G. Francius and Y. F. Dufrene, Surf. Interface Anal., 2008, 40, 151–156 CrossRef CAS.
- P. L. T. M. Frederix, P. D. Bosshart and A. Engel, Biophys. J., 2009, 96, 329–338 CrossRef CAS PubMed.
- A. Engel and D. J. Müller, Nat. Struct. Biol., 2000, 7, 715–718 CrossRef CAS PubMed.
- Z. F. Shao, J. Mou, D. M. Czajkowsky, J. Yang and J. Y. Yuan, Adv. Phys., 1996, 45, 1–86 CrossRef CAS.
- M. P. Mingeot-Leclercq, M. Deleu, R. Brasseur and Y. F. Dufrene, Nat. Protocols, 2008, 3, 1654–1659 Search PubMed.
- I. Reviakine, W. Bergsma-Schutter and A. Brisson, J. Struct. Biol., 1998, 121, 356–362 CrossRef CAS PubMed.
- I. Reviakine, W. Bergsma-Schutter, A. N. Morozov and A. Brisson, Langmuir, 2001, 17, 1680–1686 CrossRef CAS.
- I. Reviakine and A. Brisson, Langmuir, 2001, 17, 8293–8299 CrossRef CAS.
- J. Jass, T. Tjarnhage and G. Puu, Biophys. J., 2000, 79, 3153–3163 CrossRef CAS.
- I. Reviakine and A. Brisson, Langmuir, 2000, 16, 1806–1815 CrossRef CAS.
- S. Morandat and K. El Kirat, Colloids Surf., B, 2007, 55, 179–184 CrossRef CAS PubMed.
- E. I. Goksu and M. L. Longo, Langmuir, 2010, 26, 8614–8624 CrossRef CAS PubMed.
- M. C. Giocondi, D. Yamamoto, E. Lesniewska, P. E. Milhiet, T. Ando and C. Le Grimellec, Biochim. Biophys. Acta, Biomembr., 2010, 1798, 703–718 CrossRef CAS PubMed.
- M. L. Kraft, P. K. Weber, M. L. Longo, I. D. Hutcheon and S. G. Boxer, Science, 2006, 313, 1948–1951 CrossRef CAS PubMed.
- Y. F. Dufrene, D. Martinez-Martin, I. Medalsy, D. Alsteens and D. J. Müller, Nat. Methods, 2013, 10, 847–854 CrossRef CAS PubMed.
- H. J. Butt, Biophys. J., 1991, 60, 1438–1444 CrossRef CAS.
- V. Franz, S. Loi, H. Muller, E. Bamberg and H. H. Butt, Colloids Surf., B, 2002, 23, 191–200 CrossRef CAS.
- M. Rief, M. Gautel, F. Oesterhelt, J. M. Fernandez and H. E. Gaub, Science, 1997, 276, 1109–1112 CrossRef CAS.
- D. N. Ganchev, D. T. S. Rijkers, M. M. E. Snel, J. A. Killian and B. de Kruijff, Biochemistry, 2004, 43, 14987–14993 CrossRef CAS PubMed.
- F. Oesterhelt, D. Oesterhelt, M. Pfeiffer, A. Engel, H. E. Gaub and D. J. Müller, Science, 2000, 288, 143–146 CrossRef CAS.
- D. J. Müller, J. Helenius, D. Alsteens and Y. F. Dufrene, Nat. Chem. Biol., 2009, 5, 383–390 CrossRef PubMed.
- T. Ando, T. Uchihashi, N. Kodera, D. Yamamoto, A. Miyagi, M. Taniguchi and H. Yamashita, Pfluegers Arch., 2008, 456, 211–225 CrossRef CAS PubMed.
- A. Colom, I. Casuso, T. Boudier and S. Scheuring, J. Mol. Biol., 2012, 423, 249–256 CrossRef CAS PubMed.
- I. Casuso, J. Khao, M. Chami, P. Paul-Gilloteaux, M. Husain, J. P. Duneau, H. Stahlberg, J. N. Sturgis and S. Scheuring, Nat. Nanotechnol., 2012, 7, 525–529 CrossRef CAS PubMed.
- R. M. A. Sullan, J. K. Li and S. Zou, Langmuir, 2009, 25, 7471–7477 CrossRef CAS PubMed.
- H. J. An, M. R. Nussio, M. G. Huson, N. H. Voelcker and J. G. Shapter, Biophys. J., 2010, 99, 834–844 CrossRef CAS PubMed.
- S. Garcia-Manyes and F. Sanz, Biochim. Biophys. Acta, Biomembr., 2010, 1798, 741–749 CrossRef CAS PubMed.
- L. Picas, F. Rico and S. Scheuring, Biophys. J., 2012, 102, L1–L3 CrossRef PubMed.
- C. D. Frisbie, L. F. Rozsnyai, A. Noy, M. S. Wrighton and C. M. Lieber, Science, 1994, 265, 2071–2074 CAS.
- E. Dague, D. Alsteens, J. P. Latge, C. Verbelen, D. Raze, A. R. Baulard and Y. F. Dufrene, Nano Lett., 2007, 7, 3026–3030 CrossRef CAS PubMed.
- L. S. Dorobantu, S. Bhattacharjee, J. M. Foght and M. R. Gray, Langmuir, 2008, 24, 4944–4951 CrossRef CAS PubMed.
- P. L. T. M. Frederix, P. D. Bosshart, T. Akiyama, M. Chami, M. R. Gullo, J. J. Blackstock, K. Dooleweerdt, N. F. de Rooij, U. Staufer and A. Engel, Nanotechnology, 2008, 19, 384004–384013 CrossRef PubMed.
- D. E. Leckband, F. J. Schmitt, J. N. Israelachvili and W. Knoll, Biochemistry, 1994, 33, 4611–4624 CrossRef CAS.
- V. A. Parsegian, Langmuir, 1993, 9, 3625–3628 CrossRef CAS.
- T. J. McIntosh and S. A. Simon, Langmuir, 1996, 12, 1622–1630 CrossRef CAS.
- B. Rothenhausler and W. Knoll, Nature, 1988, 332, 615–617 CrossRef.
- M. P. Jonsson, P. Jonsson, A. B. Dahlin and F. Hook, Nano Lett., 2007, 7, 3462–3468 CrossRef CAS PubMed.
- F. Hook, G. Stengel, A. B. Dahlin, A. Gunnarsson, M. P. Jonsson, P. Jonsson, E. Reimhult, L. Simonsson and S. Svedhem, Biointerphases, 2008, 3, Fa108–Fa116 Search PubMed.
- H. J. Wu, J. Henzie, W. C. Lin, C. Rhodes, Z. Li, E. Sartorel, J. Thorner, P. D. Yang and J. T. Groves, Nat. Methods, 2012, 9, 1189–1191 CrossRef CAS PubMed.
- W. Wang, Y. Z. Yang, S. P. Wang, V. J. Nagaraj, Q. Liu, J. Wu and N. J. Tao, Nat. Chem., 2012, 4, 846–853 CrossRef CAS PubMed.
- A. Mashaghi, M. Swann, J. Popplewell, M. Textor and E. Reimhult, Anal. Chem., 2008, 80, 5276 CrossRef CAS.
- Z. Salamon, M. I. Brown and G. Tollin, Trends Biochem. Sci., 1999, 24, 213–219 CrossRef CAS.
- Z. Salamon and G. Tollin, Biophys. J., 2001, 80, 1557–1567 CrossRef CAS.
- D. D. Nolte, Optical interferometry for biology and medicine, Springer, New York, 2011 Search PubMed.
- K. Lindfors, T. Kalkbrenner, P. Stoller and V. Sandoghdar, Phys. Rev. Lett., 2004, 93, 037401 CrossRef CAS.
- V. Jacobsen, P. Stoller, C. Brunner, V. Vogel and V. Sandoghdar, Opt. Express, 2006, 14, 405–414 CrossRef CAS.
- H. Ewers, V. Jacobsen, E. Klotzsch, A. E. Smith, A. Helenius and V. Sandoghdar, Nano Lett., 2007, 7, 2263–2266 CrossRef CAS PubMed.
- P. Kukura, H. Ewers, C. Müller, A. Renn, A. Helenius and V. Sandoghdar, Nat. Methods, 2009, 6, 923–927 CrossRef CAS PubMed.
- F. V. Ignatovich and L. Novotny, Phys. Rev. Lett., 2006, 96, 013901 CrossRef.
- P. Kukura, M. Celebrano, A. Renn and V. Sandoghdar, J. Phys. Chem. Lett., 2010, 1, 3323–3327 CrossRef CAS.
- M. Celebrano, P. Kukura, A. Renn and V. Sandoghdar, Nat. Photonics, 2011, 5, 95–98 CrossRef CAS.
- M. Krishnan, N. Mojarad, P. Kukura and V. Sandoghdar, Nature, 2010, 467, 692–695 CrossRef CAS PubMed.
- J. Ortega-Arroyo and P. Kukura, Phys. Chem. Chem. Phys., 2012, 14, 15625–15636 RSC.
- C. W. Freudiger, W. Min, B. G. Saar, S. Lu, G. R. Holtom, C. W. He, J. C. Tsai, J. X. Kang and X. S. Xie, Science, 2008, 322, 1857–1861 CrossRef CAS PubMed.
- X. L. Nan, J. X. Cheng and X. S. Xie, J. Lipid Res., 2003, 44, 2202–2208 CrossRef CAS PubMed.
- H. W. Wang, Y. Fu, T. B. Huff, T. T. Le, H. F. Wang and J. X. Cheng, Vib. Spectrosc., 2009, 50, 160–167 CrossRef CAS PubMed.
- S. Begin, E. Belanger, S. Laffray, R. Vallee and D. Cote, J. Biophotonics, 2009, 2, 632–642 CrossRef CAS PubMed.
- A. Enejder, C. Brackmann and F. Svedberg, IEEE J. Sel. Top. Quantum Electron., 2010, 16, 506–515 CrossRef CAS.
- T. T. Le, H. M. Duren, M. N. Slipchenko, C. D. Hu and J. X. Cheng, J. Lipid Res., 2010, 51, 875 CAS.
- J. P. R. Day, K. F. Domke, G. Rago, H. Kano, H. O. Hamaguchi, E. M. Vartiainen and M. Bonn, J. Phys. Chem. B, 2011, 115, 7713–7725 CrossRef CAS PubMed.
- E. J. Blackie, E. C. Le Ru and P. G. Etchegoin, J. Am. Chem. Soc., 2009, 131, 14466–14472 CrossRef CAS PubMed.
- J. Kneipp, B. Wittig, H. Bohr and K. Kneipp, Theor. Chem. Acc., 2010, 125, 319–327 CrossRef CAS.
- K. Kneipp, H. Kneipp, I. Itzkan, R. R. Dasari and M. S. Feld, J. Phys.: Condens. Matter, 2002, 14, R597–R624 CrossRef CAS.
- M. S. Chazalet, M. Masson, C. Bousquet, G. Bolbach, Y. Ridente and J. Bolard, Thin Solid Films, 1994, 244, 852–856 CrossRef.
- C. S. Sweetenham, M. Larraona-Puy and I. Notingher, Appl. Spectrosc., 2011, 65, 1387–1392 CrossRef CAS PubMed.
- C. Mangeney, V. Dupres, Y. Roche, N. Felidj, G. Levi, J. Aubard and S. Bernard, Biopolymers, 2004, 74, 136–140 CrossRef CAS PubMed.
- L. Opilik, T. Bauer, T. Schmid, J. Stadler and R. Zenobi, Phys. Chem. Chem. Phys., 2011, 13, 9978–9981 RSC.
- B. Pettinger, P. Schambach, C. J. Villagomez and N. Scott, Annu. Rev. Phys. Chem., 2012, 63, 379–399 CrossRef CAS PubMed.
- C. H. Jiang, A. Gamarnik and C. P. Tripp, J. Phys. Chem. B, 2005, 109, 4539–4544 CrossRef CAS PubMed.
- C. F. Chen, C. H. Jiang and C. P. Tripp, Colloids Surf., B, 2013, 105, 173–179 CrossRef CAS PubMed.
- C. F. Chen and C. P. Tripp, Biochim. Biophys. Acta, Biomembr., 2012, 1818, 1673–1681 CrossRef CAS PubMed.
- V. A. Nadtochenko, A. G. Rincon, S. E. Stanca and J. Kiwi, J. Photochem. Photobiol., A, 2005, 169, 131–137 CrossRef CAS PubMed.
- S. G. Kazarian and K. L. A. Chan, Analyst, 2013, 138, 1940–1951 RSC.
- R. A. Walker, J. C. Conboy and G. L. Richmond, Langmuir, 1997, 13, 3070–3073 CrossRef CAS.
- K. A. Smith and J. C. Conboy, Anal. Chem., 2012, 84, 8122–8126 CrossRef CAS PubMed.
- X. K. Chen, W. Hua, Z. S. Huang and H. C. Allen, J. Am. Chem. Soc., 2010, 132, 11336–11342 CrossRef CAS PubMed.
- T. C. Anglin and J. C. Conboy, Biochemistry, 2009, 48, 10220–10234 CrossRef CAS PubMed.
- M. Sovago, G. W. Wurpel, M. Smits, M. Muller and M. Bonn, J. Am. Chem. Soc., 2007, 129, 11079–11084 CrossRef CAS PubMed.
- C. M. McQuaw, L. L. Zheng, A. G. Ewing and N. Winograd, Langmuir, 2007, 23, 5645–5650 CrossRef CAS PubMed.
- C. F. Majkrzak, N. F. Berk, S. Krueger and U. A. Perez-Salas, Neutron Scattering in Biology, Springer, Berlin Heidelberg, 2006, pp. 225–263 Search PubMed.
- S. Stanglmaier, S. Hertrich, K. Fritz, J. F. Moulin, M. Haese-Seiller, J. O. Radler and B. Nickel, Langmuir, 2012, 28, 10818–10821 CrossRef CAS PubMed.
- H. P. Vacklin, F. Tiberg, G. Fragneto and R. K. Thomas, Langmuir, 2005, 21, 2827–2837 CrossRef CAS PubMed.
- H. P. Wacklin, Langmuir, 2011, 27, 7698–7707 CrossRef CAS PubMed.
- H. P. Wacklin and R. K. Thomas, Langmuir, 2007, 23, 7644–7651 CrossRef CAS PubMed.
- K. Fritz, G. Fritz, B. Windschiegl, C. Steinem and B. Nickel, Soft Matter, 2010, 6, 4084–4094 RSC.
- B. Nickel, Biointerphases, 2008, 3, FC40–FC46 CrossRef PubMed.
- G. Fragneto, Eur. Phys. J.: Spec. Top., 2012, 213, 327–342 CrossRef CAS.
- G. Fragneto, T. Charitat and J. Daillant, Eur Biophys. J. Biophys. Lett., 2012, 41, 863–874 CrossRef CAS PubMed.
- N. Kucerka, M. P. Nieh, J. Pencer, T. Harroun and J. Katsaras, Curr. Opin. Colloid Interface Sci., 2007, 12, 17–22 CrossRef CAS PubMed.
- H. P. Wacklin, Curr. Opin. Colloid Interface Sci., 2010, 15, 445–454 CrossRef CAS PubMed.
- C. E. Miller, J. Majewski and T. L. Kuhl, Colloids Surf., A, 2006, 284, 434–439 CrossRef PubMed.
- T. L. Crowley, E. M. Lee, E. A. Simister and R. K. Thomas, Workshop on Methods of Analysis and Interpretation of Neutron Reflectivity Data, Argonne, IL, 1990.
- M. Landgren and B. Jonsson, J. Phys. Chem., 1993, 97, 1656–1660 CrossRef CAS.
- M. K. Baumann, E. Amstad, A. Mashaghi, M. Textor and E. Reimhult, Biointerphases, 2010, 5, 114–119 CrossRef CAS PubMed.
- A. P. Mosk, A. Lagendijk, G. Lerosey and M. Fink, Nat. Photonics, 2012, 6, 283–292 CrossRef CAS.
- A. Sell, R. Scheu, A. Leitenstorfer and R. Huber, Appl. Phys. Lett., 2008, 93, 251107 CrossRef.
- K. J. Tielrooij, N. Garcia-Araez, M. Bonn and H. J. Bakker, Science, 2010, 328, 1006–1009 CrossRef CAS PubMed.
- A. Mashaghi, P. Partovi-Azar, T. Jadidi, N. Nafari, P. Maass, M. R. R. Tabar, M. Bonn and H. J. Bakker, J. Chem. Phys., 2012, 136, 114709 CrossRef PubMed.
- A. Mashaghi, P. Partovi-Azar, T. Jadidi, N. Nafari, K. Esfarjani, P. Maass, M. R. R. Tabar, H. J. Bakker and M. Bonn, J. Phys. Chem. B, 2012, 116, 6455–6460 CrossRef CAS PubMed.
- E. Sezgin and P. Schwille, Mol. Membr. Biol., 2012, 29, 144–154 CrossRef CAS PubMed.
- S. Kaufmann, K. Ilg, A. Mashaghi, M. Textor, B. Priem, M. Aebi and E. Reimhult, Langmuir, 2012, 28, 12199–12208 CrossRef CAS PubMed.
- C. S. Sweetenham and I. Notingher, Spectrosc. Int. J., 2010, 24, 113–117 CrossRef CAS PubMed.
- L. B. Sagle, L. K. Ruvuna, J. M. Bingham, C. Liu, P. S. Cremer and R. P. Van Duyne, J. Am. Chem. Soc., 2012, 134, 15832–15839 CrossRef CAS PubMed.
- L. Li, H. F. Wang and J. X. Cheng, Biophys. J., 2005, 89, 3480–3490 CrossRef CAS PubMed.
| This journal is © The Royal Society of Chemistry 2014 |