 Open Access Article
Creative Commons Attribution 3.0 Unported Licence
The structure of insulin at the air/water interface: monomers or dimers?
S.
Mauri
ab,
T.
Weidner
b and
H.
Arnolds
*a
aThe University of Liverpool, Chemistry Department, Surface Science Research Centre, Liverpool, UK. E-mail: Heike.Arnolds@liv.ac.uk
bMax Planck Institute for Polymer Research, Mainz, Germany
First published on 3rd November 2014
Abstract
The hydrophobic character of the air/water interface affects the oligomeric composition of insulin. By using interface-specific vibrational sum frequency spectroscopy and calculations of insulin monomer and dimer second-order nonlinear susceptibilities χ(2), we show that insulin monomers segregate to the air/water interface.
Insulin is a small peptide which regulates glycemia in the blood. Its denaturation and aggregation is an intensively studied problem, yet mechanistic details are still elusive.1,2 In solution, insulin is present as monomers, dimers and hexamers,3 but only monomers undergo denaturation and aggregation.4 The association state of insulin is also critical to denaturation at hydrophobic interfaces. Sluzky et al.5 found an increase in insulin stability at higher concentrations at both air/water and teflon/water interfaces due to the decreasing fraction of monomers. Subsequent work repeatedly demonstrated that monomeric insulin is the key species in the denaturation and aggregation process for both solid/liquid and air/water interfaces.6,7 The interaction of hydrophobic domains on the insulin monomer with hydrophobic interfaces is generally considered to be the driving force for monomer adsorption, since these domains are protected from both solvent and interfaces in the dimer and hexamer.
Despite the key role of the insulin monomer in aggregation and fibril formation at interfaces, its presence is difficult to ascertain spectroscopically. An external reflection absorption infrared study of insulin at the air/water interface recently detected a high α-helix content in the amide I spectra and proposed that insulin exists as monomers at the air/water interface.8 However, the only real structural difference between monomer and dimer is the interfacial β-sheet which forms upon dimerisation and consists of 8 amino acids in the B chain of insulin (B23–B30).3 Due to its short length, the β-sheet amide I spectral signature in the dimer overlaps strongly with the α-helix one and cannot be separated by linear infrared spectroscopy. Ganim et al.9 showed for bulk insulin solutions that only two-dimensional IR with its higher spectral resolution was capable of distinguishing the perpendicular β-sheet vibration at 1645 cm−1 from the α-helix at 1657 cm−1. They could thus follow the insulin monomer/dimer equilibrium in the bulk over a wide range of concentrations. For bulk solutions, a detailed analysis of circular dichroism (CD) spectra can also be used to derive the oligomeric composition,10 but this method is not sensitive enough for interfaces.
Here we use infrared-visible sum frequency generation spectroscopy (SFG) to identify which insulin oligomeric species are present at the air/water interface. SFG is a vibrational spectroscopy that has been used extensively for determining the secondary structure of peptides and proteins at solid/liquid, air/liquid and liquid/liquid interfaces.11–14
SFG has a sensitivity comparable to infrared spectroscopy,15 but possesses the added advantage that it is surface specific due to its optical selection rules. As a second order nonlinear optical process, where an infrared and a visible photon are absorbed and an anti-Stokes Raman photon is emitted, SFG requires a lack of inversion symmetry to generate a signal. It therefore only detects vibrations from molecular layers with a net orientation at interfaces. Since the change in hydrophobicity across the air/water interface is the main driver for insulin to orient at the interface, we would expect only a single adsorbed layer to contribute to the signal.
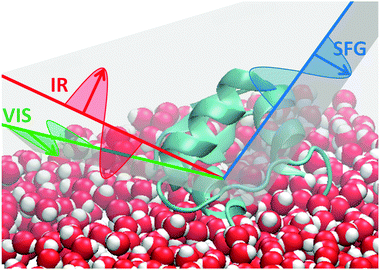
Briefly, the SFG process consists of mixing two laser pulses at an interface (see Fig. 1). A broadband tunable IR pulse and a narrowband visible pulse are overlapped temporally and spatially onto a surface. Photons at the sum frequency wavelength are generated by oriented interfacial molecules only and detected.16 When the IR photons match one of the molecular vibrational frequencies, the SF signal is enhanced through resonance. The signal is proportional to the square of the second-order nonlinear susceptibility:
| ISF ∝ |χ(2)|2 | (1) |
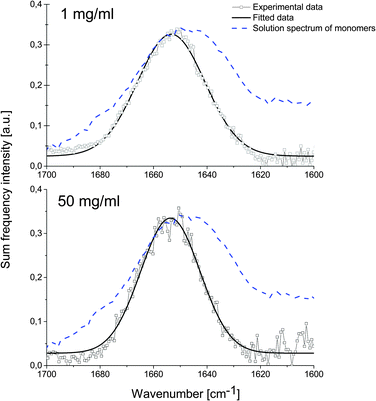
We investigate human insulin (HI) adsorbed from solution to the air/water interface at different protein concentrations. We chose to adsorb from solution to better represent conditions found during agitation-accelerated insulin fibrillation.7 All solutions have been prepared in deuterated water, so that the amide I band does not overlap with the –OH bending mode of water. The spectra have been measured using ssp polarisation combination (as sketched in Fig. 1), meaning that polarisations of the sum frequency and visible light are perpendicular to the propagation plane while the IR polarisation is parallel to it. In Fig. 2, we show the recorded spectra which reveal that the SF intensity does not change with concentration of bulk solutions (1 mg ml−1 or 50 mg ml−1). At 1 mg ml−1, the bulk solution consists of nearly 100% monomers, at 50 mg ml−1, there are equal amounts of monomers and dimers.9
 | ||
| Fig. 1 Sketch of a SFG experiment at the air water interface. Red: IR beam is p-polarised. Green and blue: s-polarised visible and SF beams. | ||
The spectra recorded at 1 mg ml−1 (Fig. 2 – top) and 50 mg ml−1 (Fig. 2 – bottom) show a peak in the amide I region at (1654 ± 1) cm−1 (FWHM = 29 ± 1 cm−1) and (1653 ± 1) cm−1 (FWHM = 26 ± 3 cm−1), respectively. The amide I band lies in both cases at the same frequency, which is characteristic for the mostly helical structure of HI in its native state. The difference to the bulk FT-IR spectrum is caused by the requirement of the detected vibration to be both infrared and Raman active, which changes the overall appearance of the amide I mode. When the protein concentration is high (50 mg ml−1), the SF spectrum shows a narrower amide I band. This could be attributed to a more ordered protein layer at the air/water interface.
The integrated peak intensities are very similar, specifically (8.5 ± 0.2) a.u. and (9.7 ± 0.9) a.u. for 1 mg ml−1 and 50 mg ml−1 solutions respectively, despite a 25 times higher monomer content. This suggests that only one species of insulin saturates the interface already at low bulk concentration and this species is most likely the monomer.
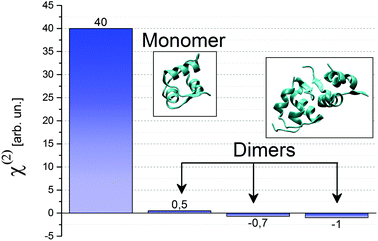
How can we tell which oligomeric species is bound to the surface? Insulin monomers and dimers can be discriminated easily in SFG, since the symmetry inherent in the insulin dimer renders it almost invisible in a SF experiment. A first intuitive explanation is based on the fact that the two α-helices in the A chain have equally strong dipole moments aligned along the helix, but opposite in sign. Therefore these two contributions generate sum frequency light with 180° phase difference and therefore cancel each other (see Fig. 3). Only the α-helix in the B chain is detectable with SFG. In the case of a dimer, also the contributions from the helices in the B chain destructively interfere, as they run in opposite directions. The only feature that could be SFG active is the antiparallel β-sheet that forms at the hydrophobic interface between monomers in a single dimer. Therefore the total χ(2) for an insulin dimer is expected to be quite small. If dimers were also present at the surface, we would then expect a reduction of the SFG signal accordingly. This is not the case.
 | ||
| Fig. 3 Calculated χ(2)ssp for a insulin monomer with the hydrophobic surface pointing towards the air/water interface, and for insulin dimers with various orientations. The pdb files used in the calculations are 2JV1 for the monomer and 4INS for the dimers. | ||
For a more quantitative discussion we calculated the intensity of the various χ(2) components. Simpson's group at Purdue University17,18 has developed a plug-in to be used with the Chimera software19 to compute the χ(2) tensor elements of a protein in the lab coordinate frame given its protein data bank (pdb) file. We can thus compare the SF signal expected from dimers and monomers, assuming identical orientation for both oligomeric species.
In Fig. 3 we show the tensor element for ssp polarisation combination calculated for both monomers and dimers. Since a dimer has a complete hydrophilic surface, we do not expect it to have a specific orientation at the air/water interface, while we assume the monomer to be oriented in such a way that its hydrophobic interface is exposed to the air phase. We compute χ(2)ssp,monomer for the mentioned orientation, and compare it to χ(2)ssp,dimer, shown in Fig. 3 for three randomly chosen orientations. In all cases χ(2)ssp,dimer is between 40 and 80 times smaller than the one for the monomer, in accordance with the intuitive explanation given earlier. Since the SF intensity depends quadratically on the χ(2) (see eqn (1)) the expected signal for dimers between 1600 and 6400 times smaller than the one for monomers. We can therefore confidently attribute the peak at 1653 cm−1 to insulin monomers at the air/water interface. We propose that insulin monomers segregate to the surface. The segregation is most likely driven by the entropy gain of exposing the hydrophobic area of the protein surface to air.20
Since monomers are known to be the least stable insulin species with regards to denaturation and aggregation, this surface segregation of the monomer is likely the deeper reason why agitation and the concomitant formation of a large air/water surface area accelerates insulin fibril formation.5,7 The preferential adsorption of hydrophobic protein domains to the air/water interface, even before unfolding occurs, could also be responsible for its role as a general rate-limiting reagent in protein aggregation.21–23
In conclusion, we used SFG to determine that the insulin monomer segregates to the air/water interface by a quantitative comparison of spectra in the amide I region. This finding solves a long-standing puzzle why insulin has a propensity to form fibrils at the air/water interface.
S. M. would like to acknowledge DAAD for funding part of this project. We acknowledge Sanofi GmbH for providing human insulin.
References
- J. L. Jiménez, E. J. Nettleton, M. Bouchard, C. V. Robinson, C. M. Dobson and H. R. Saibil, Proc. Natl. Acad. Sci. U. S. A., 2002, 99, 9196–9201 CrossRef PubMed.
- L. Nielsen, R. Khurana, a. Coats, S. Frokjaer, J. Brange, S. Vyas, V. N. Uversky and a. L. Fink, Biochemistry, 2001, 40, 6036–6046 CrossRef CAS PubMed.
- J. Brange, L. Andersen, E. D. Laursen, G. Meyn and E. Rasmussen, J. Pharm. Sci., 1997, 86, 517–525 CrossRef CAS PubMed.
- J. L. Whittingham, D. J. Scott, K. Chance, A. Wilson, J. Finch, J. Brange and G. Guy Dodson, J. Mol. Biol., 2002, 318, 479–490 CrossRef CAS.
- V. Sluzky, J. A. Tamada, A. M. Klibanov and R. Langer, Proc. Natl. Acad. Sci. U. S. A., 1991, 88, 9377–9381 CrossRef CAS.
- P. Nilsson, T. Nylander and S. Havelund, J. Colloid Interface Sci., 1991, 144, 145–152 CrossRef CAS.
- L. Nielsen, S. Frokjaer, J. F. Carpenter and J. Brange, J. Pharm. Sci., 2001, 90, 29–37 CrossRef CAS.
- S. Johnson, W. Liu, G. Thakur, A. Dadlani, R. Patel, J. Orbulescu, J. D. Whyte, M. Micic and R. M. Leblanc, J. Phys. Chem. B, 2012, 116, 10205–10212 CrossRef CAS PubMed.
- Z. Ganim, K. C. Jones and A. Tokmakoff, Phys. Chem. Chem. Phys., 2010, 12, 3579–3588 RSC.
- Y. Pocker and S. B. Biswas, Biochemistry, 1980, 19, 5043–5049 CrossRef CAS.
- P. B. Miranda and Y. R. Shen, J. Phys. Chem. B, 1999, 103, 3292–3307 CrossRef CAS.
- Y. Liu, J. Jasensky and Z. Chen, Langmuir, 2012, 28, 2113–2121 CrossRef CAS PubMed.
- X. Chen, M. L. Clarke, J. Wang and Z. Chen, Int. J. Mod. Phys. B, 2005, 19, 691–713 CrossRef CAS.
- T. Weidner, N. F. Breen, K. Li, G. P. Drobny and D. G. Castner, Proc. Natl. Acad. Sci. U. S. A., 2010, 107, 13288–13293 CrossRef CAS PubMed.
- J. Wang, M. A. Even, X. Chen, A. H. Schmaier, J. H. Waite and Z. Chen, J. Am. Chem. Soc., 2003, 125, 9914–9915 CrossRef CAS PubMed.
- H. Arnolds and M. Bonn, Surf. Sci. Rep., 2010, 65, 45–66 CrossRef CAS PubMed.
- R. D. Wampler, A. J. Moad, C. W. Moad, R. Heiland and G. J. Simpson, Acc. Chem. Res., 2007, 40, 953–960 CrossRef CAS PubMed.
- A. J. Moad, C. W. Moad, J. M. Perry, R. D. Wampler, G. S. Goeken, N. J. Begue, T. Shen, R. Heiland and G. J. Simpson, J. Comput. Chem., 2007, 28, 1996–2002 CrossRef CAS PubMed.
- E. F. Pettersen, T. D. Goddard, C. C. Huang, G. S. Couch, D. M. Greenblatt, E. C. Meng and T. E. Ferrin, J. Comput. Chem., 2004, 25, 1605–1612 CrossRef CAS PubMed.
- D. Chandler, Nature, 2005, 437, 640–647 CrossRef CAS PubMed.
- Y. F. Maa and C. C. Hsu, Biotechnol. Bioeng., 1997, 54, 503–512 CrossRef CAS.
- M. J. Treuheit, A. A. Kosky and D. N. Brems, Pharm. Res., 2002, 19, 511–516 CrossRef CAS.
- J. Wiesbauer, R. Prassl and B. Nidetzky, Langmuir, 2013, 29, 15240–15250 CrossRef CAS PubMed.
| This journal is © the Owner Societies 2014 |

