 Open Access Article
Molecular dynamics simulation of spin–lattice NMR relaxation in poly-L-lysine dendrimers: manifestation of the semiflexibility effect
Denis A.
Markelov
 *a,
Stanislav G.
Falkovich
b,
Igor M.
Neelov
bc,
Maxim Yu.
Ilyash
b,
Vladimir V.
Matveev
a,
Erkki
Lähderanta
d,
Petri
Ingman
e and
Anatolii A.
Darinskii
bc
aFaculty of Physics, St. Petersburg State University, Ulyanovskaya Str. 1, Petrodvorets, St. Petersburg, 198504 Russia. E-mail: markeloved@gmail.com
bInstitute of Macromolecular Compounds, Russian Academy of Sciences, Bolshoi Prospect 31, V.O., St. Petersburg, 199004 Russia. E-mail: a.darinskii@mail.ru
cSt. Petersburg National Research University of Information Technologies, Mechanics and Optics (ITMO University), Kronverkskiy pr. 49, St. Petersburg, 197101, Russia. E-mail: i.neelov@mail.ru
dLaboratory of Physics, Lappeenranta University of Technology, Box 20, 53851 Lappeenranta, Finland. E-mail: erkki.lahderanta@lut.fi
eInstrument Centre, Department of Chemistry, University of Turku, Vatselankatu 2, FI-20014, Turku, Finland. E-mail: pingman@utu.fi
First published on 8th December 2014
Abstract
NMR relaxation experiments are widely used to investigate the local orientation mobility in dendrimers. In particular, the NMR method allows one to measure the spin–lattice relaxation rate, 1/T1, which is connected with the orientational autocorrelation function (ACF) of NMR active groups. We calculate the temperature (Θ) and frequency (ω) dependences of the spin–lattice NMR relaxation rates for segments and NMR active CH2 groups in poly-L-lysine (PLL) dendrimers in water, on the basis of full-atomic molecular dynamics simulations. It is shown that the position of the maximum of 1/T1(ω) depends on the location of the segments inside the dendrimer. This dependence of the maximum is explained by the restricted flexibility of the dendrimer. Such behavior has been predicted recently by the analytical theory based on the semiflexible viscoelastic model. The simulated temperature dependences of 1/T1 for terminal and inner groups in PLL dendrimers of n = 2 and n = 4 generations dissolved in water are in good agreement with the NMR experimental data, which have been obtained for these systems previously by us. It is shown that in the case of PLL dendrimers, the traditional procedure of the interpretation of NMR experimental data – when smaller values of 1/T1 correspond to higher orientation mobility – is applicable to the whole accessible frequency interval only for the terminal groups. For the inner groups, this procedure is valid only at low frequencies.
I. Introduction
Dendrimers are perfect, tree-like macromolecules with a well-controlled chemical structure, which have been synthesized more than 30 years ago.1–5 Due to their spherical symmetry and compactness, on the one hand, and their softness, on the other, they are intermediate entities between colloids and linear polymers. They can be used in various industrial applications, such as biomedicine,6–10 energy harvesting,11–13 catalysis,14,15 and other fields.16–18The relaxation properties of dendrimers are of considerable importance in many practical applications.19–23 Even for a single dendrimer macromolecule, there are many relaxation processes with different lengths and time scales, starting from the rotation as a whole to the local segmental mobility. Different experimental methods are used to describe distinctive features of dendrimers (see e.g.ref. 24–26).
NMR relaxation experiments are widely used to study local orientation mobility in dendrimers.27–38 In particular, the NMR method allows one to measure the spin–lattice relaxation rate, 1/T1, which is connected with the orientational autocorrelation function (ACF) of NMR active groups.
The traditional approach to estimate the mobility of NMR active groups is the measurement of 1/T1 at a fixed temperature and frequency.13,27–29 In this approach, the lower 1/T1 value corresponds to the higher mobility. However, Pinto et al.37 have shown that the application of this approach can lead to misinterpretations. It has been experimentally established for poly(aryl ether) dendrimers that a direct correlation exists only between the spin–spin relaxation time (T2), or the nuclear Overhauser effect (NOE), and the mobility of the NMR active groups. These characteristics have a monotonic dependence on the layer number in the dendrimer. However, 1/T1 has a non-monotonic layer number dependence at room temperature. The reason for this behavior is the fact that the dependence of 1/T1 on a reciprocal temperature has a maximum.39 Therefore, the mentioned procedure can be applied only when the measured 1/T1 values are located on the left side of the maximum. In particular, this situation is realized in solutions of linear polymers. However, for dendrimers the position of the measured 1/T1 values with respect to the maximum can depend on the chemical structure of the dendrimer and on the location of the NMR active groups inside the dendrimer. As reported for poly(aryl ether),37 the non-monotonic behavior takes place due to the fact that the values of 1/T1, measured for different layers correspond to different sides of the temperature dependence with respect to the maximum. Similar behavior was observed for other dendrimers, as well.32,35,36 Therefore, for the correct interpretation of the 1/T1 data of dendrimers, the temperature dependence of 1/T1 is necessary.
Although there are many experimental studies on the NMR relaxation in dendrimers, the number of theoretical investigations in this field is insufficient. As a rule, the theory considers the frequency dependence of 1/T1 at a constant temperature in contrast to the NMR experiments, where the temperature dependence at a fixed frequency, ω, is studied. In this case, the maximum is observed on the frequency dependence of the reduced spin–lattice relaxation rate of 1H atoms:
 | (1) |
Recently, some progress has been made in the theoretical studies of the orientational mobility of dendrimers,41–45 which provides an insight into the factors influencing the position of the maximum.46,47 In particular, it has been established46 that the frequency dependence of [1/T1] for a labeled segment of a dendrimer is determined by three processes with different characteristic times. The first process corresponds to the local reorientation motions of the segment with the relaxation time, τloc, which does not practically depend on the dendrimer size and on the topological location of the segment. The second process correlates with the rotation of a dendrimer branch that originates from this segment, where the characteristic time, τbr, of this process depends only on the branch size. The last process is the rotation of a dendrimer as a whole with the characteristic time, τrot, which depends on the dendrimer size. These results were obtained for the following dendrimer models: (i) the viscoelastic model consisting of the Gaussian subchains, and (ii) the freely jointed bead–rod model. The first model was considered in terms of the analytical theory, while the second one was simulated by the Brownian dynamics method. Dendrimers up to the generation number n = 4 were studied.
On the basis of these results, the frequency dependences of [1/T1] for segments of a dendrimer belonging to different dendrimer layers were calculated. For both models, the independence of ωmax from n and from the location of the segment inside a dendrimer was demonstrated. This independence is explained by the fact that ωmax is mainly determined by the local reorientation motions of the segment. Therefore, one can expect39 that the position of the temperature maximum of [1/T1] at ω = const is also insensitive to n and to the segment location. However, this prediction does not agree with the experimental data.32,35–37
It has been assumed47 that this discrepancy is connected with a restricted flexibility (semiflexibility) of a dendrimer. The effect of the dendrimer semiflexibility has been introduced into the viscoelastic model through the correlations between orientations of segments belonging to different dendrimer layers,48–50
| |〈uiuj〉| = qk, | (2) |
It is necessary to bear in mind, however, that these conclusions have been drawn for the viscoelastic model, where the volume and hydrodynamic interactions are not taken into account. Moreover, the viscoelastic model describes incorrectly the third process, i.e. the rotation of a dendrimer as a whole.46
In the present work, we study the behavior of [1/T1] for segments of the poly-L-lysine (PLL) dendrimer on the basis of the full-atomic molecular dynamic (MD) simulations. It is shown that these dendrimers exhibit different positions of the maxima of the 1/T1 frequency and temperature dependences for terminal and inner segments. We explain such a difference by the restricted flexibility of the PLL dendrimers.
This paper is structured as follows: in Section II we briefly describe the model and simulation details. Section III is devoted to our results and their discussion. Eventually, Section IV contains the conclusions. Some calculation details are presented in Appendices A and B.
II. Molecular dynamic simulation details
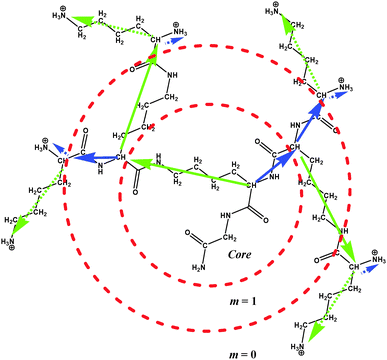
The chemical structure of PLL dendrimers is shown in Fig. 1. There are two segments originating from every branching point, which are characterized by different lengths. The inner longer segments are about 2.5 times larger than the shorter ones. The length ratio of terminal segments is close to 5.In this paper, the numeration of dendrimer layers, m, in every dendrimer starts from the periphery to the core, i.e. m = 0 corresponds to the terminal layer and m = n corresponds to the core (see Fig. 1).
The detailed description of the full-atomic model of the PLL dendrimer used in this work, and the simulation method, including the preparation and equilibration of the system, has been given in our previous work.51 In brief, the dendrimers of n = 2–5 generations with protonated NH3+ terminal groups were studied in the dilute water solution. Some parameters of the dendrimers are collected in Table 1. The cubic simulation box contains a single dendrimer molecule and water molecules together with Cl− counterions. The number of Cl− counterions is equal to the number of charged NH3+ terminal groups in the dendrimers. For the simulation of water molecules, a TIP3P model52 was used. The periodical boundary conditions and the Amber99sb-ildn force field were used,53 and calculations were performed in the NPT ensemble. Trajectories at 300 K for n = 2–5 and at Θ = 283, 323, 343 and 363 K for n = 2 and 4 were obtained. Here and thereafter, Θ is the absolute temperature. The Gromacs-4.5.5 package was used for our simulations.54 First, 50 ns of each MD simulation were applied for the equilibration of the system, and final 150 ns for calculations of the system characteristics. The sizes of the n = 2–4 dendrimers, obtained from our simulation, are in good agreement with the experimental data.55 Our results for the n = 3 dendrimer agree also with those obtained in ref. 56.
| n | M (g mol−1) | N in | N t |
|---|---|---|---|
| 2 | 2028 | 15 | 16 |
| 3 | 4095 | 31 | 32 |
| 4 | 8229 | 63 | 64 |
| 5 | 16![[thin space (1/6-em)]](https://www.rsc.org/images/entities/char_2009.gif) 496 496 |
127 | 128 |
In the PLL dendrimer, the lengths of segments in the same dendrimer layer are different in contrast to the theoretical model,47 where all segments have the same length. We believe that this difference is not important for the effect of the semiflexibility on the segmental orientation mobility. This assumption is supported by similar characteristics of the orientation mobility of the long and short segments belonging to the same layer in the PPL dendrimer.40
Semiflexibility parameter
In order to compare our simulation results with the predictions of the semiflexible viscoelastic theory,47 which were obtained for the semiflexibility parameter q = 0.45 in eqn (2), it is necessary to estimate the value of q for the PLL dendrimer with the results of our MD simulation.We have calculated the average angle, θ, between the neighboring segments belonging to two successive dendrimer layers (Table 2). The value of θ averaged over different n values is found to be equal to 119°, which corresponds to q = 0.48 in eqn (2). This value is close to q = 0.45 (θ = 117°) used in ref. 47. Therefore, we can compare directly our simulation results with the theoretical calculations performed in ref. 47.
| Θ (K) | θ (degrees) | |||
|---|---|---|---|---|
| n = 2 | n = 3 | n = 4 | n = 5 | |
| 283 | 118 ± 4 | — | 122 ± 3 | — |
| 300 | 118 ± 4 | 120 ± 2 | 120 ± 2 | 120 ± 2 |
| 323 | 119 ± 2 | — | 121 ± 1 | — |
| 343 | 118 ± 4 | — | 120 ± 1 | — |
| 363 | 118 ± 5 | — | 120 ± 1 | — |
Theory of the spin–lattice NMR relaxation
The spin–lattice 1H NMR relaxation for NMR active groups in terms of the dipole–dipole interaction of relaxation is given by the following equation:39 | (3) |
 | (4) |
 | (5) |
If P2(t) is represented by the sum of exponents,
 | (6) |
 | (7) |
III. Results and discussion
Comparison with the analytical theory
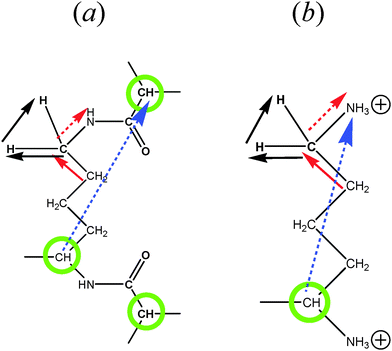
The minimum length scale of the viscoelastic model corresponds to the length of a single segment. Therefore, to compare with the analytical theory it is necessary to study the reorientation of the unit vectors directed along the segments (Fig. 2), i.e.u(t) = rs(t)/|rs(t)| in the PLL dendrimers. We consider the reduced relaxation rate, [1/T1H], given by eqn (1) as well as in ref. 46 and 47. The calculation methods of [1/T1H] at different frequencies ω for the segments belonging to different dendrimer layers, using the simulation data, are described in Appendix A.Fig. 3 shows the frequency dependences of [1/T1H] for the segments belonging to different dendrimer layers m of the PLL dendrimers with different n. It can be seen that the position of [1/T1H] maximum ωmax depends on the layer number, m (Fig. 3a). When m increases, ωmax shifts towards lower frequencies.
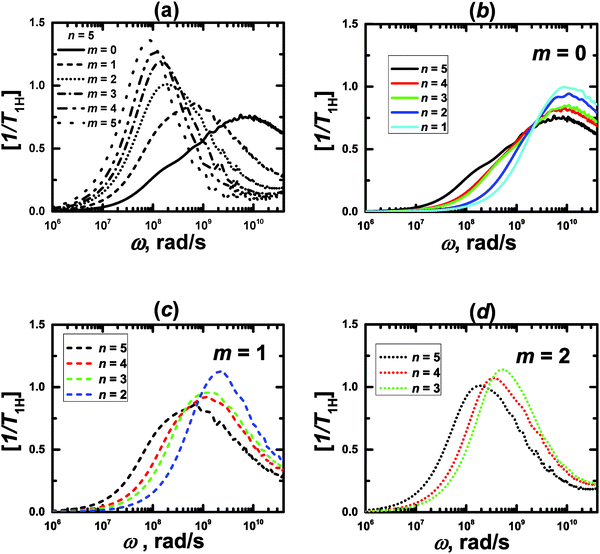 | ||
| Fig. 3 Frequency dependences of [1/T1H] for the segments of lysine dendrimers. MD simulation results. | ||
This result agrees qualitatively with the predictions of the analytical theory for the semiflexible viscoelastic model of the dendrimer.47 Here we recall that the flexible viscoelastic model predicts the independence of ωmax from m.
As in the viscoelastic model, the simulated ωmax for the terminal segments (m = 0) is practically independent from n (Fig. 3b). Hence, we can use the value of ωmax(m = 0) = ω0 as the reference point in order to compare the results of the analytical theory with the simulations. Fig. 4 shows the values of ωmax/ω0 for different m and n obtained from the theory47 for the semiflexible dendrimer and our simulation results. It can be seen that the overall trend is the same: ωmax/ω0 decreases with increasing m. However, there are some differences between the theory and the simulation. First, the simulation demonstrates that ωmax for given m depends on the overall generation number n of a dendrimer, in contrast to the theory predictions about the insensitivity of ωmax(m = const) to n. Second, the theory predicts a more rapid decrease of ωmax with m for m ≥ 2 than that obtained with the simulations.
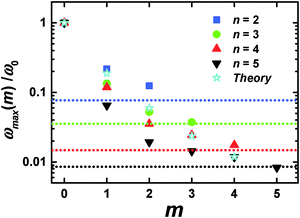 | ||
| Fig. 4 The position of the [1/T1H] maxima for different m and n. Dotted horizontal lines mark ωrot and correspond to n with the same color; ω0 = ωmax(m = 0). MD simulation and analytical theory47 results. | ||
The following connects these differences with the simplifications used in the viscoelastic dendrimer model. First, the model does not take into account the excluded volume and hydrodynamic interactions (the phantom and free-draining model). Therefore, the segments in this model do not “feel” the local concentration of surrounding segments in the dendrimer. However, this concentration can depend on n for the segments with the same m, and affect their orientation mobility. Our previous simulation shows51 that the average density of PLL dendrimers grows with n. Therefore, the local concentration of dendrimer monomers in internal layers is expected to increase as well, which could lead to an increase of τbr due to additional friction between the branch and other segments of the dendrimer and a decrease of ωmax.
The second defect of the viscoelastic model is its inability to describe correctly the contribution of the dendrimer rotation as a whole to the segment relaxation. The simulations of the coarse-grained dendrimer models46 in solution show that this contribution can be quite significant. The values of τrot for the PLL dendrimers with n = 2−5 at 300 K, calculated in Appendix B, are collected in Table 3.
| n | τ rot (ns) |
|---|---|
| 2 | 0.8 ± 0.04 |
| 3 | 1.7 ± 0.1 |
| 4 | 4.2 ± 0.2 |
| 5 | 7.2 ± 0.2 |
If the orientational relaxation of a segment is determined only by the dendrimer rotation as a whole, ωmax will be equal to ωrot related to τrot with the expression
 | (8) |
Finally, we can conclude that the shift of ωmax towards lower frequencies with the increase of m observed in the simulations can be described by the effect of the semiflexibility, predicted by the analytical viscoelastic model.47 For the segments lying close to the dendrimer core, this shift is decreased due to the increased contribution of the dendrimer rotation as a whole.
Spin–lattice NMR relaxation of CH2 groups
MD simulations of the full-atomic model allow the study not only of the reorientation of the segments, but also of the mobility of NMR active groups. We focus mainly on the mobility of rHH vectors in CH2 groups (which are connected to N atoms) for the PLL dendrimer in water. The temperature dependences of 1/T1H for these rHH vectors were measured in our NMR experiments.40The method of the spin–lattice NMR relaxation allows one to measure proton relaxation time, T1H, separately for groups with different chemical shifts, i.e. with different peak positions of the 1H NMR spectrum. The value of the shift for the same group depends on the chemical structure of its environment. In principle, the NMR active groups located in different dendrimer layers may correspond to different peaks. In particular, this situation is realized for poly(aryl ether) dendrimers.37 It allows the mobility in every dendrimer layer to be studied separately. In the case of the PLL dendrimer, there is a remarkable difference of the chemical shifts between terminal and inner CH2–N groups, but it is difficult to distinguish the difference between inner layers (see ESI).
Therefore, to compare the simulation data with the experimental spin–lattice relaxation rate for the inner CH2–N groups, [1/Tinn1H], we have to use in eqn (5) the function Pinn2(t) averaged over all inner groups:
 | (9) |
We have calculated frequency dependences of [1/Tinn1H] and [1/Tter1H] at different temperatures, Θ, for CH2 groups in PLL dendrimers by using eqn (3)–(5) and (9) with a unit vector u(t) = rHH(t)/|rHH(t)|. Here, [1/Tter1H] depends on rHH of the terminal long groups (see Fig. 2b). The details of the calculations are described in Appendix A.
For both studied dendrimers (n = 2 and 4) at all temperatures, the positions of ωmax of the maximum of [1/T1H] for the rHH vectors of the CH2 terminal groups are shifted to higher frequencies with respect to those of the CH2 inner groups (Fig. 5). Therefore, the shift of ωmax with increasing dendrimer layer number, observed above for the segments, takes place also for the NMR active groups. We believe that in both cases this shift is the manifestation of the dendrimer semiflexibility effect.
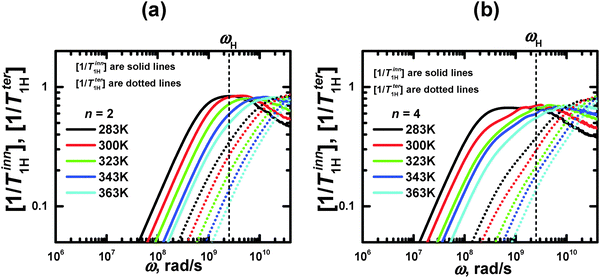 | ||
| Fig. 5 Frequency dependences of [1/T1H] for 2 groups of inner and terminal segments of lysine dendrimers with n = 2 and 4. The vertical dotted line indicates the frequency (ωH/2π = 400 MHz) corresponding to the spectrometer used in ref. 40. | ||
For the same segments, the values of ωmax for rHH exceed those for rs (Fig. 6). However, this difference is not connected with the different sizes of the CH2 groups and segments. Therefore, we have calculated the frequency dependences of the [1/T1H] functions for rCC, which has approximately the same length as rHH (Fig. 6). It can be seen that these dependences practically coincide with those for rs. At the same time, the frequency dependences of [1/T1H] for rHH are shifted towards higher values. We believe that this difference can be explained by the fact that the reorientations of the rHH vectors correspond to transversal modes, in contrast to those of rs, which are determined by longitudinal modes. As has been shown in several studies (see e.g.ref. 58), the transversal modes are considerably faster than the longitudinal ones.
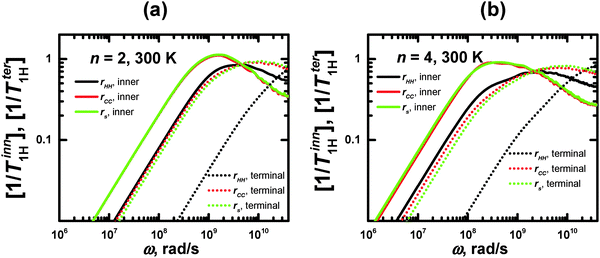 | ||
| Fig. 6 Frequency dependences of 1/T1H for rHH, rCC, and rs, calculated for inner and terminal segments of lysine dendrimers with n = 2 and 4 at 300 K. | ||
Comparison with NMR experimental data
Here we compare the results of the MD simulations with the experimental results obtained in our work.40 The circle frequency of the spectrometer, which is used in ref. 40 was ωH/2π = 400 MHz. In Fig. 5 this frequency is marked by a vertical dotted line. The crossing points of the simulated frequency dependences of [1/T1H] at different temperatures with this line give the values of [1/T1H] corresponding to those obtained experimentally. For the direct comparison of our results with experimental data, it is necessary to know the value of A0 in eqn (3). In the case of the CH2 groups,39,57 this constant is given by the expression | (10) |
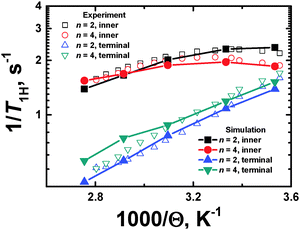 | ||
| Fig. 7 Plots of 1/T1Hvs. inverse temperature (1000/Θ) for terminal and inner CH2 groups. The NMR experimental data40 and the MD simulation results are shown. | ||
The temperature dependences, 1/T1H(Θ−1), for the inner and terminal groups of the PLL dendrimers were obtained at the fixed frequency (ωH/2π = 400 MHz). However, the shape and the relative positions of the 1/T1H(Θ−1) curves depend not only on the location of the active groups inside a dendrimer, but on the spectrometer frequency ωH/2π, as well. In particular, the consideration of the temperature dependence at different frequencies has been performed in ref. 37.
Using the calibration value of A0, we obtained temperature dependences of 1/T1H at ωH/2π = 100, 1000, and 1600 MHz (Fig. 8).
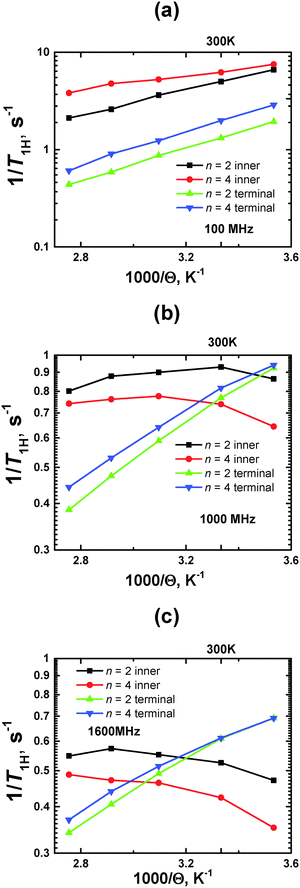 | ||
| Fig. 8 Plots of 1/T1Hvs. inverse temperature (1000/Θ) for terminal and inner CH2 groups at different ωH/2π = 100, 1000 and 1600 MHz. MD simulation results. | ||
At a smaller frequency ωH/2π = 100 MHz, the curves for the inner groups are located higher along the vertical axis, than those for terminal groups, within the whole temperature interval. At higher frequencies (ωH/2π ≥ 400 MHz), these curves cross each other, where the crossing points are shifted to higher temperatures with increasing frequency.
As was mentioned in the Introduction, the traditional approach to characterize the mobility of different parts of dendrimers by NMR relaxation focuses on the comparison of the 1/T1H values at the same (room) temperature (see e.g.ref. 13 and 27–29). It is assumed that the lower value of 1/T1H corresponds to the higher mobility. This assumption is completely correct if the measured 1/T1H values are located on the left side of the 1/T1H(Θ−1) maximum. This case corresponds to the frequency ωH/2π = 100 MHz, when the curves of the inner groups or terminal groups are shifted to a larger value of 1/T1H for n = 4 with respect to those for n = 2; 1/T1H points of inner groups have a larger value than ones of terminal groups for the same n. For higher frequencies (ωH/2π ≥ 1600 MHz), there is an opposite situation: the values of 1/T1H at Θ = 300 K of the terminal groups are found to be larger than those of the inner ones.
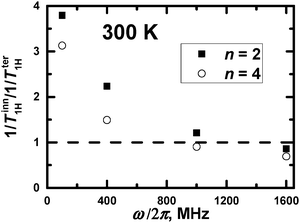
In principle, a qualitative comparison of the mobility of the inner and terminal groups in the same PLL dendrimer by 1/T1H is possible for frequencies up to 1000 MHz. Fig. 9 shows the ratio of (1/Tter1H)/(1/Tinn1H) for different frequencies, calculated at Θ = 300 K. It can be seen that this ratio exceeds unity at low frequencies and is less than unity at higher 1000 MHz frequencies. This result is obtained from the large difference in the orientational mobility of inner and terminal groups due to low flexibility of segments in the PLL dendrimers. However, this frequency will be lower than 400 MHz if there is a possibility to consider the 1/T1H values of groups from the different inner layers. This result is expected due to 1/T1H data for segments (see Fig. 3a). A quantitative comparison of the mobility of inner and terminal groups of the same dendrimer using 1/TH is possible also at frequencies lower than 400 MHz.
Thus, our results for PLL dendrimers confirm the conclusions of ref. 37 that the traditional approach can lead to incorrect conclusions and, therefore, the features of the temperature dependence of 1/T1 are important for the interpretation of the 1/T1 data for dendrimers.
Experimentally, the decrease of the angular frequency ωH leads to a deterioration in the resolution of a spectrometer. This difficulty can be avoided by the use of 13C atoms to measure the NMR relaxation, because ωH/ωC ≈ 4 for the same spectrometer.30 The 1/T1C function for carbon atoms is determined by the following equation:39,57
| 1/T1C(ωC) = A0(C)[6J(4.97ωC) + J(2.97ωC) + 3J(ωC)], | (11) |
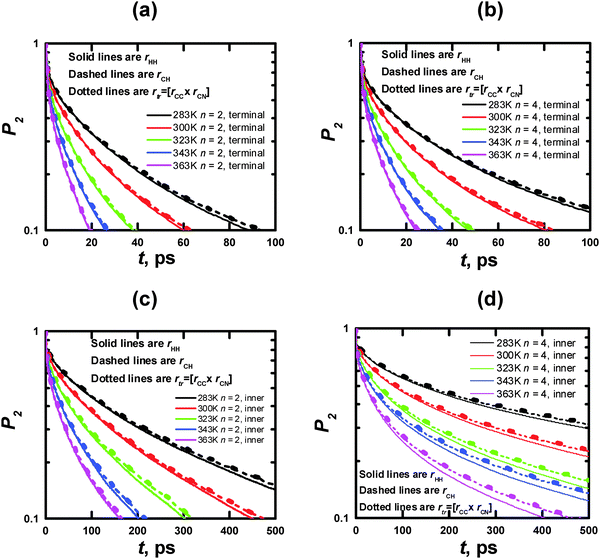 | ||
| Fig. 10 Time dependences of P2 obtained from the MD simulations for rHH (solid lines), rCH (dashed lines), and rtr (dotted lines) vectors in terminal (a, c) and inner (b, d) CH2 groups (cf. Fig. 2a and b) at different temperatures. | ||
IV. Conclusions
The temperature and frequency dependences of the spin–lattice NMR relaxation rates (1/T1) for the segments and the NMR active CH2 groups in poly-L-lysine dendrimers in water have been calculated on the basis of full-atomic molecular dynamics simulations. The comparison of the simulation results with the theoretical predictions for the viscoelastic model, developed recently in ref. 47, has been performed. It shows that the observed dependence of the position of the [1/T1] maximum on the location of the segments inside the dendrimer can be explained by the effect of the restricted flexibility of a dendrimer. The same effect can be responsible for the difference in the orientational mobility of the terminal and inner NMR active CH2 groups in PLL dendrimers. This difference leads to the different temperature dependences of 1/T1H for the terminal and inner groups, observed experimentally by us in ref. 40. Our simulations reproduce the experimental data for n = 2 and n = 4 PLL dendrimers.Since the differences in the temperature dependence of 1/T1H for the inner and terminal groups have been observed also for other dendrimers,32,35 we can suppose that the restricted flexibility (semiflexibility) manifests itself in these cases, as well. The similar effect can also be responsible for the different temperature dependences of 1/T1H for NMR active groups in different layers of poly(aryl ether) dendrimers.37
In our work the applicability of the traditional interpretation of the NMR experimental data, when the smaller values of 1/T1 correspond to the higher orientation mobility, is also discussed. We have confirmed the conclusion of ref. 37 to consider the temperature dependence of 1/T1 for the correct interpretation of the 1/T1 data for dendrimers. We have calculated the temperature dependences of 1/T1H for inner and terminal groups in PLL dendrimers at different frequencies. It is shown that the traditional procedure is applicable for the comparison of the mobility of inner and terminal groups of different PLL dendrimers at the room temperature only at low frequencies (∼100 MHz). At high frequencies (≥1600 MHz), the opposite situation is observed: the smaller values of 1/T1H correspond to the lower mobility.
Concerning the mobility of the inner groups of the different PLL dendrimers, the procedure above is correct only at frequencies below ∼400 MHz. In the same case of the terminal groups, the traditional approach can be applied within the experimentally accessible frequency interval.
A qualitative comparison of the mobility of the inner and terminal groups in the same PLL dendrimer by 1/T1H is possible for frequencies up to 1000 MHz. This result is obtained from the large difference in the orientational mobility of inner and terminal groups due to the low flexibility of segments in the PLL dendrimers. However, this frequency will be lower than 400 MHz if there is a possibility to consider the 1/T1H values of groups from the different inner layers (m > 0). Also, a quantitative comparison of the mobility of inner and terminal groups of the same dendrimer using 1/TH is possible also at frequencies lower than 400 MHz.
Additionally, we have shown that the 1H or 13C NMR relaxations for PLL dendrimers are determined by the same relaxation processes. Therefore, the main conclusions concerning 1/T1H are applicable also to 1/T1C. Thus, the use of these two methods provides mutually complementary information about molecular mobility in PLL dendrimers.
Appendix A
Calculations of the frequency dependences of 1/T1H functions.To obtain 1/T1H functions from P2 ACF, we use numerical calculations on the basis of eqn (4) for spectral density, which determines 1/T1H in eqn (3). To improve the numerical calculation results, we approximate the tail of each P2 ACF by one-exponential fitting and construct full Pfull2 using eqn (A.1):
 | (A.1) |
This method is applied to the calculation of [1/T1H] functions. Initial data are presented for different vectors of PLL dendrimers at several temperatures, including Fig. 11 and Table 4 for rs vectors of the segments at 300 K, Fig. 12 and Table 5 for rHH vectors of the inner and terminal segments in the dendrimers with n = 2 and 4 at 283, 300, 323, 343, 363 K, and Fig. 13 and Table 6 for rCC vectors of the inner and terminal segments in the dendrimers with n = 2 and 4 at 300 K.
| n | τ tail (ps) | |||||
|---|---|---|---|---|---|---|
| m = 0 | m = 1 | m = 2 | m = 3 | m = 4 | m = 5 | |
| 2 | 373 | 505 | 1190 | — | — | — |
| 3 | 1092 | 1281 | 1407 | 1465 | — | — |
| 4 | 1797 | 2004 | 2246 | 2702 | 3092 | — |
| 5 | 3267 | 4528 | 4809 | 4939 | 5564 | 7610 |
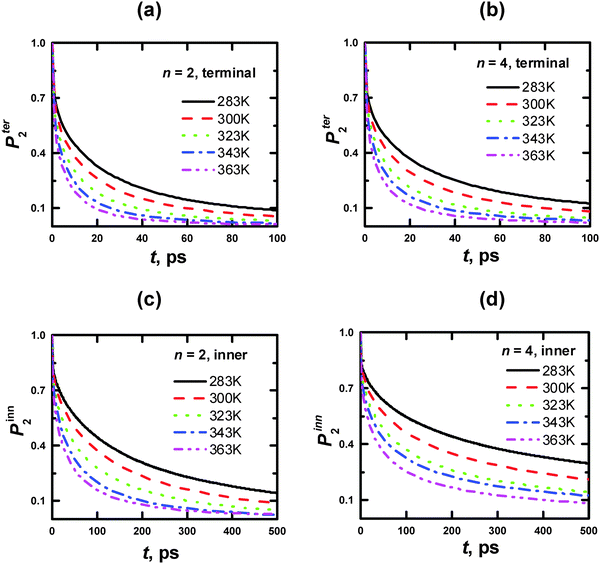 | ||
| Fig. 12 Time dependences of P2 ACF for the rHH vectors of CH2 groups of the PLL dendrimer terminal (a, b) and inner (c, d) segments with n = 2 (a, c) and 4 (b, d) at different temperatures. | ||
| Θ (K) | τ tail (ps) | |||
|---|---|---|---|---|
| n = 2 | n = 4 | |||
| Terminal | Inner | Terminal | Inner | |
| 283 | 295 | 481 | 714 | 2049 |
| 300 | 169 | 336 | 667 | 2017 |
| 323 | 136 | 292 | 269 | 1680 |
| 343 | 76 | 265 | 156 | 1310 |
| 363 | 56 | 254 | 92 | 1188 |
 | ||
| Fig. 13 Time dependences of P2 ACF for the rCC vectors in inner and terminal segments of PLL dendrimers with n = 2 and 4 at 300 K. | ||
| Θ (K) | τ tail (ps) | |||
|---|---|---|---|---|
| n = 2 | n = 4 | |||
| Terminal | Inner | Terminal | Inner | |
| 300 | 415 | 787 | 1806 | 2558 |
Appendix B
Characteristic times of rotation of PLL dendrimers as a whole at 300 K.The characteristic time of rotation of the dendrimer as a whole can be obtained from the Prot1 autocorrelation function (ACF):41,42
 | (B.1) |
 | ||
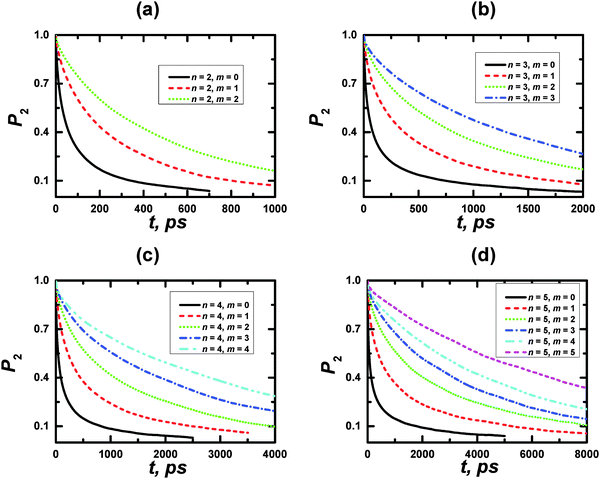
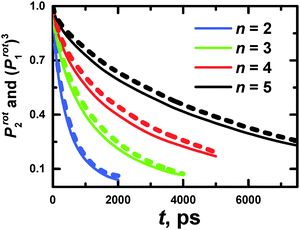
| Fig. 14 The time dependencies of Prot1 ACF for PLL dendrimers with n = 2–5 at 300 K. Dotted lines are the approximation of the ln(Prot1) slope. | ||
The slope of the ln(Prot1) function corresponds to the reciprocal characteristic time of rotation of a dendrimer as a whole. The dotted lines are the approximation of the slope of ln(Prot1) in Fig. 14. The results of the calculations are collected in Table 7.
Additionally, we have to point out that the P2 ACF appears in NMR relaxation and (eqn (B.1)) decays faster than the P1 ACF. To establish the appearance of  in P2 ACF, we calculate Prot2 ACF for the same rd vector as in eqn (B.1),
 | (B.2) |
In Fig. 15, we check up the relationship42
| Prot2(t) = (Prot1(t))3 | (B.3) |
The utilization of eqn (B.3) seems to be valid for PLL dendrimers, as well. Hence, we can conclude that the rotation time which appears in P2 ACF, τrot, is expressed as
 | (B.4) |
The values of τrot are presented in Table 3.
Acknowledgements
Many thanks to Dr Konstantin G. Lisunov for helpful discussions. This work is partially supported by the Russian Foundation for Basic Research (grants No. 13-03-00524, 13-03-00728, and 14-03-00926) and the Government of the Russian Federation grant 074-U01. The simulations have been performed using the Lomonosov supercomputers at the Moscow State University and the resources of the computer center of the Saint Petersburg State University.References
- E. Buhleier, W. Wehner and F. Vogtle, Synthesis, 1978, 155–158 CrossRef CAS.
- R. G. Denkewalter, J. Kolc and W. J. Lukasavage, USA Pat., 4 289872, 1981 Search PubMed.
- G. R. Newkome, Z.-Q. Yao, G. R. Baker and V. K. Gupta, J. Org. Chem., 1985, 50, 2003–2004 CrossRef CAS.
- D. A. Tomalia, H. Baker, J. Dewald, M. Hall, G. Kallos, S. Martin, J. Roeck, J. Ryder and P. Smith, Polym. J., 1985, 17, 117–132 CrossRef CAS.
- C. J. Hawker and J. M. J. Fréchet, J. Chem. Soc., Chem. Commun., 1990, 1010–1013 RSC.
- B. K. Nanjwade, H. M. Bechra, G. K. Derkar, F. V. Manvi and V. K. Nanjwade, Eur. J. Pharm. Sci., 2009, 38, 185–196 CrossRef CAS PubMed.
- E. R. Gillies and J. M. J. Fréchet, Drug Discovery Today, 2005, 10, 35–43 CrossRef CAS.
- Y. Cheng, Dendrimer-Based Drug Delivery Systems: From Theory to Practice, John Wiley and Sons, New York, 2012 Search PubMed.
- J. Wu, W. Huang and Z. He, Sci. World J., 2013, 630654 Search PubMed.
- B. Klajnert, J. Cladera and M. Bryszewska, Biomacromolecules, 2006, 7, 2186–2191 CrossRef CAS PubMed.
- V. Balzani, P. Ceroni, M. Maestri, C. Saudan and V. Vicinelli, Top. Curr. Chem., 2003, 228, 159–191 CrossRef CAS.
- G. D. D'Ambruoso and D. V. McGrath, Adv. Polym. Sci., 2008, 214, 87–147 Search PubMed.
- D.-L. Jiang and T. Aida, Nature, 1997, 388, 454–456 CrossRef CAS PubMed.
- J. M. J. Fréchet, J. Polym. Sci., Part A: Polym. Chem., 2003, 41, 3713–3725 CrossRef.
- B. Helms and J. M. J. Fréchet, Adv. Synth. Catal., 2006, 348, 1125–1148 CrossRef CAS.
- F. W. Zeng and S. C. Zimmerman, Chem. Rev., 1997, 97, 1681–1712 CrossRef CAS PubMed.
- D. Astruc, E. Boisselier and C. Ornelas, Chem. Rev., 2010, 110, 1857–1959 CrossRef CAS PubMed.
- C. Deraedt, N. Pinaud and D. Astruc, J. Am. Chem. Soc., 2014, 136, 12092–12098 CrossRef CAS PubMed.
- B. J. Boyd, L. M. Kaminskas, P. Karellas, G. Krippner, R. Lessene and C. J. H. Porter, Mol. Pharmaceutics, 2006, 3, 614–627 CrossRef CAS PubMed.
- T. L. Kaneshiro, X. Wang and Z.-R. Lu, Mol. Pharmaceutics, 2007, 4, 759–768 CrossRef CAS PubMed.
- B. W. Greatrex, S. J. Brodie, R. H. Furneaux, S. M. Hook, W. T. McBurney, G. F. Painter, T. Rades and P. M. Rendle, Tetrahedron, 2009, 65, 2939–2950 CrossRef CAS PubMed.
- X. Zhang, K. Luo, G. Wang, Y. Nie, B. He, Y. Wu and Z. Gu, J. Biomater. Appl., 2012, 27, 17–26 CrossRef PubMed.
- S. Ghosh, M. Dutta, S. Sahu, D. Fujita and A. Bandyopadhyay, Adv. Funct. Mater., 2014, 24, 1364–1371 CrossRef CAS.
- J. M. J. Fréchet and D. A. Tomalia, Dendrimers and Other Dendritric Polymers, Wiley, New York, 2002 Search PubMed.
- S. Natali and J. Mijovic, Macromolecules, 2009, 42, 6799–6807 CrossRef CAS.
- J. Duhamel, Polymers, 2012, 4, 211–239 CrossRef CAS PubMed.
- A. D. Meltzer, D. A. Tirrell, A. A. Jones, P. T. Inglefield, D. M. Hedstrand and D. A. Tomalia, Macromolecules, 1992, 25, 4541–4548 CrossRef CAS.
- D.-L. Jiang and T. Aida, J. Am. Chem. Soc., 1998, 120, 10895–10901 CrossRef CAS.
- S. Hecht and J. M. J. Fréchet, J. Am. Chem. Soc., 1999, 121, 4084–4085 CrossRef CAS.
- M. Chai, Y. Niu, W. J. Youngs and P. L. Rinaldi, J. Am. Chem. Soc., 2001, 123, 4670–4678 CrossRef CAS PubMed.
- W. E. Baille, C. Malveau, X. X. Zhu, Y. H. Kim and W. T. Ford, Macromolecules, 2003, 36, 839–847 CrossRef CAS.
- C. Malveau, W. E. Baille, X. X. Zh and W. T. Ford, J. Polym. Sci., Part B: Polym. Phys., 2003, 41, 2969–2975 CrossRef CAS.
- E. Fernandez-Megia, J. Correa and R. Riguera, Biomacromolecules, 2006, 7, 3104–3111 CrossRef CAS PubMed.
- R. Novoa-Carballal, E. Sawen, E. Fernandez-Megia, J. Correa, R. Riguera and G. Widmalm, Phys. Chem. Chem. Phys., 2010, 12, 6587–6589 RSC.
- D. A. Markelov, V. V. Matveev, P. Ingman, M. N. Nikolaeva, E. Lahderanta, V. A. Shevelev and N. I. Boiko, J. Phys. Chem. B, 2010, 114, 4159–4165 CrossRef CAS PubMed.
- D. A. Markelov, V. V. Matveev, P. Ingman, E. Lahderanta and N. I. Boiko, J. Chem. Phys., 2011, 135, 124901 CrossRef PubMed.
- L. F. Pinto, J. Correa, M. Martin-Pastor, R. Riguera and E. Fernandez-Megia, J. Am. Chem. Soc., 2013, 135, 1972–1977 CrossRef CAS PubMed.
- L. F. Pinto, R. Riguera and E. Fernandez-Megia, J. Am. Chem. Soc., 2013, 135, 11513–11516 CrossRef CAS PubMed.
- R. J. Abraham, J. Fisher and P. Loftus, Introduction to NMR Spectroscopy, John Wiley and Sons, New York, 1988 Search PubMed.
- I. M. Neelov, D. A. Markelov, S. G. Falkovich, M. Y. Ilyash, B. M. Okrugin and A. A. Darinskii, Polym. Sci., Ser. C, 2013, 55, 154–161 CrossRef CAS.
- K. Karatasos, D. Adolf and G. R. Davies, J. Chem. Phys., 2001, 115, 5310 CrossRef CAS PubMed.
- S. V. Lyulin, A. A. Darinskii, A. V. Lyulin and M. A. J. Michels, Macromolecules, 2004, 37, 4676–4685 CrossRef CAS.
- Y. Y. Gotlib and D. A. Markelov, Polym. Sci., Ser. A, 2007, 49, 1137–1154 CrossRef.
- A. Kumar and P. Biswas, J. Chem. Phys., 2011, 134, 214901 CrossRef PubMed.
- A. Kumar and P. Biswas, Phys. Chem. Chem. Phys., 2013, 15, 20294–20302 RSC.
- D. A. Markelov, S. V. Lyulin, Y. Y. Gotlib, A. V. Lyulin, V. V. Matveev, E. Lahderanta and A. A. Darinskii, J. Chem. Phys., 2009, 130, 044907 CrossRef PubMed.
- D. A. Markelov, M. Dolgushev, Y. Y. Gotlib and A. Blumen, J. Chem. Phys., 2014, 140, 244904 CrossRef PubMed.
- M. Dolgushev and A. Blumen, Macromolecules, 2009, 42, 5378–5387 CrossRef CAS.
- M. Dolgushev and A. Blumen, J. Chem. Phys., 2009, 131, 044905 CrossRef PubMed.
- F. Fürstenberg, M. Dolgushev and A. Blumen, J. Chem. Phys., 2012, 136, 154904 CrossRef PubMed.
- S. Falkovich, D. Markelov, I. Neelov and A. Darinskii, J. Chem. Phys., 2013, 139, 064903 CrossRef CAS PubMed.
- W. L. Jorgensen, J. Chandrasekhar, J. D. Madura, R. W. Impey and M. L. Klein, J. Chem. Phys., 1983, 88, 2472 Search PubMed.
- E. J. Sorin and V. S. Pande, Biophys. J., 2005, 88, 2472–2493 CrossRef CAS PubMed.
- B. Hess, C. Kutzner, D. van der Spoel and E. Lindahl, J. Chem. Theory Comput., 2008, 4, 435–447 CrossRef CAS.
- (a) G. P. Vlasov, V. I. Korol'kov, G. A. Pankova, I. I. Tarasenko, A. N. Baranov, P. B. Glazkov, A. V. Kiselev, O. V. Ostapenko, E. A. Lesina and V. S. Baranov, Russ. J. Bioorg. Chem., 2004, 30, 12–20 CrossRef CAS; (b) G. P. Vlasov, G. M. Pavlov, N. V. Bayanova, E. V. Korneeva, C. Ebel, M. A. Khodorkovskii and T. O. Artamonova, Dokl. Phys. Chem., 2004, 399, 290–292 CrossRef CAS.
- B. P. Roberts, G. Y. Krippner, M. J. Scanlon and D. K. Chalmers, Macromolecules, 2009, 42, 2784–2794 CrossRef CAS.
- V. I. Chizhik, Y. S. Chernyshev, V. V. Frolov, A. V. Komolkin and M. A. Shelyapina, Magnetic Resonance and Its Applications, Springer, Cham, 2014 Search PubMed.
- Y. Y. Gotlib, I. M. Neelov and I. A. Torchinskii, Macromol. Theory Simul., 1993, 2, 1–11 CrossRef CAS.
| This journal is © the Owner Societies 2015 |

