Multi-stage decomposition of 5-aminotetrazole derivatives: kinetics and reaction channels for the rate-limiting steps†
Received
5th August 2014
, Accepted 1st October 2014
First published on 2nd October 2014
Abstract
The thermal behavior, decomposition kinetics and mechanisms of 1-amino-1-(tetrazol-5-yldiazenyl) guanidine (tetrazene) and 2-(tetrazol-5-yldiazenyl) guanidine (MTX-1) have been investigated using DSC, TG techniques, and quantum chemical calculations. It has been found that MTX-1 is much more stable than tetrazene and MTX-1, and both of them decompose in three steps with different kinetic parameters. Tetrazene is melted-dehydrated at 128.4 °C with a heat absorption of 50 J g−1 and then it starts to decompose at around 118.6 °C with a peak temperature of 126.3 °C covered by a heat release of 1037 J g−1 at a heating rate of 1.0 °C min−1, while MTX-1 starts at 167.7 °C with a main peak of 191.1 °C covered by a heat change of 1829 J g−1 under the same conditions. The activation energy is almost the same for their first decomposition steps (225 kJ mol−1), which are controlled by a three dimensional nucleation and growth model (A3). The mechanisms of the rate-limiting steps are supported by quantum chemical calculations. They could undergo a similar rate-limiting chemical process producing 1H-tetrazole and N2 for both cases, while the former also produces aminocyanamide and the latter produces cyanamide.
1. Introduction
The high-nitrogen content energetic materials (EMs), which are more environmentally friendly and in most cases more powerful than traditional ones (e.g. RDX and HMX), have attracted more and more attention during past few decades.1,2 The tetrazole based compounds are found to be the most attractive high-nitrogen EMs.3 As one of the prominent derivatives of 5-aminotetrazole, tetrazene [1-amino-1-(tetrazol-5-yldiazenyl) guanidine, see Scheme 1], initially prepared in 1910 by Hoffman and Roth, has been widely used in ordnance systems as a sensitizer of primer mixtures, in replacement of mercury fulminate-based and lead thiocyanate-based primers.4 Current primer mixes, such as NOL-130, are generally comprised of 5% tetrazene, which makes the primer mixture much more sensitive to stab initiation.5,6 There is another important 5-aminotetrazole derivative so-called MTX-1 [2-(tetrazol-5-yldiazenyl) guanidine, Scheme 1] as recently patented,7 which has much higher thermal and hydrolytic stabilities than tetrazene.
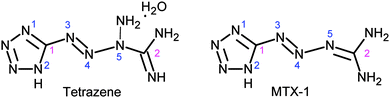 |
| | Scheme 1 Molecular structure of tetrazene and MTX-1 (the label of the atoms will be used in the discussion part). | |
Thermal decomposition of tetrazene has been frequently investigated since 1970s.8,9 It has been reported that, its initial decomposition product is 5-aminotetrazole, following an autocatalytic physical model with an activation energy of 184 kJ mol−1 under isothermal conditions (407–470 K)9 and 163 kJ mol−1 under linear heating conditions (2.5–40 K min−1).8 MTX-1 is a relatively new 5-aminotetrazolate derivative and it has not been extensively studied until now. Particularly, the decomposition models, detailed reaction pathways and gaseous products of both MTX-1 and tetrazene are, on the basis of the literature, still not well-known. The decomposition mechanism and kinetic parameters are very important to evaluate their thermal reactivity, sensitivity and storage properties.10,11 Therefore, in this paper, non-isothermal multi-stage decomposition kinetics of tetrazene and MTX-1 are evaluated by means of TG and DSC experiments. The physical models are obtained using a combined kinetic method12 and the possible reaction mechanisms are proposed on the basis of quantum chemical calculation.
2. Experimental
2.1 Preparation of the compounds
Tetrazene was prepared using a described method13 from aminoguanidine bicarbonate by its treatment with solution of sodium nitrite in the presence of acetic acid for the time of 24 hours; the precipitated product was isolated by filtration and after four times washing by distilled water it was dried at 30 °C. MTX-1 was obtained by the nitrosolysine deamination of tetrazene in the sense of the described method.14
2.2 Experimental techniques
The non-isothermal decomposition kinetics and physical models of involved materials are studied by means of TG and DSC techniques. The experiments were carried out on a Netzsch 209F3 instrument (Al2O3 crucible) under linear heating conditions. Generally, a wider heating rate range is in favor of higher reliability of kinetic evaluation. However, for such primary high nitrogen compounds, high heating rates may result in burning, which should be excluded for kinetic calculation. Hence the heating rate was limited to a range where no burning occurs (e.g. 0.6–4 °C). The test temperature range for TG was 30–400 °C, with the sample mass of about 1.20–1.80 mg under a 50 ml min−1 dynamic nitrogen atmosphere.
Their heat flow properties were recorded by the technique of Differential Scanning Calorimetry (DSC, Netzsch 200F3 instrument, Aluminum pan with a pin hole cover), which was introduced in the dynamic nitrogen atmosphere under pressure of 0.1 MPa. The sample mass for DSC was about 1.5 mg with a heating rate of about 2.0 and 5.0 °C min−1 (30–300 °C).
3. Theoretical backgrounds
3.1 Calculation of activation energy
Isoconversional (model-free) methods are standard procedures for determining the activation energy of a process, regardless of any previous knowledge of the kinetic model. Friedman's isoconversional method has been used to evaluate the dependence of activation energy on the extent of conversion, which is widely discussed in many literature.15
3.2 Determination of physical models
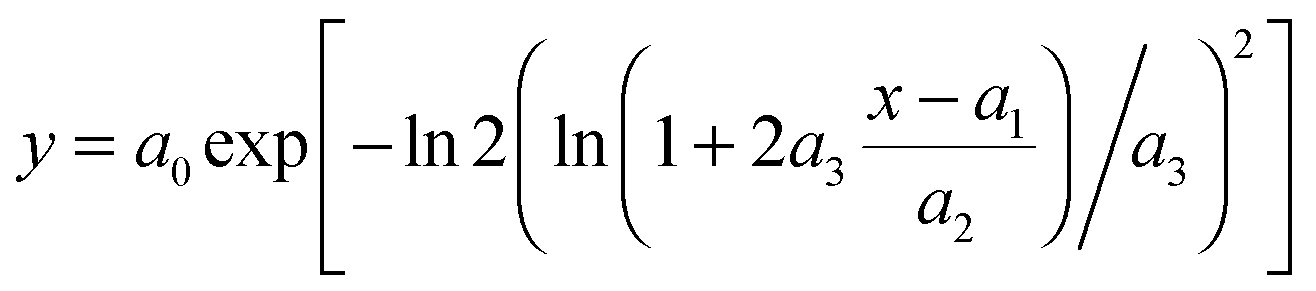
In order to obtain a complete kinetic description of a solid-state reaction, the kinetic parameters (triplet), namely the apparent activation energy (Ea), the pre-exponential factor (A) and the kinetic model (f(α)) of each individual process, should be determined. A so-called “combined kinetic analysis” method could be used in a straightforward manner,12 which implies a simultaneous analysis of experimental data obtained under arbitrary heating history. This procedure is based on the fact that only the true kinetic model fits simultaneously all experimental data yielding a unique f(T) function. Here a modified Šesták–Berggren (SB) equation has been used to fit the experimental data. Šesták and Berggren16 proposed the following semi-empirical equation:| | | f(α) = αm(1 − α)n(−ln(1 − α))p | (1) |
for describing the kinetics of solid-state processes. Such an equation has been extensively used for crystallization processes or n-order reactions, as stated in several papers.17,18 More recently,19 a simplification and modification of the Šesták–Berggren equation was proposed as follows:
The combined kinetic analysis is based on the following equation:28
| |  | (3) |
Evaluating the parameters of eqn (3) requires one to simultaneously substitute all kinetic data α and dα/dt vs. T. The best fit values of the parameters are obtained when the best linearity of a plot of the left hand side of eqn (3) against the reciprocal temperature is obtained. In the aforementioned manuscript,19 it was shown that the latter equation is fully capable of fitting every kinetic ideal model proposed (nucleation and growth, diffusion, interface), effectively working as an umbrella that covers the different kinetic models, by merely adjusting the parameters n, m and c (including negative numbers that were not previously considered but necessary for fitting some of the models). Moreover, it was confirmed that this modified and simplified SB equation is able to fit even deviations produced in the ideal models by particle size distributions or heterogeneities in particle morphologies. More recently, it has also been observed that the modified and simplified SB equation can fit newly proposed random scission kinetic models for polymer degradation processes.20 This method has also been proved to be more convenient than master plots for investigation of the complex decomposition processes of energetic materials, which could not be fully described by limited ideal kinetic models.21
3.3 Initial decomposition mechanism by quantum chemistry calculation (QCC)
Density functional theory (DFT)22 has been applied to optimize all the structures. Beck's three-parameter nonlocal exchange functional along with the Lee–Yang–Parr nonlocal correlation functional (B3LYP) is employed.23,24 The geometries of the relevant stationary points along the reaction pathways were optimized at the B3LYP/6-311++G** level of theory employing analytical gradient procedures. Meanwhile, the transition states of reaction paths have been obtained and the intrinsic reaction coordinate (IRC)25 was calculated to confirm whether the reaction transition state (TS) connects the reactant and the product as two minimum points. The different energy parameters such as internal energy (U), enthalpy (H), free energy (G), and the potential energy curve were determined from the calculated vibrational frequencies at the same level. All the ab initio calculations involved in this work were carried out using the Gaussian 09 program package.26
4. Results and discussion
4.1 TG/DTG studies
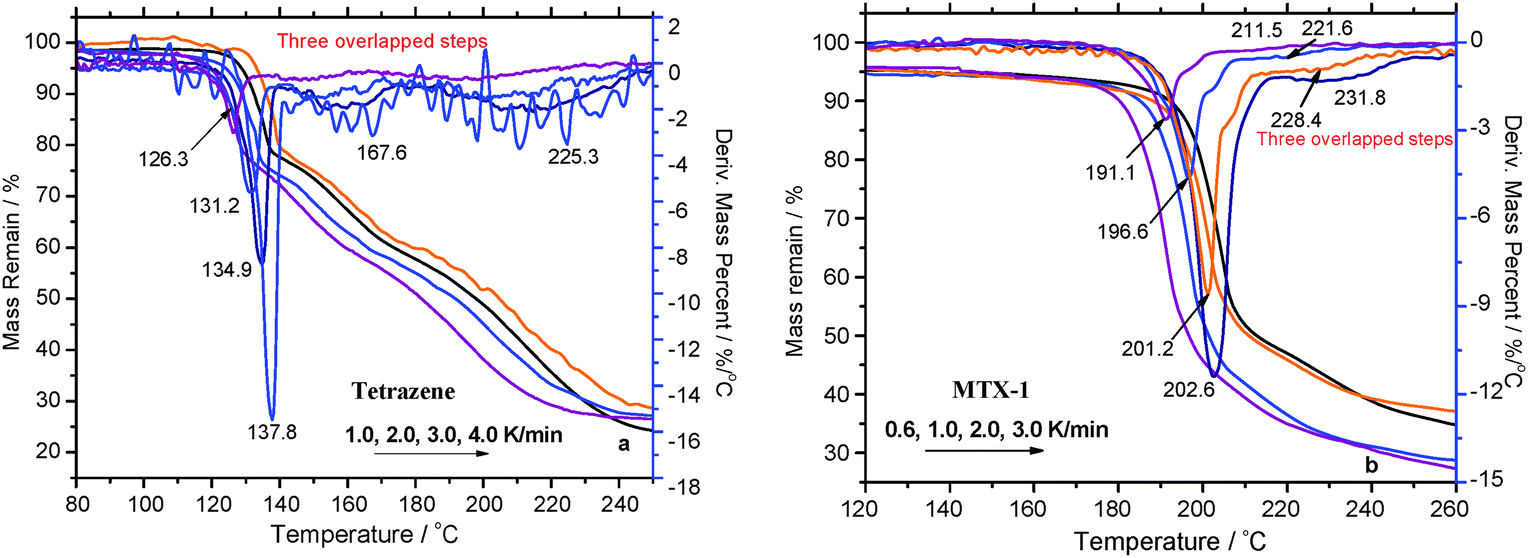
TG/DTG curves of tetrazene and MTX-1 at the heating rates of 0.6, 1, 2, 3, and 4 °C min−1 were recorded (see Fig. 1a and b). It has been shown that at least three decomposition steps are included for both materials, which is consistent with the literature.7–9 In order to make a quantitative comparison, the characteristic parameters of these curves are summarized in Table 1.
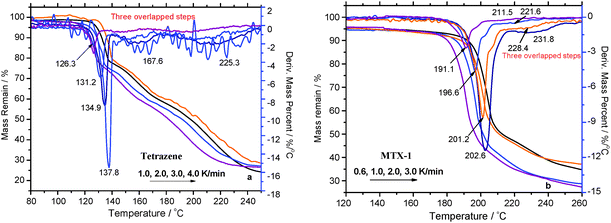 |
| | Fig. 1 The non-isothermal TG/DTG curves of MTX-1 and tetrazene. | |
Table 1 Summary of mass loss data from non-isothermal TG curves of tetrazene and MTX-1 (main peaks)
| Samples |
TG curves |
DTG peaks |
|
β/°C min−1 |
T
i/°C |
T
ot/°C |
Mass change |
L
max% min−1 |
T
p/°C |
T
oe/°C |
| Mass loss/% |
Residue/% |
| Note: Tot—onset temperature of decomposition; Toe—onset temperature of the end decomposition; Ti—the initial temperature for thermal decomposition; Tp—the peak temperature of the mass loss rate; from initial temperature Ti to the end temperature Toe of the DTG peak; Lmax—the maximum mass loss rate. |
| Tetrazene (first peak) |
1.0 |
118.6 |
112.5 |
−19.7 |
21.3 |
−3.03 |
126.3 |
131.7 |
| 2.0 |
124.8 |
113.7 |
−20.5 |
23.2 |
−5.23 |
131.2 |
137.0 |
| 3.0 |
129.8 |
116.2 |
−19.3 |
27.5 |
−8.73 |
134.9 |
139.9 |
| 4.0 |
133.1 |
124.6 |
−20.3 |
30.1 |
−15.48 |
137.8 |
142.0 |
|
|
| MTX-1 (first peak) |
0.6 |
167.7 |
186.6 |
−57.7 |
16.7 |
−2.64 |
191.1 |
202.3 |
| 1.0 |
173.7 |
190.4 |
−52.3 |
15.6 |
−4.64 |
196.6 |
207.8 |
| 2.0 |
174.6 |
195.0 |
−48.1 |
25.8 |
−8.62 |
201.2 |
212.5 |
| 3.0 |
177.0 |
196.0 |
−46.3 |
26.9 |
−11.4 |
202.6 |
217.2 |
Usually, in order for reliable kinetic evaluation, it is necessary to apply the multiple heating rates with a wider dynamic range.24 However, according to Table 1, the decomposition processes of both tetrazene and MTX-1 are greatly dependent on the heating rate, burning would occur when the heating rate is above 4 °C min−1 due to self-heating, and hence the heating rate for kinetic evaluation has to be limited to a smaller range. Particularly, the oscillation of the sample pan occurs during slightly faster heating (e.g. at 4 °C min−1, see Fig. 1a) probably due to intense boiling of intermediates of tetrazene thermolysis. Tetrazene started to decompose at around 118.6 °C with a peak temperature of 126.3 °C at a heating rate of 1.0 °C min−1, while at the same heating rate MTX-1 started at 167.7 °C with a peak of 191.1 °C. It means modification of tetrazene by repelling of the crystal water and eliminating one amino group at the N5 position could greatly stabilize the molecule. However, both materials have comparable residual mass of about 25% at 2 °C min−1, which increases with the heating rate. It indicates that their condensed products might have identical components, which are volatile especially under a dynamic atmosphere. At a lower heating rate, those products would subject to more complete evaporation/sublimation due to longer exposure time at a high temperature, resulting in lower residual mass. Regarding the main decomposition step, MTX-1 has two times more mass loss (47–57%) than that of tetrazene (20%). Most of the heat is released during the first decomposition step of the MTX-1, which is very dependent on the heating rate due to production of volatile intermediates. The detailed heat release properties are tested by DSC and discussed in the following section.
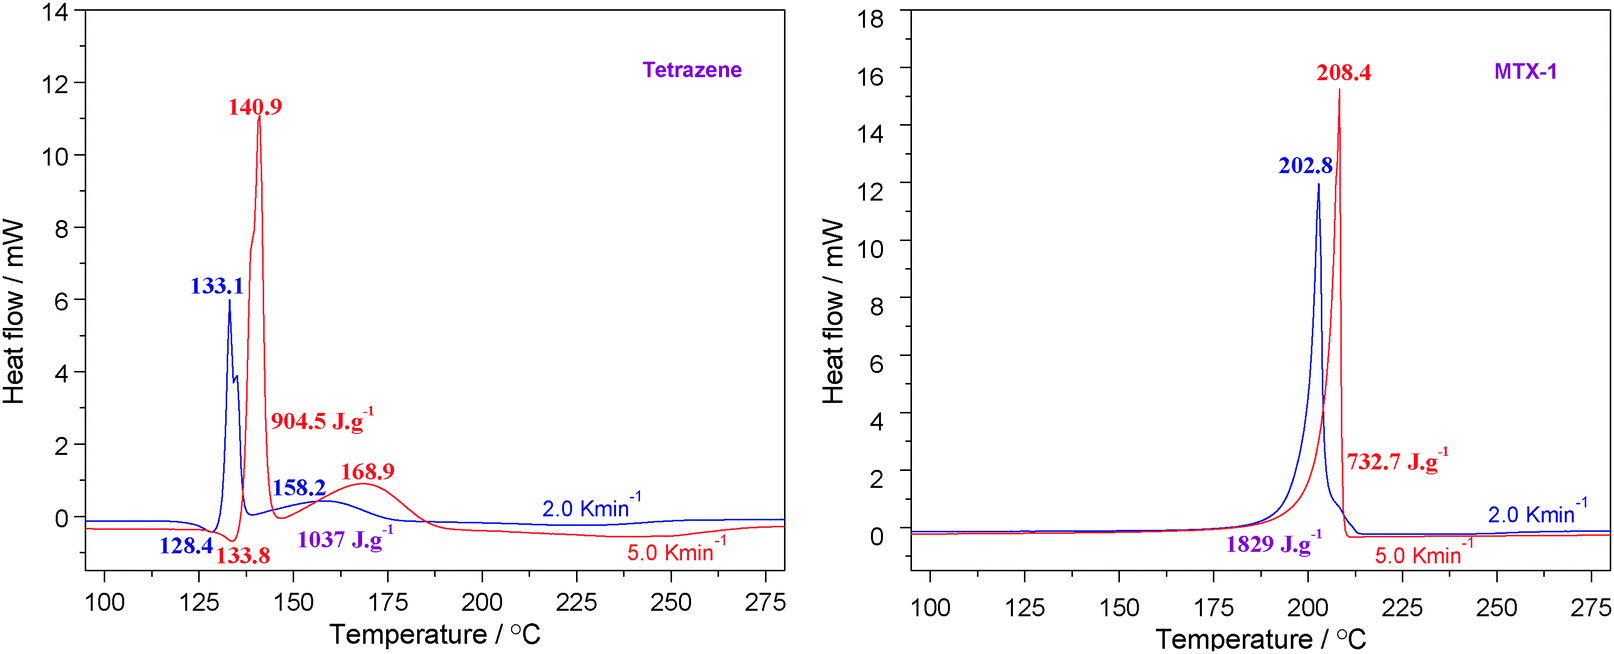
4.2 DSC studies
TG/DTG results could be further compared with DSC data. The samples were encapsulated in an aluminum pan with a pin hole and measurements were performed under identical conditions for both materials. The obtained curves are shown in Fig. 2 and the characteristic parameters are summarized in Table 2.
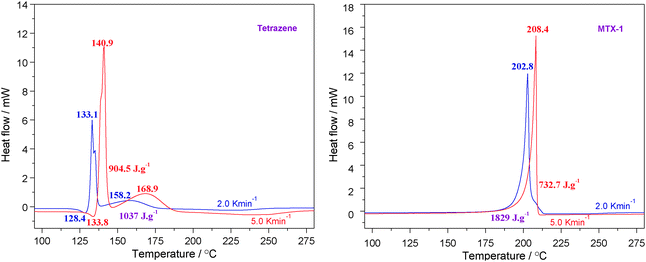 |
| | Fig. 2 The DSC curves of non-isothermal decomposition of MTX-1 and tetrazene at the heating rates of 2.0 and 5.0 °C min−1. | |
Table 2 DSC parameters of tetrazene and MTX-1 at heating rates of 2.0 and 5.0 °C min−1
| Samples |
Endothermic peaks |
Exothermic peaks |
|
T
o/°C |
T
p/°C |
W
P/°C |
ΔH1/J g−1 |
T
o/°C |
T
p; Tsp/°C |
T
e/°C |
ΔH2/J g−1 |
| Note: To—onset temperature of the peaks; Tp—peak temperature of thermal events; Te—the end temperature for heat change; ΔH1—heat absorption; ΔH2—heat release; WP, peak width; Tsp, shoulder peak. The values at a heating rate of 5 °C min−1 are taken from the literature.9 The values at a heating rate of 20 °C min−1 are taken from one US patent.7 |
| Tetrazene (2 K min−1) |
123.0 |
128.4 |
5.7 |
−50.0 |
131.7 |
133.1; 158.2 |
136.4 |
1037 |
| Tetrazene (5 K min−1) |
127.8 |
133.8 |
4.9 |
−26.4 |
138.5 |
140.9; 168.9 |
142.5 |
905 |
|
|
|
|
|
|
|
140.5a; 167.6a |
|
590 ± 20a |
| MTX-1 (2 K min−1) |
— |
— |
— |
— |
199.8 |
202.8 |
204.1 |
1829 |
| MTX-1 (5 K min−1) |
— |
— |
— |
— |
208.1 |
208.4 |
208.7 |
733 |
|
|
|
|
|
|
208b |
214b |
|
|
It is clear from Fig. 2 that their exothermic peaks are well formed, showing signs of kinetically controlled decomposition processes. According to Table 2, tetrazene is melted-dehydrated at 128.4 °C with a heat effect of 50 J g−1 when ramping at 2.0 °C min−1. Its decomposition peak temperature is about 133.1 °C followed by a shoulder peak at 158.2 °C with decomposition heat of 1037 J g−1. For MTX-1, the peak temperature is much higher (202.8 °C) with heat releases of 1829 J g−1 under the same conditions. When the heating rate increases to 5 °C min−1, the peak temperatures increase to 140.9 °C (almost identical to the reported value of 140.5 °C)9 and 208.4 °C for tetrazene and MTX-1, respectively. However, their heats of decomposition are largely decreased due to fast burning especially for MTX-1 (from 1829 to 733 J g−1), as mentioned in Section 4.1. In this case, the onset temperature (208.1 °C) is very close to its peak temperature. The heat release of the burning process is too fast to be recorded by the DSC sensor, and the extra heat was carried out through a pinhole by the dynamic atmosphere. According to the literature,9 the heat release of tetrazene was only 590 ± 20 J g−1, which is much lower than our data 905 J g−1 at the same heating rate probably due to an older generation power sensor. Regarding MTX-1, the onset temperature at 5 °C min−1 from the literature is 208 °C,7 which is almost the same with our results, but their peak value is higher due to better heat dissipation (smaller sample and particle sizes).
If we compare DSC curves and TG curves for both materials (at 2.0 °C min−1, as shown in Fig. 3), one could easily notice the large difference, which means that some of the mass loss processes do not correspond to any heat releases. The peak temperature of DSC is higher than that of DTG, indicating the heat releases are postponed. One should also take into account of the temperature program difference between these two equipment sets. It is clear that the third decomposition step of both materials does not show any heat events, indicating such a mass loss may correspond to slow evaporation of volatile products. The peak evaporation rate of tetrazene products at the third stage is around 1.0% min−1, which is higher than that of MTX-1 (0.6% min−1), because more mass has been lost during its first two steps. If we compare the integrated DSC curves with the TG curves, the temperature ranges of exothermic reaction processes are narrower than those of mass loss processes, which are from 130 °C to 180 °C for heat releases vs. 120 °C to 230 °C for mass loss of tetrazene and from 175 °C to 215 °C vs. 180 °C to 235 °C for MTX-1.
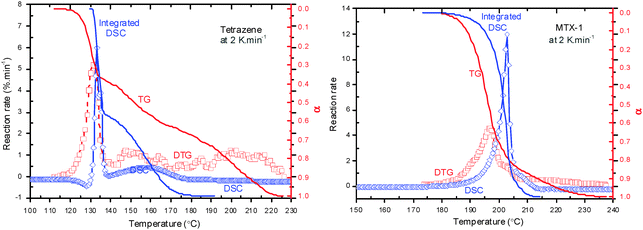 |
| | Fig. 3 Comparison of DSC curves and TG curves for MTX-1 and tetrazene decomposition at a heating rate of 2.0 °C min−1. | |
4.3 Thermal decomposition kinetics and physical models
4.3.1 Activation energies for separated processes.
Most kinetic analysis procedures were developed for studying single step reactions and usually fail when applied in a situation with complex or multiple overlapping processes. This is the case for decomposition of both tetrazene and MTX-1, but previously only a simple Kissinger method has been used to determine the activation energy for their first step.7–9 It has been widely accepted to use an isoconversional model-free method to evaluate the dependence of activation energy on the conversion rate for the sake of a better understanding of the whole decomposition process.27 However, it has been proved that evaluation by model-free analysis does not take into account the interaction of the steps, therefore producing the same prediction for both cases (a completely overlapped-step peak or a single-step peak28). It is true that the model-free method does provide correct predictions only for a non-overlapping peak or for a well-separated peak, while very different kinetic parameters would be obtained if there were interactions between overlapped steps.29 Therefore, before kinetic evaluation, those overlapped peaks for decomposition of tetrazene and MTX-1 have to be separated. Recently, the kinetic analysis of overlapping processes involving the separation of the individual peaks by deconvolution and the subsequent application of kinetic methods to the separated peaks have been carried out.30,31 In these studies, the Fraser–Suzuki (FS) function (eqn (4)) has been used in the deconvolution procedure because it allows simulating the asymmetrical nature of kinetic differential curves. The FS function is as follows:| | 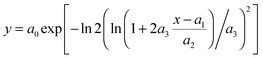 | (4) |
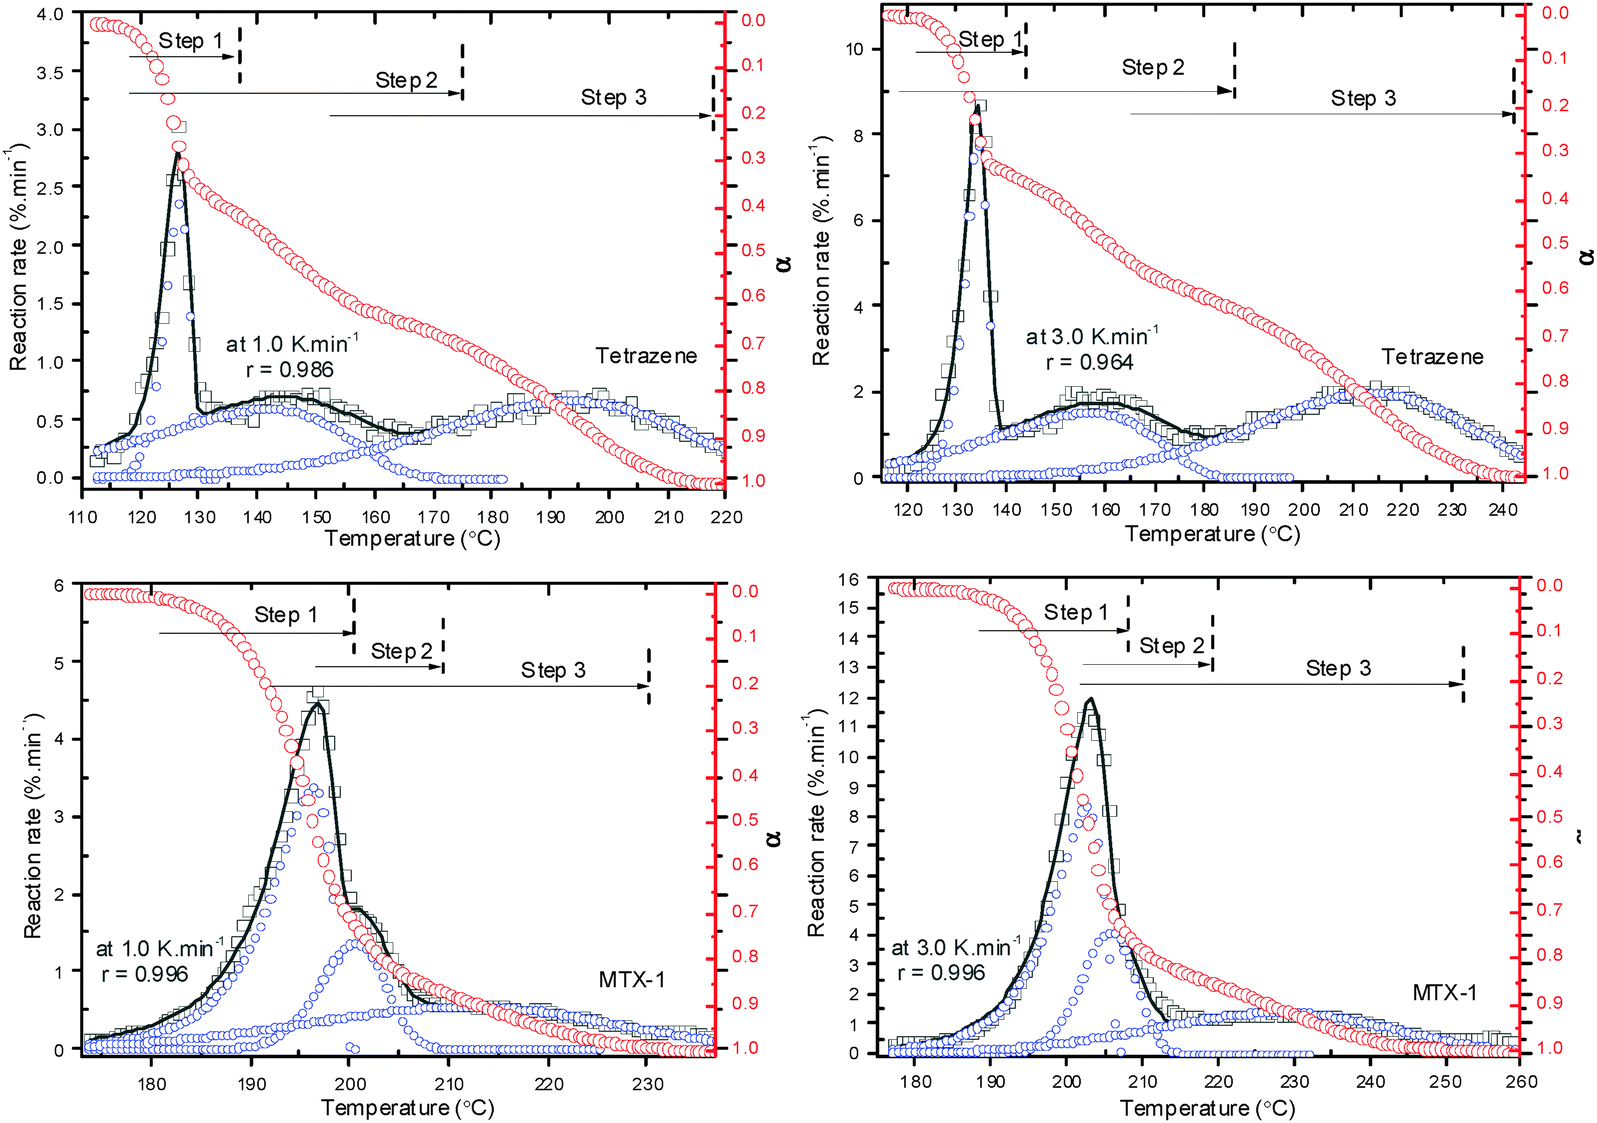
where a0, a1, a2, and a3 are amplitude, position, half-width and asymmetry of the peak, respectively. The separation processes are shown in Fig. 4 and corresponding separated peak data are listed in Table 3.
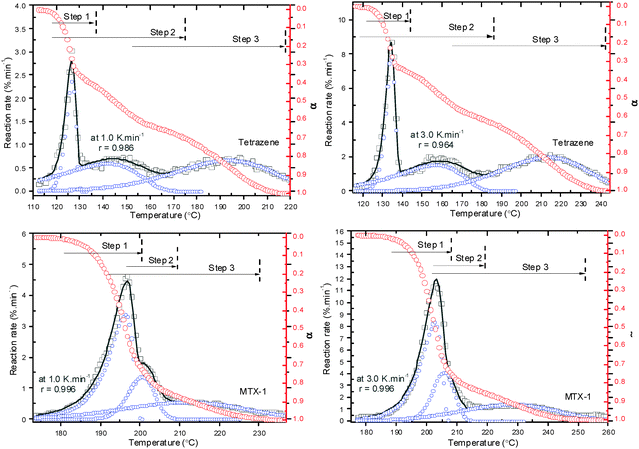 |
| | Fig. 4 The peak separation procedure for multi-step decomposition of MTX-1 and tetrazene at the heating rates of 1.0 and 3.0 K min−1 (open squares represent the experimental data; solid lines are overall fitted curves and open circles are separated peaks). | |
Table 3 The peak separation parameters and corresponding activation energies obtained using the Kissinger method for tetrazene and MTX-1
| Separated peaks |
Peak temperature at different heating rate/°C |
R
2
|
Contribution to the overall process/% |
Kinetic parameters |
| 1 |
2 |
3 |
4 |
E
a
|
log![[thin space (1/6-em)]](https://www.rsc.org/images/entities/char_2009.gif) A A |
r
|
| Notes: Ea, activation energy, in kJ mol−1; logA, logarithm of preexponential factor, in min−1; r, correlation coefficient of the Kissinger method; R, correlation coefficient for curve fitting; the heating rates for MTX-1 are 0.6, 1.0, 2.0, and 3.0 °C min−1; the contribution based on the average proportion of each peak area. |
| Tetrazene-1st |
126.4 |
131.5 |
134.3 |
137.4 |
0.986 |
22.1 |
168.1 |
21.1 |
0.9971 |
| Tetrazene-2nd |
141.6 |
150.5 |
157.6 |
161.5 |
0.975 |
31.0 |
95.7 |
10.9 |
0.9981 |
| Tetrazene-3rd |
193.5 |
203.8 |
213.3 |
218.8 |
0.964 |
46.9 |
94.7 |
9.3 |
0.9952 |
| MTX-1-1st |
190.7 |
196.2 |
200.6 |
203.1 |
0.995 |
49.2 |
231.2 |
24.9 |
0.9893 |
| MTX-1-2nd |
194.9 |
200.5 |
204.9 |
207.8 |
0.997 |
19.3 |
228.3 |
24.3 |
0.9909 |
| MTX-1-3rd |
205.5 |
211.8 |
220.4 |
227.9 |
0.994 |
31.5 |
137.0 |
13.6 |
0.9967 |
According to Fig. 4, the overlapped peaks are well separated with correlation coefficients higher than 0.99. During this procedure, one has to use the same asymmetry (a3) for the same steps at each heating rates, which, therefore, makes the peaks correlate with each other. On the basis of separated peaks, the activation energies are firstly calculated using the Kissinger method. It can be seen from Table 3 that the activation energy of the first step decomposition of tetrazene is much higher (168.1 kJ mol−1) than the following two steps (about 95.7 kJ mol−1). The isothermal decomposition activation energy for tetrazene was reported to be 185.4 kJ mol−1 with log(A) of 24.4 s−1 (between 145 and 197 °C).9 The activation energies for the initial two steps of MTX-1 decomposition are comparable, which are much higher than the third step. The initial two decomposition processes might be parallel with the close chemical mechanism (it has been proved in the following section) and almost completely overlapped especially at a higher heating rate (e.g. >3 °C min−1). If we look at the contribution of each step, it is reasonable that the mass loss value of each step based on TG data in Section 4.1 does not correlate with corresponding contribution of individual steps due to overlaps. The latter is more appropriate for physical interpretation. Interestingly, the heat release processes (initial two steps) contribute to 53% for tetrazene and 69% for MTX-1, and hence more heat was released during decomposition of MTX-1. The third mass loss steps of both materials are considered as evaporation or sublimation of the volatile products, which start at the very beginning of the whole decomposition with relatively low activation energy. Those volatile products are considered as polymers such as melamine, melem and melon polymerized from cyanamide, which will be clarified in Section 4.4. In that case, tetrazene could produce more volatile products (47%) than MTX-1 does (31%), which has little contribution to the energy output and hence tetrazene is less powerful than MTX-1.
The activation energies for each step of tetrazene and MTX-1 decomposition as a function of conversion are obtained using Friedman's isoconversional method (see Fig. 5). It has been shown that the activation energies of all separated steps are almost independent on the extent of conversion with acceptable error (shadows in Fig. 5 represent error bars), which suggests a single mechanism for each separated process. The average values of the activation energies are summarized in Table 4. No data are available regarding the overall decomposition activation energies using an isoconversional method for both materials. It will be compared only with those obtained using a combined kinetic method and discussed in the following section.
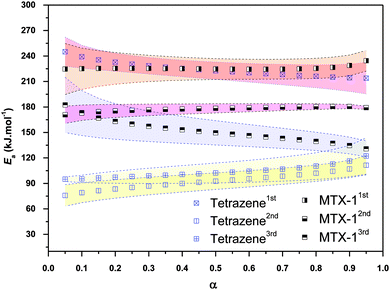 |
| | Fig. 5 The dependence of activation energy on the conversion rate for involved materials. | |
Table 4 Parameters for decomposition reaction models of tetrazene and MTX-1 evaluated from non-isothermal TG curves
| Samples |
Combined kinetic method |
Friedman method |
Kissinger method |
|
m
|
n
|
E
a(1)
|
cA/min−1 |
E
a(2)
|
r
|
E
a(3)
|
logA |
| Notes: 1st, 2nd, and 3rd mean different steps of decomposition; Ea(2), the average activation energies calculated using an isoconversional method (0.3 < α < 0.8); activation energies are in kJ mol−1. |
| Tetrazene-1st |
0.617 |
0.681 |
224.4 ± 1.5 |
1.3 ± 0.6 × 10+28 |
223 ± 11 |
0.9976 |
168.1 |
21.1 |
| Tetrazene-2nd |
−0.226 |
0.792 |
95.5 ± 0.8 |
1.4 ± 0.2 × 10+10 |
93 ± 10 |
0.9884 |
95.7 |
10.9 |
| Tetrazene-3rd |
−0.198 |
1.052 |
109.1 ± 0.6 |
2.6 ± 0.4 × 10+10 |
103 ± 12 |
0.9873 |
94.7 |
9.3 |
| MTX-1-1st |
0.477 |
0.404 |
225.8 ± 1.4 |
9.9 ± 3.7 × 10+23 |
225 ± 13 |
0.9964 |
231.2 |
24.9 |
| MTX-1-2nd |
0.665 |
0.827 |
176.4 ± 0.6 |
1.2 ± 0.2 × 10+18 |
178 ± 5 |
0.9990 |
228.3 |
24.3 |
| MTX-1-3rd |
0.059 |
1.146 |
147.2 ± 0.8 |
9.6 ± 1.9 × 10+13 |
150 ± 15 |
0.9902 |
137.0 |
13.6 |
4.3.2 Activation energies and kinetic models by a combined kinetic method.
Based on the theory described above in Section 3.2, the plots of ln[(dα/dt)/f(α)] vs. reciprocal of temperature (1/T) under different experimental conditions could be obtained as shown in Fig. S1 (see ESI†). In order to exclude the errors inherent to the initial and end periods, only the data in the range of 0.1 < α < 0.9 have been considered. It is clear from Fig. S1 (ESI†) that experimental data for separated peaks can be fitted with a good correlation coefficient, indicating that each process can be described by a single kinetic triplet. The corresponding fitting parameters for the SB function and activation energies are also summarized in Table 4.
As shown in Table 4, the activation energies obtained using a simple Kissinger method are very different from those obtained using a combined kinetic method, especially for the first step of tetrazene and the second step of MTX-1. The Kissinger method only takes into account of the peak values instead of the whole process, resulting in a large error especially when the decomposition reaction is not nth order. It is clear that the average activation energies from an isoconversion method are almost equal to those obtained using a combined kinetic method. Here the parameters for the SB function (m and n) and integrated pre-exponential factors (cA) are obtained simultaneously. For decomposition of tetrazene, the first step is the rate limiting step of the whole process, while the first two steps control the decomposition rate of MTX-1. The physical models for all processes are not easy to compare by simply looking at the m and n values, and therefore they will be plotted and normalized together with the ideal ones in the following sections.
4.3.3 Comparison to the physical meaningful ideal models.
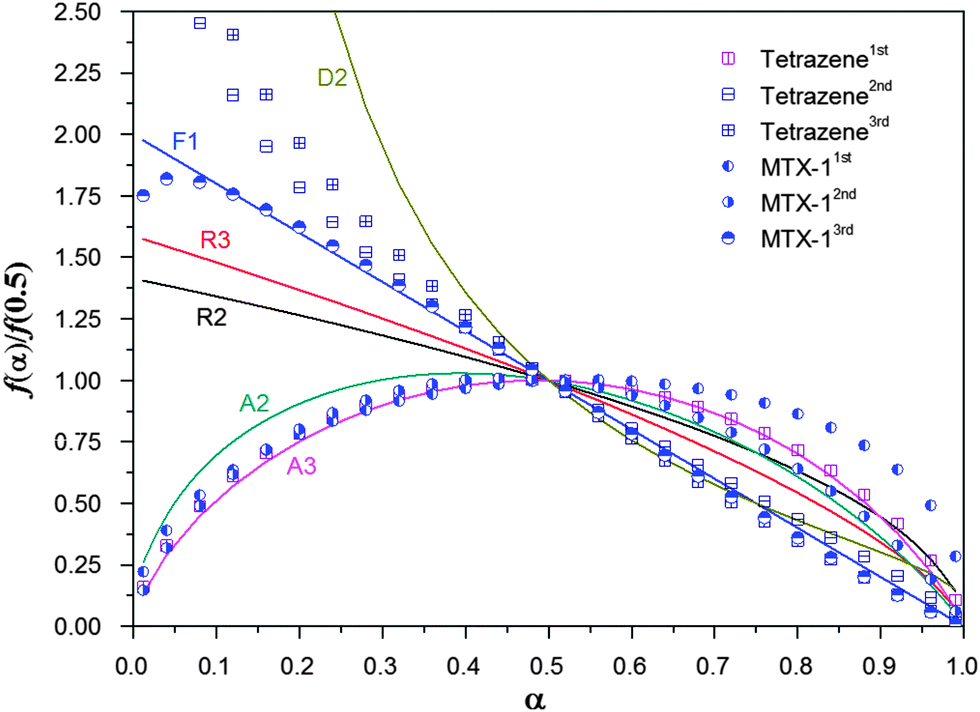
It is advantageous to compare the physical models (SB function) obtained above with some of the most usual ideal models in the literature. For a better comparison the functions are normalized at α = 0.5 as shown in Fig. 6. The corresponding mathematical expressions of the ideal models can be easily found in the literature.12,19
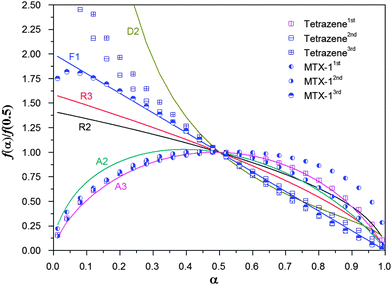 |
| | Fig. 6 A comparison of normalized curves of obtained kinetic models for MTX-1 and tetrazene with the ideal models: (1) by a master plots method and (2) by a combined kinetic analysis method; notes: “D2: two-dimensional diffusion; R2: phase boundary controlled reaction (contracting area), R3: phase boundary controlled reaction (contracting volume); F1, first order reaction, the so-called unimolecular decay law, where random nucleation followed by an instantaneous growth of nuclei; A2, A3: random nucleation and two and three dimensional growth of nuclei through different nucleation and nucleus growth models”. | |
It can be seen that the first decomposition step of tetrazene follows a three dimensional nucleation and nucleus growth model (A3), while the other two steps follow a two-dimensional diffusion model. It is reasonable that the first step is controlled by nucleation producing a large amount of light gases such as nitrogen. The first step of MTX-1 decomposition follows an autocatalytic model (AC) due to strong self-heating, while the second step is controlled by three dimensional nucleation and nucleus growth (A3), and the third step is a first order reaction (F1). It proves that the second decomposition step of tetrazene, the third steps of tetrazene and MTX-1 decomposition are due to evaporation/sublimation of volatile products from previous decomposition steps. In the following section, the probable chemical pathways that govern the rate-limiting steps of tetrazene and MTX-1 are discussed.
4.4 The chemical mechanism of the rate-limiting step
It is challenging to experimentally study the initial decomposition mechanism of energetic materials, which is of great importance for understanding the impact and shock sensitivity of energetic materials. As primary explosives, tetrazene and MTX-1 are not well investigated in terms of their initiation mechanism and inherent correlation with decomposition models. According to the above kinetic evaluation results, the rate-limiting step for both materials is the first step. Based on the theory in Section 3.3, the most probable reaction mechanism could be determined by the following procedures.
4.4.1 Molecular geometries.
The optimizations of stationary points along the reaction paths were calculated with the B3LYP/6-311++G** level. The stable tetrazene and MTX-1 as well as their decomposition products correspond to at least a local energy minimum on the potential energy surface without imaginary frequency. All optimized geometries including the reactants, transition states and products are shown in Fig. 7. The geometries tetrazene and MTX-1 as well as the tetrazole and nitrogen have an approximate planar structure, while the other products especially the transition states are deviated from the plan.
 |
| | Fig. 7 The optimized geometry along the reaction paths of tetrazene and MTX-1. | |
4.4.2 Possible reaction pathways.
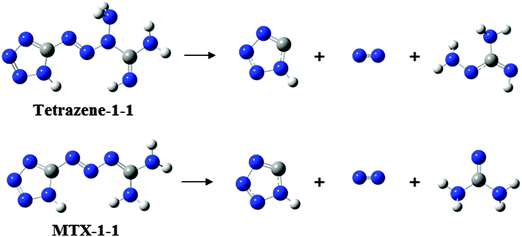
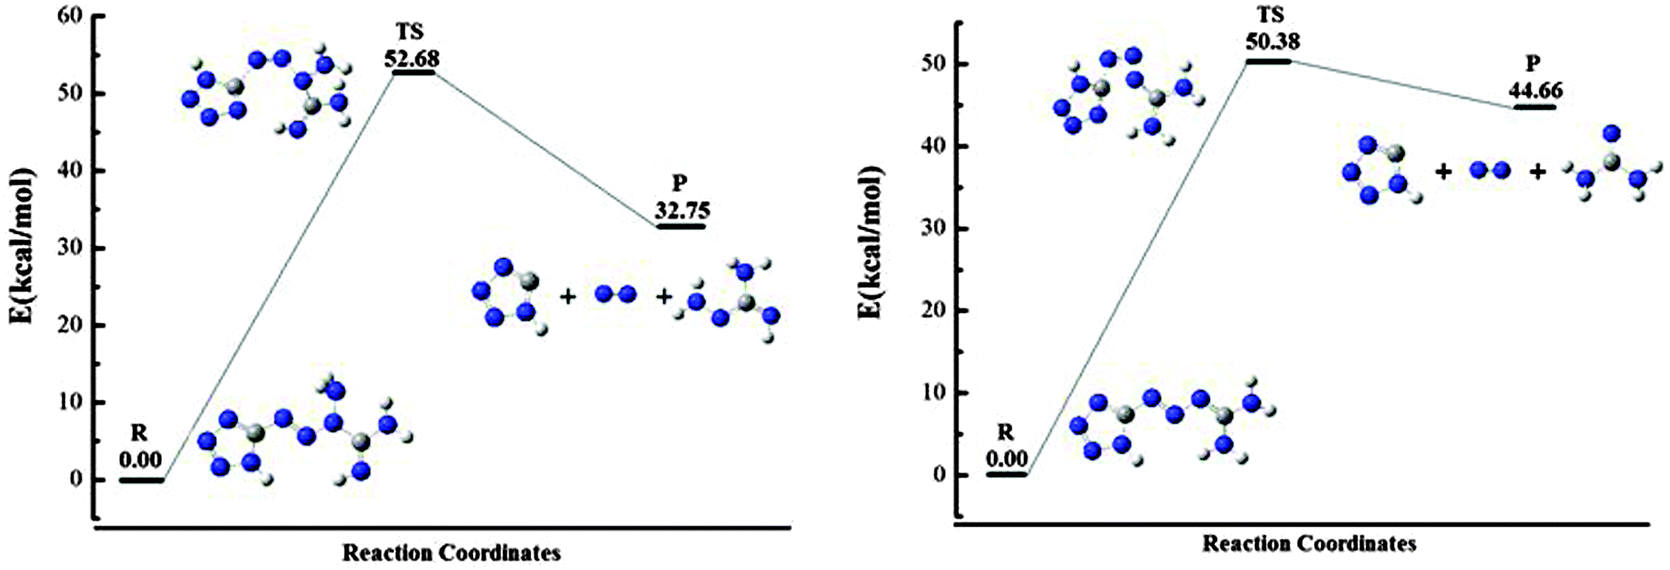
The minimum energy or transition state nature of the stationary points is verified from frequency analysis. All the transition states with the only imaginary frequency really connect the reactant and the product through the IRC calculation and their corresponding vibrational modes just reflect the initial decomposition process (Fig. 8). As can be seen, the first step of tetrazene and MTX-1 decomposition produced the 1H-tetrazole and nitrogen molecules as their common products. And the remaining parts were two similar configurations close to the guanidine group.
 |
| | Fig. 8 The potential energy curves of the initial decomposition pathways of tetrazene and MTX-1. | |
4.4.3 Energy parameters.
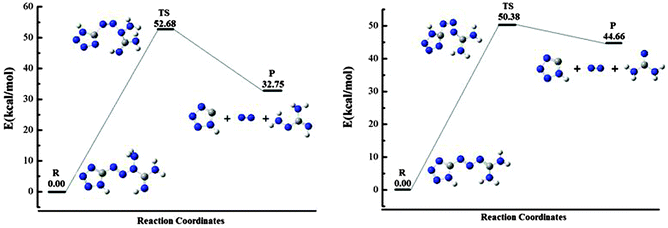
In addition, the possible chemical pathways for decomposition of tetrazene and MTX-1 have been further investigated and the minimum energy path (MEP) information was obtained based on the (single-point) level of theory. Fig. 9 depicts the reaction potential energy curves of the initial decomposition pathways of tetrazene and MTX-1. The corresponding energy parameters of reactions are listed in Table 5.
 |
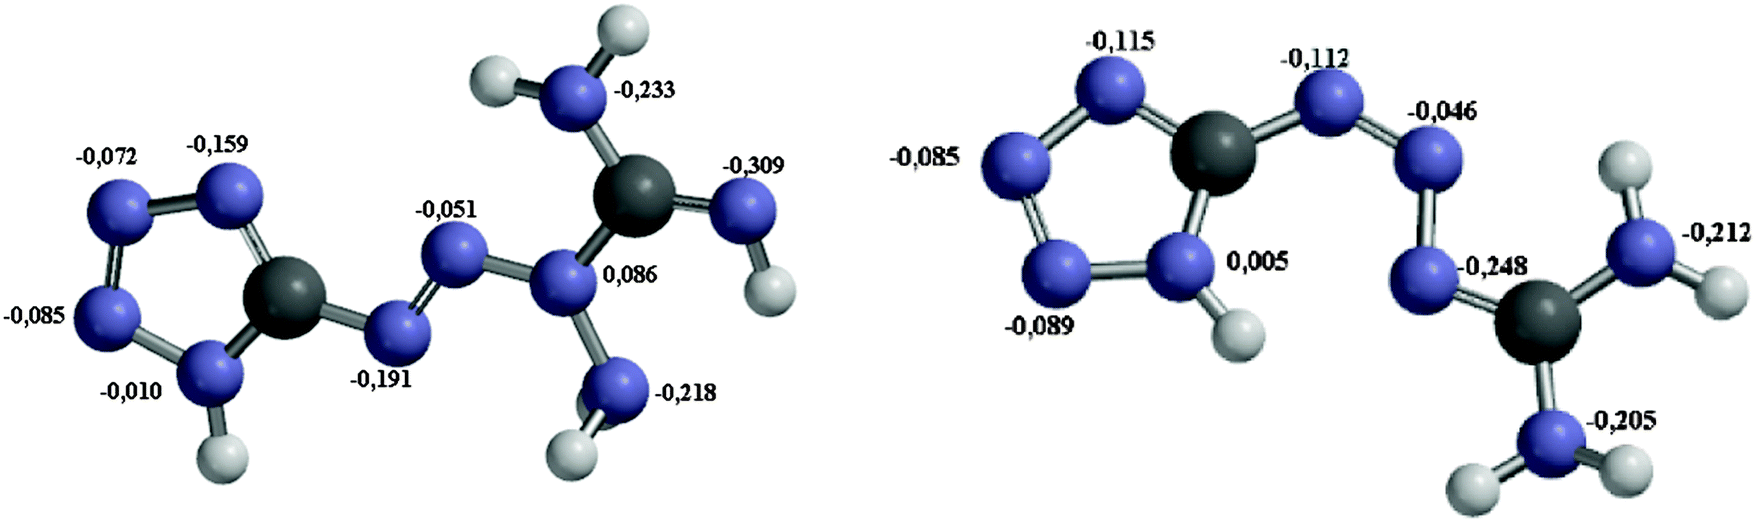
| | Fig. 9 Mulliken charges of tetrazene (left) and MTX-1 were calculated by the RB3LYP method on the basis set of CC-PVTZ for geometry optimization, and the real structures of tetrazene represent an internal salt according to the literature.33 | |
Table 5 The energy parameters of the initial decomposition pathways of tetrazene and MTX-1 (in kJ mol−1)
| B3LYP/6-311++G** |
ΔE |

|

|
V
MEP
|
E
a (cal.) |
E
a (exp.) |
Diff. (%) |
| Tetrazene-1 |
111.0 |
116.3 |
18.0 |
220.4 |
220.2 |
224.4 ± 1.5 |
<1 |
| MTX-1-1 |
186.9 |
195.9 |
92.3 |
210.8 |
210.6 |
225.8 ± 1.4 |
<6 |
It has been shown from Table 5 that the total energy changes (ΔE) of all reactions are positive, which means that the products possess higher energy compared to the reactants. Again, both the reaction enthalpy change ( ) and the Gibbs free energy (
 ) are positive, which implies that all possible reactions are endothermic and not spontaneous in the gas phase. The activation barriers, as most important parameters, reflected the nature of a chemical reaction. In this research, the activation barriers of the initial decomposition pathways of tetrazene and MTX-1 are 220.2 kJ mol−1 and 210.6 kJ mol−1, respectively, which are in accordance with the experimental values mentioned above.
According to above quantum chemical calculation results, the intramolecular electron transfer resulting in bond breaking –C1–N3– and –N5–N6– bonds to form N2, 1H-tetrazole, and aminocyanamide might be the initial channel for the first step of tetrazene decomposition. This idea could be supported by the atomic charges of these compounds (shown in Fig. 9) consisting of a set of point charges that simulate the combined electrostatic effects of both the atomic nuclei and the electrons. It has been reported that the N atom with the most negative charges is considered as an initial reaction center.31,32 In the condensed phase at a lower temperature, NH2 exists in the form of cyanamide, which could react with 1H-tetrazole to form 5-aminotetrazole (5-ATZ) and isocyanide (HCN) at a lower temperature. It has been found from experiments that tetrazene could undergo slow decomposition at 363 K for 6 days producing 5-ATZ.7 Regarding decomposition of MTX-1, cyanamide may also undergo polymerization to form melamine, melem and melon as the residue34,35 or further decomposition producing HCN, NH3 and N2 at a higher temperature through the following reaction.36
| NH2CN → 1/3NH3 + HCN + 1/3N2 |
This is the reason why there is a peak at the beginning of their decomposition corresponding to formation and transformation of HN3. There is no H2O was detected during decomposition of MTX-1. The production of NH3 is obviously less than tetrazene due to no proton transfer from H2O. However, as shown in Fig. 8, its initial step of thermal decomposition is similar to tetrazene, producing 1H-tetrazole, cyanamide and a large amount of N2. In this case, 5-ATZ may be formed under low temperature decomposition by attracting NH2 from cyanamide. The cyanamide would either undergo polymerization or decomposition mentioned above. In this case, the possible initial decomposition pathways of tetrazene and MTX-1 and the following polymerization processes could be deduced as Scheme 2.
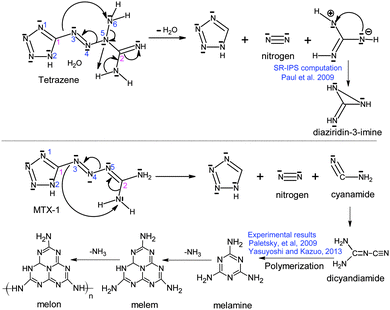 |
| | Scheme 2 The probable decomposition pathways of tetrazene and MTX-1. | |
5. Conclusions
The thermal behavior, decomposition kinetics and mechanisms of tetrazene and MTX-1 have been investigated using DSC, TG techniques and reactive molecular dynamic simulations. The following conclusions could be achieved:
(1) Tetrazene is melted-dehydrated at 128.4 °C with a heat absorption of 50 J g−1 and then it starts to decompose at around 118.6 °C with a peak temperature of 126.3 °C covered by a heat release of 1037 J g−1 at a heating rate of 1.0 °C min−1, while MTX-1 starts at 167.7 °C with a main peak of 191.1 °C covered by a heat change of 1829 J g−1 under the same conditions.
(2) MTX-1 is much more stable than tetrazene and MTX-1, but both of them decompose in three steps with different kinetic triplets. The apparent activation energy of their first step decomposition is almost the same (225 kJ mol−1), which are controlled by a three dimensional nucleation and growth model (A3).
(3) Quantum chemical calculations show that both tetrazene and MTX-1 could undergo a similar rate-limiting chemical reaction producing 1H-tetrazole and N2 for both cases, while the former also produces aminocyanamide and the latter produces cyanamide with the energy barriers of 224.4 and 225.8 kJ mol−1, respectively. These activation energy values are close to the above mentioned experimental results.
Acknowledgements
One of the authors M. Bartošková is financially supported by research project No. FCH-S-14-2487.
References
- S. V. Levchik, O. A. Ivashkevich, A. I. Balabanovich, A. I. Lesnikovich, P. N. Gaponik and L. Costa, Thermal-Decomposition of Aminotetrazoles.1. 5-Aminotetrazole, Thermochim. Acta, 1992, 207, 115–130 CrossRef CAS.
- P. K. Swain, H. Singh and S. P. Tewari, Energetic ionic salts based on nitrogen-rich heterocycles: A prospective study, J. Mol. Liq., 2010, 151(2–3), 87–96 CrossRef CAS.
-
Comprehensive Heterocyclic Chemistry III, ed. V. Ostrovskii, G. Koldobskii, A. R. Katritzky, C. A. Ramsden, E. F. Scriven and R. J. Taylor, Elsevier, Oxford, 2008, p. 257 Search PubMed.
- J. R. C. Duke, X-Ray Crystal and Molecular Structure of Tetrazene, J. Chem. Soc. D, 1971, 2 RSC.
- R. Bird, The Stab Sensitizing Action of Tetrazene, Materials Research Laboratories Technical Note, 1975, 362.
- R. J. Spear and P. P. Elischer, Studies on Stab Initiation. Sensitization of Lead Azide by Energetic Sensitizers, Aust. J. Chem., 1982, 35, 1 CrossRef CAS.
-
J. W. Fronabarger and M. D. Williams, Alternative to Tetrazene, US 20120145290 A1, 2012 Search PubMed.
- D. J. Whelan, R. J. Spear and R. W. Read, The thermal decomposition of some primary explosives as studied by differential scanning calorimetry, Thermochim. Acta, 1984, 80, 149–163 CrossRef CAS.
-
D. J. Whelan, M. R. Fitzgerald, The kinetic and thermal chemistry of thermal decomposition of the initiating explosive, Tetrazene, near its ignition temperature, DSTO-TR-0450 Report, 1996, Australia, Department of Defense, 1–10.
- S. Zeman, Q.-L. Yan and M. Vlcek, Recent advances in the study of the initiation of energetic materials using characteristics of their thermal decomposition, Part I. cyclic nitramines, Cent. Eur. J. Energ. Mater., 2014, 11(2), 173–189 CAS.
- Q.-L. Yan and S. Zeman, Theoretical evaluation of sensitivity and thermal stability for high explosives based on quantum chemistry methods: a brief review, Int. J. Quantum Chem., 2013, 113, 1049–1061 CrossRef CAS.
- L. A. Perez-Maqueda, J. M. Criado and P. E. Sanchez-Jimenez, Combined kinetic analysis of solid-state reactions: a powerful tool for the simultaneous determination of kinetic parameters and the kinetic model without previous assumptions on the reaction mechanism, J. Phys. Chem. A, 2006, 110(45), 12456–12462 CrossRef CAS PubMed.
-
W. M. Rinkenbach, G. O. Snellin, D. R. Cameron, Explosives, in Encyclopedia of Chemical Technology, ed. R. E. Kirk, D. F. Othmer, The Intersci. Encycl., Inc., New York, 1951, vol. 6, p. 15 Search PubMed.
-
J. W. Fronabarger and M. D. Williams, Alternative to tetrazene, PCT WO 2012/003031 A2, Pacific Sci. Energetic Materials Co., Chandler, AZ, 2012 Search PubMed.
- J. M. Criado, P. E. Sánchez-Jiménez and L. A. Pérez-Maqueda, Critical study of the isoconversional methods of kinetic analysis, J. Therm. Anal. Calorim., 2008, 92, 199–203 CrossRef CAS.
- J. Šesták and G. Berggren, Study of the kinetics of the mechanism of solid-state reactions at increasing temperatures, Thermochim. Acta, 1971, 3, 1 CrossRef.
- J. Málek, J. M. Criado, J. Šesták and J. Militký, The boundary conditions for kinetic models, Thermochim. Acta, 1989, 153, 429–432 CrossRef.
- J. Málek, Crystallization kinetics by thermal analysis, J. Therm. Anal. Calorim., 1999, 56, 763–769 CrossRef.
- L. A. Perez-Maqueda, J. M. Criado and P. E. Sanchez-Jimenez, Combined kinetic analysis of solid-state reactions: a powerful tool for the simultaneous determination of kinetic parameters and the kinetic model without previous assumptions on the reaction mechanism, J. Phys. Chem. A, 2006, 110(45), 12456–12462 CrossRef CAS PubMed.
- P. E. Sanchez-Jimenez, L. A. Perez-Maqueda, A. Perejon and J. M. Criado, A new model for the kinetic analysis of thermal degradation of polymers driven by random scission, Polym. Degrad. Stab., 2010, 95(5), 733–739 CrossRef CAS.
- Q.-L. Yan, S. Zeman, P. E. Sánchez-Jiménez, F.-Q. Zhao, L. A. Pérez-Maqueda and J. Málek, The effect of polymer matrices on the thermal hazard properties of RDX-based PBXs by using model-free and combined kinetic analysis, J. Hazard. Mater., 2014, 271, 185–195 CrossRef CAS PubMed.
-
R. G. Parr and W. Yang, Density-functional Theory of Atoms and Molecules, Oxford University Press, New York, 1989 Search PubMed.
- C. Lee, W. Yang and R. G. Parr, Phys. Rev., 1988, 37, 785 CAS.
- A. D. Becke, J. Chem. Phys., 1993, 98, 5648 CrossRef CAS.
- C. Gonzalez and H. B. Schlegel, J. Chem. Phys., 1989, 90, 2154 CrossRef CAS.
-
M. J. Frisch, G. W. Trucks, G. E. Scuseria, M. A. Robb, J. R. Cheeseman, J. A. Montgomery Jr., T. Vreven, K. N. Kudin, J. C. Burant, J. M. Millam, S. S. Iyengar, J. Tomasi, V. Barone, B. Mennucci, M. Cossi, G. Scalmani, N. Rega, G. A. Petersson, H. Nakatsuji, M. Hada, M. Ehara, K. Toyota, R. Fukuda, J. Hasegawa, M. Ishida, T. Nakajima, Y. Honda, O. Kitao, H. Nakai, M. Klene, X. Li, J. E. Knox, H. P. Hratchian, J. B. Cross, V. Bakken, C. Adamo, J. Jaramillo, R. Gomperts, R. E. Stratmann, O. Yazyev, A. J. Austin, R. Cammi, C. Pomelli, J. W. Ochterski, P. Y. Ayala, K. Morokuma, G. A. Voth, P. Salvador, J. J. Dannenberg, V. G. Zakrzewski, S. Dapprich, A. D. Daniels, M. C. Strain, O. Farkas, D. K. Malick, A. D. Rabuck, K. Raghavachari, J. B. Foresman, J. V. Ortiz, Q. Cui, A. G. Baboul, S. Clifford, J. Cioslowski, B. B. Stefanov, G. Liu, A. iashenko, P. Piskorz, I. Komaromi, R. L. Martin, D. J. Fox, T. Keith, M. A. Al-Laham, C. Y. Peng, A. Nanayakkara, M. Challacombe, P. M. W. Gill, B. Johnson, W. Chen, M. W. Wong, C. Gonzalez and J. A. Pople, GAUSSIAN 9 (Revision A.01), Gaussian, Inc, 2009 Search PubMed.
- S. Vyazovkin, A. K. Burnham, J. M. Criado, L. A. Pérez-Maqueda, C. Popescu and N. Sbirrazzuoli, ICTAC Kinetics Committee recommendations for performing kinetic computations on thermal analysis data, Thermochim. Acta, 2011, 520, 1–19 CrossRef CAS.
- E. Moukhina, Determination of kinetic mechanisms for reactions measured with thermoanalytical instruments, J. Therm. Anal. Calorim., 2012, 109(3), 1203–1214 CrossRef CAS.
- Q.-L. Yan, S. Zeman, R. Svoboda, A. Elbeih and J. Málek, The effect of crystal structure on the thermal initiation of CL-20 and its C4 bonded explosives (II): models for overlapped reactions and thermal stability, J. Therm. Anal. Calorim., 2013, 112(2), 837–849 CrossRef CAS.
- A. Perejón, P. E. Sánchez-Jiménez, J. M. Criado and L. A. Pérez-Maqueda, Kinetic analysis of complex solid-state reactions. A new deconvolution procedure, J. Phys. Chem. B, 2011, 115(8), 1780–1791 CrossRef PubMed.
- R. Svoboda and J. Málek, Applicability of Fraser–Suzuki function in kinetic analysis of complex crystallization processes, J. Therm. Anal. Calorim., 2013, 111(2), 1–12 CrossRef.
- P. Politzer and J. S. Murray, Relationships between dissociation energies and electrostatic potentials of C-NO2 bonds: applications to impact sensitivities, J. Mol. Struct., 1996, 376(1), 419–424 CrossRef CAS.
- S. Zeman and Z. Friedl, A New Approach to the Application
of Molecular Surface Electrostatic Potential in the Study of Detonation, Propellants, Explos., Pyrotech., 2012, 37(5), 609–613 CrossRef CAS.
- M. Yasuyoshi and H. Kazuo, Thermal decomposition of aminoguanidinium 5,5′-azobis-1H-tetrzazolate, Thermochim. Acta, 2013, 553, 68–77 CrossRef.
- A. A. Paletsky, N. V. Budachev and O. P. Korobeinichev, Mechanism and kinetics of the thermal decomposition of 5-aminotetrazole, Kinet. Catal., 2009, 50, 627 CrossRef CAS.
- A. S. Rozenberg, Yu. N. Arsenev and V. G. Voronkov, Fiz. Goreniya Vzryva, 1970, 6(3), 302 CAS.
Footnote |
| † Electronic supplementary information (ESI) available. See DOI: 10.1039/c4cp03479a |
|
| This journal is © the Owner Societies 2014 |
Click here to see how this site uses Cookies. View our privacy policy here. 
 Open Access Article
 This Open Access Article is licensed under a Creative Commons Attribution-Non Commercial 3.0 Unported Licence
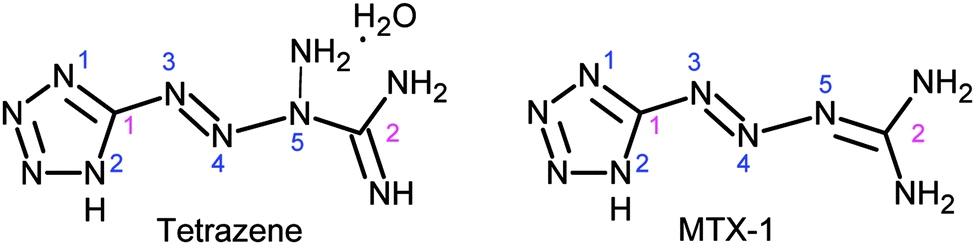


 ) and the Gibbs free energy (
 ) are positive, which implies that all possible reactions are endothermic and not spontaneous in the gas phase. The activation barriers, as most important parameters, reflected the nature of a chemical reaction. In this research, the activation barriers of the initial decomposition pathways of tetrazene and MTX-1 are 220.2 kJ mol−1 and 210.6 kJ mol−1, respectively, which are in accordance with the experimental values mentioned above.