 Open Access Article
Solid–ionic liquid interfaces: pore filling revisited†
M. T.
Heinze
a,
J. C.
Zill
b,
J.
Matysik
b,
W. D.
Einicke
a,
R.
Gläser
a and
A.
Stark
*ac
aInstitute of Chemical Technology, Universität Leipzig, Linnéstrasse 3, D-04103 Leipzig, Germany
bInstitute of Analytical Chemistry, Universität Leipzig, Linnéstrasse 3, D-04103 Leipzig, Germany
cEduard-Zintl Institute for Inorganic and Physical Chemistry, TU Darmstadt, Alarich-Weiss-Str. 8, D-64287 Darmstadt, Germany. E-mail: Annegret.stark@outlook.de
First published on 30th September 2014
Abstract
The properties of ionic liquids on ordered and non-ordered mesoporous silicas (silica gel, MCM-41, SBA-15) were studied by nitrogen sorption, mercury intrusion and thermogravimetric analyses, as well as 129Xe-NMR spectroscopy. The ionic liquids investigated are based on the 1-hexyl-3-methylimidazolium cation, which was combined with anions of low (bis(trifluoromethanesulfonyl)imide; [NTf2]−), medium (trifluoromethylsulfonate; [CF3SO3]−) to high (acetate; [OAc]−) basicity. The surface coverage depends on both the type of ionic liquid and support used. This results not only in layer or droplet formation, but also in different physico-chemical properties of the ionic liquid when compared to the bulk, depending mainly on the strength of interaction at the interface. Furthermore, the mercury intrusion analysis of mesopores is shown not to be suitable for supported ionic liquids.
Introduction
In 2002, Mehnert et al. introduced Supported Ionic Liquid Catalysis (SILC) on the example of hydroformylation and hydrogenation. The catalyst material consisted either of a covalently anchored ionic liquid on silica gel, on which additionally a solution of a catalyst-containing ionic liquid was physisorbed,1 or only of a physisorbed ionic liquid supported on silica gel.2 This approach of immobilising ionic liquids was extended by Riisager and Wasserscheid, who extensively investigated SILP (Supported Ionic Liquid Phase) materials for various gas or liquid phase reactions.3–6Nowadays, SILP materials are defined as materials that feature a solid porous support containing a certain amount of physisorbed and/or covalently anchored ionic liquid, and in which a well-defined molecular catalyst is dissolved. If, on the other hand, a solid catalyst (dispersed in the ionic liquid, deposited on the support, or acting as a carrier itself) is present, the material is referred to as Solid Catalyst with Ionic Liquid Layer (SCILL).7,8
Irrespective of the physical state of the catalyst, Supported Ionic Liquid-type materials (from hereon referred to as SIL) have been used in several reactions, such as hydroformylations,5,9 hydrogenations,2,7,8,10–13 the water–gas shift reaction,14 hydroaminations,15 Heck reactions,16 epoxidations,17etc. These reactions have been reported to proceed with good reaction rates, leading to high yields and often improved selectivities,18 as well as improved catalyst stability.6 Other applications lie in the areas of gas cleaning, e.g. removal of sulfur-containing compounds from hydrocarbons, and gas separations.19–23 These and other applications, as well as derivatives of SIL-type materials have been reviewed.24–29 Compared to processes using non-confined ionic liquids in the bulk phase, SIL concepts feature a tremendous reduction of ionic liquid inventory and hence process costs, a potential improvement where mass transfer limitations play a role due to an increased interface (catalysis in the diffusion layer), and the possibility to operate continuously, using fixed bed reactors. Furthermore, the large variability of the ionic liquid structures that can be applied offers the advantage of being able to control the interface properties of the materials regarding e.g. the solubility of the starting materials or intermediates, and thermal stability.7,9
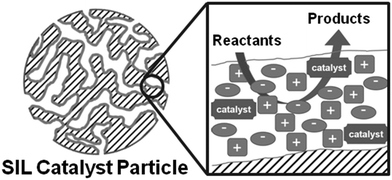
A typical model representation of the circumstances in SILP catalysis is shown in Fig. 1.5 A non-ordered silica gel with a homogeneous layer of ionic liquid of constant thickness is implied, in which a molecular catalyst is dissolved. Earlier findings of some of us showed that the physical properties of ionic liquids in confinement deviate tremendously from those of the bulk phase, as demonstrated by a combined temperature-resolved 2H and 19F solid-state Nuclear Magnetic Resonance (NMR) spectroscopic and differential scanning calorimetric study of perdeuterated N-ethylpyridinium bis(trifluoromethanesulfonyl)imide confined in silica gel. The confined salt showed only one broad phase transition (at 215–245 K; solid II/liquid), indicating solidification as phase, while the bulk ionic liquid showed two phase transitions (at 287–289 K; solid II/solid I; rotation of the ethyl group, and 298–306 K, solid I/liquid). Hence, the solid–liquid transition of the ionic liquid in confinement is reduced by 80 K when compared to the bulk material.30 Related solid-state NMR studies of 1-ethyl-3-methylimidazolium bis(trifluoromethanesulfonyl)imide ([C2mim][NTf2]) confined in technical grade silica gel 100 (0–56 vol%) indicated surface-alkyl chain interactions at low loadings.14
In general, in the majority of cases, studies of the solid–ionic liquid interface are carried out on non-porous substrates using a macroscopic, thick film, demonstrating the formation of solid-like layered structures parallel to the surface, independent of the ionic liquid and the type of substrate used.31–39 More recent Angle-Resolved X-ray Photoelectron Spectroscopy (ARXPS) studies on ultrathin imidazolium-based ionic liquid films give information on the molecular arrangement of the ions on the surface at low loadings.40–42 For example, a bilayered structure for the first [C2mim][NTf2] layer on glass is reported, with the cation in direct substrate contact, and the anion arranged above the cation, which agrees well with molecular dynamics simulations.40,43 At higher loadings, three-dimensional island growth on top of the first layer is observed. Similar results were obtained in a study combining Atomic Force Microscopy (AFM) and ARXPS investigating 1,2-dimethyl-3-propylimidazolium bis(trifluoromethanesulfonyl)imide on a silicon wafer.44 In contrast, a checkerboard-type arrangement was found on Au(111) with cations and anions adsorbed next to each other on the surface.45
Furthermore, some empirical evidence exists showing that the choice of the confinement of ionic liquids affects the outcome of chemical conversions. Hence, Yang et al. have demonstrated in the hydroformylation of hexene that the reaction rate and selectivity were improved when using the ionic liquid 1,1,3,3-tetramethylguanidinium lactate supported on MCM-41 compared to silica gel.9 Additionally, the influence of the solvation layer of ionic liquids on electrochemical reactions was shown by Endres et al.39 These findings demonstrated how the wetting behavior and molecular arrangement of ionic liquids at the ionic liquid–solid interface depends on the specific interactions of both components and thus are of vital importance for many applications.
We were thus wondering whether the spectroscopic observations made for non-porous supports are also observed in systems with defined porosity, and whether the topology is affected by the amount of ionic liquid loading. In other words, is the commonly assumed model (Fig. 1) representative for the real circumstances in confinement, and does a layer of homogeneous thickness form? Furthermore, are the textural properties of SIL-type materials affected by the type of ionic liquid and/or the type of support material chosen?
In an attempt to answer these questions, we chose to investigate several solid support materials based on silicate (non-ordered silica gel (MB), ordered mesoporous MCM-41, micro- and mesoporous SBA-15) in combination with a range of ionic liquids which feature anions of different basicity46,47 by nitrogen sorption, mercury intrusion, thermogravimetric analyses and 129Xe-NMR spectroscopy. For this purpose, the solid supports were loaded by incipient wetness impregnation from solutions of the respective ionic liquid in acetone, using different concentrations of ionic liquid. After removal of acetone in vacuo, materials resulted with ionic liquid loadings between 5 and 85 wt%, hence representing typical loadings used in catalytic applications.
Experimental
Support preparation
Spherical silica gel MB 75–200 (herein referred to as MB) from Fuji Silysia Chemicals Ltd was dried at 423 K. Spherical MCM-41 was synthesised from silica gel MB 75–200 (Fuji Silysia Chemicals Ltd; dried at 423 K) by pseudomorphic transformation.48–50 42 cm3 of an aqueous cetyltrimethylammonium hydroxide solution (0.08 M) was added per 1 g MB 75–200 in a Teflon container and kept under static conditions for 72 h at 393 K under autogenous pressure. The material was filtered, washed with deionised water and calcined at 812 K for 6 h in air to remove the surfactant. SBA-15 was synthesised similar to the procedure of Zhao et al.51,52 One gram of Pluronic P123 was dissolved in a mixture of 15 g water and 30 g HCl (2N) at 308 K. After dissolution, 2.1 g of tetraethylorthosilicate was added dropwise. After aging for 24 h, the resulting mixture was kept under static conditions for 48 h at 363 K in a Teflon container under autogenous pressure. The resulting material was filtered, washed with deionised water and calcined at 813 K for 6 h to remove the surfactant.Ionic liquids
1-Hexyl-3-methylimidazolium bis(trifluoromethanesulfonyl)imide ([C6mim][NTf2], Lot EQ500831) and 1-hexyl-3-methylimidazolium trifluoromethanesulfonate ([C6mim][OTf], Lot S4907466 745) were purchased from Merck and used as received. 1-Hexyl-3-methylimidazolium chloride ([C6mim]Cl) was prepared according to the literature.53Preparation of 1-hexyl-3-methylimidazolium acetate
1-Hexyl-3-methylimidazolium acetate ([C6mim][OAc]) was prepared by ion exchange in a column. Conditioned Lewatit® MP 62 (33 g) was treated with acetic acid (1000 cm3, c = 0.4 mol L−1) and washed until neutral with deionised water. An aqueous 1-hexyl-3-methylimidazolium chloride solution (c = 0.4 mol L−1) was passed over the column and all fractions were tested for chloride with silver nitrate. All chloride-free fractions were combined and the 1-hexyl-3-methylimidazolium acetate was separated by distillation. The resulting ionic liquid was dried at 333 K under vacuum (yield 80%).SIL-type material preparation
The incipient wetness impregnation method was used for the preparation of the SIL-type materials. 200 mg of the dried support were immersed within a solution of the relevant amount ionic liquid in acetone using varying concentrations of ionic liquid. After 24 h, the samples were placed in a vacuum oven at 363 K for 6 h to remove acetone. The ionic liquid content (weight constancy) was ascertained gravimetrically after cooling. The materials investigated are specified as follows: “Type of material” (MB, MCM or SBA) – “type of ionic liquid” (OAc, OTf, NTf2 for 1-hexyl-3-methylimidazolium acetate, trifluoromethanesulfonate or bis(trifluoromethanesulfonyl)imide, respectively) – “amount of ionic liquid per gram support” (mmol g−1).Material characterisation
Nitrogen sorption isotherms were measured at 77 K using an ASAP 2010 volumetric adsorption analyzer from Micromeritics. Each sample was degassed at 393 K for 24 h in vacuo. The BET surface areas were estimated from the linearised BET-equation,54 micro- and mesopore volumes and surfaces were determined by the t-plot method in the t-regions from 0.35–0.5 nm and 1.1–1.8 nm, respectively.55 Pore diameter distributions were calculated with carbon-based DFT models from Quantachrome as specified. The relative percentage error of the density at 77 K of the confined ionic liquid, as calculated from the remaining free pore volume and the amount of ionic liquid present, has been estimated to be 10.1% (t-plot + balance). Thermogravimetric Analysis (TGA) measurements were carried out on a Netzsch STA 409 apparatus in flowing air (75 cm3 min−1) at a heating rate of 5 K min−1. Mercury intrusion measurements were performed on a Quantachrome® POREMASTER using a contact angle for mercury of 141. The total specific pore volumes from the mercury intrusion curves were calculated as the cumulative specific pore volume of all non-interparticle pores with pore diameters above 4 nm. NMR spectra were recorded on a Bruker DRX-400 spectrometer operating at 110.63 MHz for 129Xe. Samples were placed in tubes of 5 mm outer diameter and exposed to 327 cm3 min−1 of hyperpolarised 129Xe under continuous flow at ambient pressure. Hyperpolarised 129Xe was obtained by spin-exchange optical pumping using circular polarized light from a 100 W diode array laser (Lissotschenko Mikrooptik) for optical pumping at the D1 transition of rubidium (794.7 nm) within a Pyrex pumping cell placed in a field of 1.3 mT containing a small amount of rubidium. A mixture of 88.7% helium, 8.9% nitrogen and 2.4% xenon (natural abundance) was optically pumped at 418 K and a total pressure of 4 bar to a polarisation grade of about 12% hyperpolarisation. 256 FIDs were accumulated with 9.2 ms (p) pulses and 5 s delays. The chemical shifts are referenced to the signal of hyperpolarised xenon gas measured before and after spectral acquisition. Batches of SIL-materials prepared for NMR measurements are denoted MCM-NTf2-0.23-NMR, MCM-NTf2-0.47-NMR and MCM-NTf2-0.78-NMR.Results and discussion
Silica support characterisation
Table 1 details the structural parameters of the pristine support materials MCM-41, silica gel (MB) and SBA-15. Detailed information including the nitrogen sorption isotherms and pore diameter distributions etc. are shown in the ESI† (see Tables S1–S3 and Fig. S1a, 2a and 3a). The isotherms of the silica support materials show typical type IV N2-sorption isotherms with capillary condensation at p/p0 ≈ 0.35, 0.6 and 0.65 for MCM-41, silica gel (MB) and SBA-15, respectively. Furthermore, MB exhibits a characteristic H2, and the SBA-15 a characteristic H1 hysteresis, according to the IUPAC classification.56 The non-ordered MB material shows a broad pore diameter distribution between 4.5 and 9.5 nm with a maximum at 6.9 nm. In contrast, the pores of the ordered MCM-41 and SBA-15 are very uniform causing narrow pore diameter distributions51,57 with maxima at 4.2 and 8.1 nm, respectively. The pores of MCM-41 are hexagonally arranged in a honeycomb-like structure with thin pore walls between 1 and 1.5 nm.57 In contrast, SBA-15 possesses thick pore walls between 3.1 and 6.4 nm in which additionally micropores are present.51,58,59 These ordered supports show negligible pore connectivity in contrast to the typical high pore connectivity of non-ordered silica gel (MB).SIL-type material characterisation: nitrogen sorption isotherm analysis
Fig. 2 shows the nitrogen sorption isotherms obtained for [C6mim][OAc] on MCM-41 (both, as a function of the mass of material (left) and normalised to the mass of the pristine support (right)) as calculated by eqn (1), | (1) |
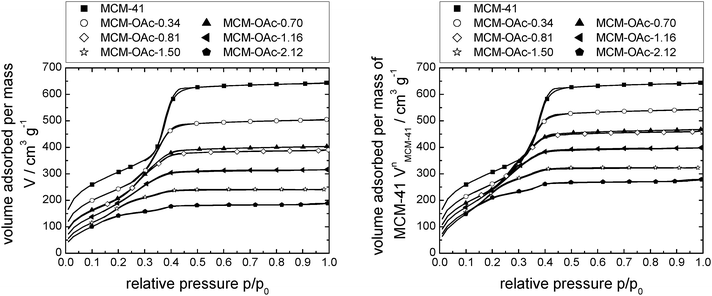 | ||
| Fig. 2 N2-sorption isotherms at 77 K of MCM-41-based materials impregnated with incrementally increasing amounts of [C6mim][OAc], as volume absorbed per mass of material (left) and as volume absorbed per mass of support (right). Note that the number of data points displayed is reduced for clarity. Complete data can be found in Fig. S25 (ESI†). | ||
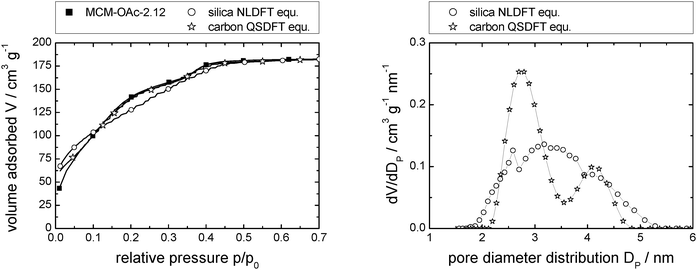 | ||
| Fig. 3 N2-sorption isotherm of MCM-OAc-2.12 (left; measured: squares; calculated using NLDFT and QSDFT: open circles and open stars, respectively), and resulting pore diameter distributions (right). Note that the number of data points displayed is reduced for clarity (left). Complete data can be found in Fig. S1d (ESI†). | ||
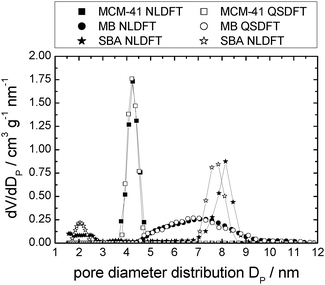 | ||
| Fig. 4 Pore diameter distributions for the pristine supports studied herein, calculated by NLDFT or QSDFT. | ||
Ionic liquids confined in MCM-41
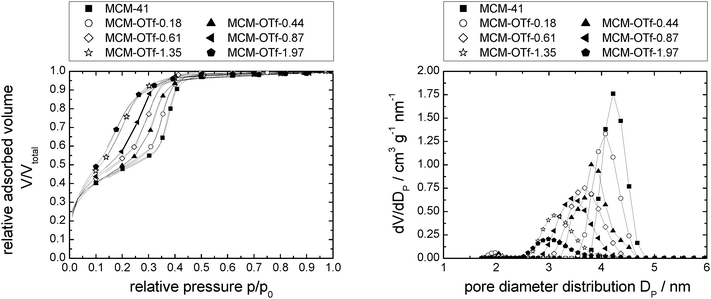 | ||
| Fig. 5 N2-sorption isotherms normalised to the mass of support at 77 K (left) and pore diameter distribution (right) of MCM-41 modified with incrementally increasing amounts of [C6mim][OTf]. Note that the number of data points displayed is reduced for clarity. Complete data can be found in Fig. S26 (ESI†). | ||
 | ||
| Fig. 6 Pore volume (left) and calculated density (right) vs. loading of MCM-41 modified with incrementally increasing amounts of [C6mim][OTf]. | ||
The calculated density increases from 0.41 to 0.86 g cm−3 (where it levels of) with increasing amounts of [C6mim][OTf] present, indicating that the ionic liquid is initially not present as a bulk phase, but the ionic liquid likely exists as ion pairs or small clusters on the surface. For the assessment of the bulk densities of [C6mim][OAc], [C6mim][OTf] and [C6mim][NTf2], a group contribution model was used for calculation, which has been shown to predict densities to within ±0.36%. Comparison with available literature data shows good agreement (Table 2). Taking into account the densities thus calculated, and the correlation between liquid and solid densities determined for ionic liquids by Ye and Shreeve,65 the densities for the solid ionic liquids were estimated, and are shown in Table 2. Both the liquid and solid phase densities of [C6mim][OTf] (1.24 and 1.42 g cm−3, respectively) are much higher than that estimated from the sorption isotherm analysis, demonstrating that the bulk density deviates substantially from the density in confinement. If the maximum density in confinement (determined by linear extrapolation of the pore volume/loading-plot to complete pore filling, see Fig. S7, ESI†) is considered, which reflects the most dense packing achievable in this confinement (i.e. lowest free molar volume), one can calculate a theoretical monolayer thickness41 and thus estimate the minimum number of moles required for monolayer formation, should this indeed occur. For this purpose, we define a monolayer as a layer of ion pairs assuming a cubic model for the determination of the layer thickness from the bulk density, which has proven to give reliable estimations in the literature.66 From Tables 1 and 2 it becomes obvious that complete monolayer formation could occur in principle for loadings between materials MCM-OTf-1.35 and MCM-OTf-1.97, which is also the range where the density levels off (Fig. 6). At this stage, the question arises whether layer formation does take place in a way that the ions are successively added to the surface to form a monolayer, before adding on top of already deposited ions (first case). This would indicate stronger silica–ion interactions than ion–ion interactions. Otherwise, one could imagine the initial (forced) deposition of some ions on silica, and further accumulation (aggregate- or drop-formation) of successively added ions on top of the already deposited ones (second case). This case would indicate preferred ion–ion interactions. In the first case, one would expect that the pore diameter distribution becomes slightly broader by a maximum of the thickness of two monolayers (in this case 2 × 0.84 nm). Furthermore, the mean diameter should shift linearly to smaller numbers with increasing ionic liquid loading. In the second case, the pore diameter distribution should become broader and the mean diameter should remain constant at the value of the pristine support, and only if a certain threshold is overcome in which the drops merge, a shift to lower values should occur.
| [OTf]− | [OAc]− | [NTf2]− | |
|---|---|---|---|
| a Presuming cubic geometry of the ion pair.66 b Calculated with a pore diameter of 4.2, 6.9 and 8.1 nm (MCM-41, MB and SBA, respectively). | |||
ρ
(bulk,![[thin space (1/6-em)]](https://www.rsc.org/images/entities/char_2009.gif) 298.15K, 298.15K,![[thin space (1/6-em)]](https://www.rsc.org/images/entities/char_2009.gif) pred.) [g cm−3]67 pred.) [g cm−3]67 |
1.24 | 1.04 | 1.37 |
ρ
(bulk,![[thin space (1/6-em)]](https://www.rsc.org/images/entities/char_2009.gif) 298.15K, 298.15K,![[thin space (1/6-em)]](https://www.rsc.org/images/entities/char_2009.gif) lit.) [g cm−3] lit.) [g cm−3] |
1.2468 | 1.0269 | 1.3770,71 |
ρ
(bulk,![[thin space (1/6-em)]](https://www.rsc.org/images/entities/char_2009.gif) solid, solid,![[thin space (1/6-em)]](https://www.rsc.org/images/entities/char_2009.gif) pred.) [g cm−3]65 pred.) [g cm−3]65 |
1.42 | 1.22 | 1.54 |
ρ
(confined,![[thin space (1/6-em)]](https://www.rsc.org/images/entities/char_2009.gif) 100%filling, 100%filling,![[thin space (1/6-em)]](https://www.rsc.org/images/entities/char_2009.gif) MCM-41) [g cm−3] MCM-41) [g cm−3] |
0.87 | 0.79 | 1.03 |
| Max. mols per mass of MCM-41(100%filling) [mmol g−1] | 2.74 | 3.48 | 2.30 |
| Theoretical monolayer thickness(MCM-41) [nm]a | 0.84 | 0.78 | 0.90 |
| Min. mols per mass of MCM-41(monolayer) [mmol g−1]b | 1.74 | 2.08 | 1.53 |
ρ
(confined,![[thin space (1/6-em)]](https://www.rsc.org/images/entities/char_2009.gif) 100%filling, 100%filling,![[thin space (1/6-em)]](https://www.rsc.org/images/entities/char_2009.gif) MB) [g cm−3] MB) [g cm−3] |
0.87 | 0.82 | 1.08 |
| Max. mols per mass of MB(100%filling) [mmol g−1] | 2.45 | 3.24 | 2.16 |
| Theoretical monolayer thickness(MB) [nm]a | 0.85 | 0.77 | 0.88 |
| Min. mols per mass of MB(monolayer) [mmol g−1]b | 1.06 | 1.29 | 0.97 |
ρ
(confined,![[thin space (1/6-em)]](https://www.rsc.org/images/entities/char_2009.gif) 100%filling, 100%filling,![[thin space (1/6-em)]](https://www.rsc.org/images/entities/char_2009.gif) SBA) [g cm−3] SBA) [g cm−3] |
0.76 | 0.65 | 1.31 |
| Max. mols per mass of SBA(100%filling) [mmol g−1] | 2.45 | 2.92 | 3.00 |
| Theoretical monolayer thickness(SBA) [nm]a | 0.89 | 0.84 | 0.83 |
| Min. mols per mass of SBA(monolayer) [mmol g−1]b | 0.95 | 1.08 | 1.10 |
Closer analysis of the data shown in Fig. 5, right, reveals that [C6mim][OTf] is an example of the first case, in which the interactions between silica and ionic liquid are more energetically favored than drop formation. Hence, the maximum of the pore diameter distribution reaches 1.8 nm in material MCM-OTf-1.97, and a linear shift of the pore diameter distribution maximum occurs (see Fig. S5, ESI†).
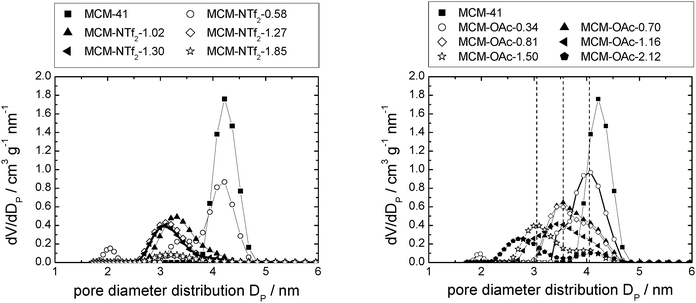 | ||
| Fig. 7 Pore diameter distribution of MCM-41-based materials with incrementally increasing amounts of [C6mim][NTf2] (left), and [C6mim][OAc] (right). | ||
In the case of [C6mim][OAc]-based materials, the pore diameter distribution maximum shifts linearly to lower values, and the pore diameter distribution increases with increasing amounts of ionic liquid, similar to what has been observed for [C6mim][OTf]-based materials (see Fig. S5, ESI†). The pore diameter distribution for materials MCM-OAc-1.5 and −2.12 is between 2.0 and 2.5 nm, respectively. Regarding the silica–ionic liquid interface, this corresponds to 1.0–1.25 nm of film thickness, translating into 1.3–1.6 layers of 0.78 nm thickness (Table 2). These values lie somewhat above the theoretical value of the monolayer thickness, and indicate the presence of some heterogeneities. Additionally, the profiles display shoulders or second maxima, with an approximate least common multiple of 0.5 nm of the distance. Although the deposition of ions on silica prevails the deposition of ions on ions, the deposition of ions on already deposited ions occurs also to a certain degree. In the case of [C6mim][NTf2]-based materials, the pore diameter distribution varies non-linearly, as it firstly increases, then decreases upon addition of incremental amounts of ionic liquid (see Fig. S5, ESI†). This means that in certain areas of the material, the pores are decisively narrowed, while others remain virtually free of ionic liquid. In light of the highest density of the ionic liquid being determined for the lowest loadings, this clearly shows that drop formation prevails, before the surface is completely covered.
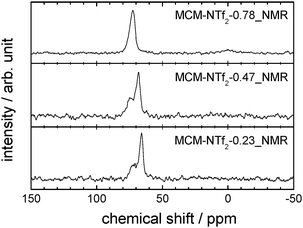
This view is complemented by 129Xe-NMR spectroscopy. Nuclear magnetic resonance is a powerful tool for probing the morphology of surfaces dependent on their chemical properties, molecular structure and dynamics. Since direct surface NMR signals are often not distinguishable from the bulk signals, gas NMR provides an alternative approach. Adsorbed 129Xe gas is frequently used to probe surfaces in terms of their chemical nature and pore sizes.72 Due to the low number of spins contributing to the surface signals, these NMR studies can be improved by the introduction of hyperpolarisation techniques, such as spin-exchange optical pumping (SEOP).73Fig. 8 shows the spectra of the materials MCM-NTf2-0.23_NMR, -0.47_NMR and -0.78_NMR (for material characterisation, see Fig. S8 and Table S4, ESI†).
The spectra of materials with low loading (MCM-NTf2-0.23_NMR and -0.47_NMR) show two very broad signals at about 68 ppm and 74 ppm. For a material with a very narrow pore diameter distribution such as the investigated MCM-41, two separate signals are an indicator for at least two kinds of surfaces with different chemical properties. The fact that these two signals are broad (552 Hz FWHM) and only shifted by approximately 6 ppm indicates a high exchange rate of xenon between both chemical types of surfaces and supports the interpretation that droplets of the ionic liquid are in close distance to the surface of MCM-41. At higher [C6mim][NTf2] loadings (MCM-NTf2-0.78_NMR), only a single resonance at 73.2 ppm is visible, suggesting that the ionic liquid droplets have merged and that the surface of MCM-41 is covered with ionic liquid completely, as the signal at 68 ppm has vanished.
In the literature, diverging evidence has been presented regarding the behavior of [NTf2]−-based ionic liquids on silicate supports. AFM measurements suggested three-dimensional growth of nano-droplets34 instead of layer formation.
X-ray Photoelectron Spectroscopy (XPS) and AFM studies showed that a complete monolayer is firstly deposited, before droplets are formed.40,44 Molecular dynamics simulations of [C4mim][NTf2] confined in highly hydroxylated silica with a cylindrical pore diameter of 4.8 nm as a function of loading showed distinct layer formation.43 Hayes et al. speculate that the structure of the ionic liquid on the support may depend on whether it was obtained by vapor deposition or by other methods, such as by incipient wetness impregnation,74 and surely also the number of hydroxyl groups on the surface plays a vital role. Furthermore, it is known that an increased surface roughness of the surface can be responsible for a lower level of interfacial order, and in some instances, surface irregularities larger than monolayer thickness can completely eliminate layer formation.74,75
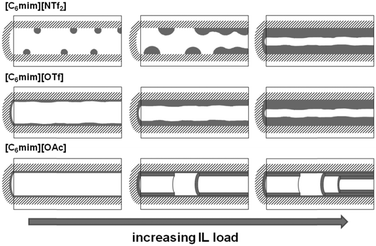
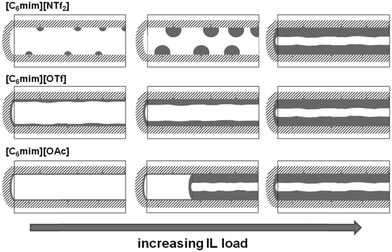
In Fig. 7, left, the difference between the two maxima, i.e. that of the free pore, or that of the material with low ionic liquid loading MCM-NTf2-0.58, and that of higher ionic liquid loadings, is 1.1 nm. This value is decisively lower than what would be expected for the formation of a monolayer (2 × 0.9 nm, see Table 2). This indicates that either the cubic model does not hold for [C6mim][NTf2], and the geometry of the ionic liquid on the surface is expected to be rather cuboid (with larger base dimensions) than cubic. Of course, another explanation could be a monolayer formation at low loadings, which consists of a checkerboard-type arrangement in which anions and cations reside next to each other on the surface, rather than as a cation–anion bilayer. Such an arrangement has been considered for the related N-butyl-N-methylpyrrolidinium tris(pentafluoro-ethyl)trifluorophosphate on a charged sapphire (0001) surface, which would have a thickness of about 0.4 nm. However, this type of arrangement was found to be energetically disfavored at this negatively charged interface.32 Hence, further studies will be necessary to explain the source of the slight shift of the pore diameter distribution at low loadings. In summary, due to the homogeneity of MCM-41 regarding the narrow pore diameter distribution, it is possible to study the behaviour of ionic liquids on silica-type materials. The analysis of the sorption isotherms has shown that ionic liquids behave very differently when impregnated on MCM-41. Besides underlying steric packing effects arising from geometrical aspects of the anions, the differences must be due to the specific properties of the respective ionic liquid anion, and in particular its tendency to either preferentially interact with the silica surface or with other ions. Hence, while [C6mim][OTf] is successively evenly distributed on the surface, [C6mim][OAc] shows some heterogeneities, which could be due to some intermediate states of preferred ion–ion interaction. The hydrophobic [C6mim][NTf2] appears to exhibit very low interaction strength with silica, and hence the formation of drops is preferred, before higher amounts of ionic liquids lead to layer formation. This is corroborated by the 129Xe-NMR studies. Fig. 9 shows schematically the corresponding pore filling mode for the three ionic liquids investigated in MCM-41. More detailed spectroscopic studies will shed light on the specific interactions occurring in the future.
Ionic liquids confined within silica gel (MB)
Silica gel-based materials are the most frequently used SIL-systems reported in catalytic studies, because silica gel is widely available at low costs. Commonly used loadings range between 0.1 and 50 vol%,14,25 and some authors investigated the catalytic activity as a function of ionic liquid loading, which was found to play a major role.3,25 For example, the CO conversion in the water–gas shift reaction was found to be dependent on the amount of ionic liquid confined, with optimum results at about 14 vol% loading,14 while in the gas phase hydroformylation, a decreasing activity with increasing ionic liquid loading was observed.25 Also for SIL-type materials not based on silicate, the amount of ionic liquid on the support was found to influence the reaction: when SIL-type materials in which the ionic liquid [C4mim][C8H17SO4] was confined directly in porous Raney nickel were used in the hydrogenation of cyclooctadiene to cyclooctene, the selectivity increased with increasing amounts of ionic liquid, while the rate of reaction decreased.18The three ionic liquids under investigation were immobilised on non-ordered silica gel (MB). The nitrogen sorption isotherms as well as a table detailing the materials' structural parameters are shown in the ESI† (see Fig. S9–S11 and Table S2). The pore diameter distribution profiles obtained for the three material types resemble each other strikingly (Fig. 10). The broad pore diameter distribution of the pristine material is narrowed and shifted to smaller values with increasing amounts of ionic liquid present. This indicates that smaller pore areas are filled first (in accordance with findings for SIL-type materials based on Raney nickel7 and silica gel 10014), leading to a narrower distribution. As in the case of the MCM-41-based materials, the densities of the ionic liquids in completely filled pores were calculated by linear extrapolation (R2 > 0.96; see Fig. S12, ESI† and Table 2). They are much lower than the bulk densities, but quite similar to those obtained for MCM-41. Similar to the MCM-41-based materials, the density of [C6mim][NTf2] decreases with an increasing amount of ionic liquid added to the support, while those of both the acetate- and trifluoromethanesulfonate-based derivatives increase, before leveling off. However, for a given available surface area, the density of [C6mim][NTf2] confined in MB is higher than when confined in MCM-41, indicating a more bulk-like state, which means that the coverage of the surface is somewhat less preferred on MB than on MCM-41 (see Fig. S13 and Tables S1 and S2, ESI†). This may be due to space restrictions in the smaller pores of the MCM-41 material. Overall, these findings suggest similar pore filling modes to those found for MCM-41 (surface coverage with trifluoromethanesulfonate, aggregate-/drop-formation with bis(trifluoromethanesulfonyl)imide). However, due to the broad pore diameter distribution in disordered MB-type materials, these pore filling effects cannot be observed in the nitrogen sorption isotherms. Fig. 11 gives a schematic representation of the pore filling mode observed for disordered silica gel.
 | ||
| Fig. 10 Pore diameter distributions of MB-based materials impregnated with incrementally increasing amounts of [C6mim][OTf] (left), [C6mim][NTf2] (middle) and [C6mim][OAc] (right). | ||
Ionic liquids confined in SBA-15
The behavior of [C6mim][OTf], [C6mim][OAc] and [C6mim][NTf2] was investigated after immobilisation on SBA-15, a highly ordered material consisting of meso- and micropores. The nitrogen sorption isotherms as well as a table detailing the materials' structural parameters are shown in the ESI† (see Fig. S14–S16 and Table S3). The isotherms, which can be classified according to IUPAC as type IV, featuring a hysteresis loop (type H1), show a steep increase in the hysteresis, as expected for materials with a narrow pore diameter distribution. With increasing ionic liquid loading, the position of the hysteresis shifts to lower relative pressures.Furthermore, the formation of a distinct second maximum appears, corresponding to a pore diameter which is 1.2 nm smaller than the initial one. Considering the theoretical layer thickness of 0.84, this pore diameter corresponds to pores where a monolayer has formed. It appears hence that the acetate-based ionic liquid is deposited on the surface to give a monolayer, and for the second layer, the ions are not deposited randomly, but rather successively growing from one point onwards. Fig. 14 shows the corresponding pore filling mode for the three ionic liquids confined in SBA-15.
Mercury intrusion analysis
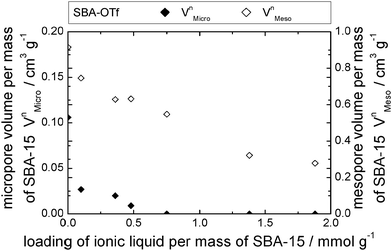
Mercury intrusion measurements were performed on selected examples of [C6mim][OTf] supported on SBA-15 and MB (Fig. 15). Comparison to Fig. 10, left, shows that the data of the MB-based materials are much less resolved than that obtained by nitrogen sorption measurements. Due to the general, lower accuracy of mercury intrusion measurements for small mesopores, quantitative analysis is not possible. Nevertheless, it can be stated that the accessible pore volume decreases with an increasing amount of ionic liquid present and that small mesopores are filled first. The data of the SBA-15-based materials, on the other hand, show a distinct pore diameter distribution, with the maximum of the pristine material at about 5.5 nm. Comparison to Fig. 13, left, shows that the mercury intrusion experiments result in somewhat lower values than nitrogen adsorption experiments. However, as opposed to the nitrogen adsorption experiments, the maximum of the pore diameter distribution is shifted slightly to a higher value of 6.0 nm with increasing ionic liquid loading, while the pore volume decreases. These findings suggest that when the dense mercury is pressed into the material pores, the ionic liquid is pushed together and hence removed from the larger pores, leaving only the ionic liquid deposited in smaller pores on the support (see Fig. S20, ESI† for a model representation). This overall leads to a lower number of pores with smaller pore diameters. It can hence be concluded that high pressure mercury intrusion cannot be used to investigate the resulting mesoporosity in SIL-type materials, making nitrogen sorption the method of choice. Further investigations need to explore the limiting applicable pressure depending on pore size for this method.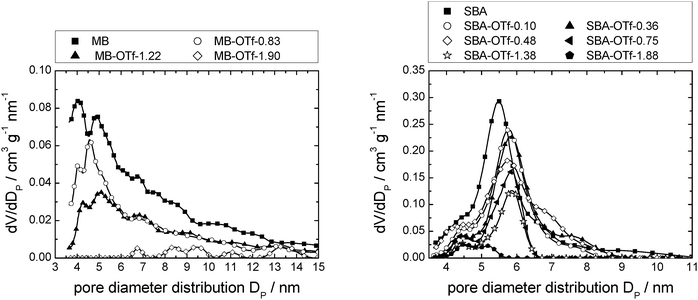 | ||
| Fig. 15 Pore diameter distribution profiles determined from Hg-intrusion of MB (left) and SBA-15 (right) with increasing loads of [C6mim][OTf]. Note that the number of data points displayed is reduced for clarity. Complete data can be found in Fig. S27 (ESI†). | ||
Thermogravimetric analysis of the materials
Several of the materials were analysed by thermogravimetric analysis (see Fig. S21–S24 and Tables S5–S7, ESI†) and compared to the bulk ionic liquids' decomposition profiles. The decomposition point (defined as the point of inversion of the TGA curve) of the bulk ionic liquids decreases in the series [C6mim][NTf2] (739 K) > [C6mim][OTf] (693 K) > [C6mim][OAc] (519 K); i.e. with increasing nucleophilicity of the anion, which catalyses Hoffmann degradation.77The thermal stability of [C6mim][OTf] in confinement essentially remains the same (maximum deviation about 10 K) as for the bulk, and is independent of the type of silica support. The different porous silica supports hence do not appear to affect the decomposition. Furthermore, in none of the confinements does the loading influence the thermal stability of this ionic liquid.
The thermal stability of confined [C6mim][NTf2] is decreased on all silica supports by a maximum of about 45 K when compared to the bulk, indicating that the surface is involved in the decomposition of the ionic liquid. This has also been reported for 1-octyl-3-methylimidazolium hexafluorophosphate ([C8mim][PF6]).76 For similar loadings, the stability differs slightly for the different supports, with a decrease in stability in the order of SBA-15 > MB > MCM-41. Interestingly, as pointed out in the discussion above, [C6mim][NTf2] shows a higher tendency to form aggregates (i.e. less ionic liquid–surface interaction) following the order SBA-15 > MB > MCM-41. Hence, a lower degree of interfacial contact appears to be beneficial for the stability of this ionic liquid. This is further supported by the fact that in loading-dependent studies of [C6mim][NTf2] on SBA-15 and MB, the decomposition temperature is not affected for the former, while it increases for the latter (Table S7, ESI†). The more bulk-like the state of this ionic liquid is, the higher is its thermal stability.
Surprisingly, the thermal stability of [C6mim][OAc] increases when confined in the silica support pores by a maximum of 60 K. Taking into account the known role of this nucleophilic anion in the decomposition of the cation,77 this effect may be explained by a reduction of the acetate's activity, e.g. by strong interactions with the silicate's surface (e.g. by hydrogen bonding78). This explanation is supported by the relative stability of [C6mim][OAc], which increases in the order of SBA-15 < MB < MCM-41 (Table S5, ESI†). This trend follows the reversed order of that observed for [C6mim][NTf2].
Unfortunately, to the best of our knowledge, no evidence exists that demonstrates strong silica–anion interactions. Furthermore, only a few studies investigate the interface properties of acetate-based ionic liquids, and the molecular arrangement on silicates does not appear to deviate tremendously when compared to ionic liquids containing an anion of lower hydrogen-bonding ability.
Hence, AFM studies show that the cation of [C2mim][OAc] is in closest vicinity to the surface, with the ethyl group oriented perpendicularly to the surface.35 In the same way, for ionic liquids containing anions with little hydrogen-bonding ability, Sum-Frequency Vibrational Spectroscopy (SFVS) showed that the imidazolium ring interacts with fused silica via hydrogen bonding of the acidic C2-H. The methyl group on the imidazolium cation is directed toward the silica surface, while the alkyl chain of the 1-alkyl-3-methylimidazolium cation protrudes almost perpendicularly relative to the surface.
While this angle was found to be dependent on the size of the anion, the HCCH tilt angle is independent of the anion size, but affected by the alkyl chain length. The cation head group orients more parallel to the surface when its alkyl substituent is shorter.79,80 These findings are supported by molecular dynamics simulations.81 Overall, it can be stated that these studies place a strong focus on the elucidation of the structural orientation of the cation, and little is known about the arrangement of the anion.
Hence, whether or not the increased stability of the acetate-based ionic liquid is due to surface-acetate interactions, which might well be more prevalent in materials of smaller pore diameter (and hence larger available surface area at constant ionic liquid loading), remains speculative, and must be the topic of further studies.
Conclusions
The present study has shown that surface-coverage of porous silicates with ionic liquid is highly dependent on both the type of ionic liquid and the support material. A strong anion-dependent effect was observed. Hence, acetate- and trifluoromethanesulfonate-based ionic liquids exhibit preferential interactions with the surface leading to the formation of homogeneous layers. While for the trifluoromethanesulfonate-based ionic liquid, ion deposition on the surface appears to be rather random, the acetate-based ionic liquid shows a peculiar behaviour pointing to a side-by-side deposition of the ions, hence completing the monolayer. However, non-coordinating anions such as bis(trifluoromethanesulfonyl)imide may lead to aggregate formation rather than homogeneous distribution of ionic liquid on the surface.It can be therefore stated that the model presented in the literature (Fig. 1) represents an oversimplified picture, which is only correct for certain combinations of ionic liquid and support materials. On ordered mesoporous silica supports such as MCM-41 or SBA-15, homogeneous layers of ionic liquid are formed, if the ionic liquid is not too hydrophobic and hence tends to rather form aggregates than wet the surface. For disordered supports, such as silica gel (MB), the regions of smaller pores are filled first, before the surface is completely covered. While it cannot be stated whether initially layer- or aggregate-formation occurs on the disordered MB support, it is clear that at low to medium loadings of ionic liquid, the free silica surface may still be present, and the layer thickness of the ionic liquid is not uniform.
The support itself not only exhibits an effect on the material physicochemical properties (density, viscosity, melting point, diffusivity, compressibility, etc.)43,61,62,82,83 but thermo-gravimetric analysis of materials obtained depending on the type of silica support, and ionic liquid loading has shown that the thermal stability is also strongly affected. Hence, SIL-type materials are highly tuneable regarding their specific properties, a benefit in process optimisation. Nevertheless, it can be stated that the predictability of properties of the ionic liquids in confinement from bulk properties is not necessarily possible. In addition, this study has demonstrated that as opposed to mercury intrusion, nitrogen sorption isotherm measurement is the method of choice to investigate the textural properties of SIL-type materials.
Acknowledgements
The authors thank the Deutsche Forschungsgemeinschaft (DFG) for funding within the Leipzig Graduate School of Natural Sciences “Building with Molecules and Nano-objects (BuildMoNa)” and within the DFG priority programs SPP 1191 and 1708; STA1027/2-3 and /6-1.Notes and references
- C. P. Mehnert, R. A. Cook, N. C. Dispenziere and M. Afeworki, J. Am. Chem. Soc., 2002, 124, 12932–12933 CrossRef CAS PubMed.
- C. P. Mehnert, E. J. Mozeleski and R. A. Cook, Chem. Commun., 2002, 3010–3011 RSC.
- A. Riisager, K. M. Eriksen, P. Wasserscheid and R. Fehrmann, Catal. Lett., 2003, 90, 149–153 CrossRef CAS.
- A. Riisager, P. Wasserscheid, R. van Hal and R. Fehrmann, J. Catal., 2003, 219, 452–455 CrossRef CAS.
- A. Riisager, R. Fehrmann, M. Haumann, B. S. K. Gorle and P. Wasserscheid, Ind. Eng. Chem. Res., 2005, 44, 9853–9859 CrossRef CAS.
- A. Riisager, R. Fehrmann, S. Flicker, R. van Hal, M. Haumann and P. Wasserscheid, Angew. Chem., Int. Ed., 2005, 44, 815–819 CrossRef CAS PubMed.
- U. Kernchen, B. Etzold, W. Korth and A. Jess, Chem. Eng. Technol., 2007, 30, 985–994 CrossRef CAS.
- P. Virtanen, T. Salmi and J.-P. Mikkola, Ind. Eng. Chem. Res., 2009, 48, 10335–10342 CrossRef CAS.
- Y. Yang, C. Deng and Y. Yuan, J. Catal., 2005, 232, 108–116 CrossRef CAS PubMed.
- A. Wolfson, I. F. J. Vankelecom and P. A. Jacobs, Tetrahedron Lett., 2003, 44, 1195–1198 CrossRef CAS.
- J. Huang, T. Jiang, H. Gao, B. Han, Z. Liu, W. Wu, Y. Chang and G. Zhao, Angew. Chem., Int. Ed., 2004, 43, 1397–1399 CrossRef CAS PubMed.
- M. Steffan, M. Lucas, A. Brandner, M. Wollny, N. Oldenburg and P. Claus, Chem. Eng. Technol., 2007, 30, 481–486 CrossRef CAS.
- P. Virtanen, T. Salmi and J.-P. Mikkola, Top. Catal., 2010, 53, 1096–1103 CrossRef CAS.
- M. Haumann, A. Schönweiz, H. Breitzke, G. Buntkowsky, S. Werner and N. Szesni, Chem. Eng. Technol., 2012, 35, 1421–1426 CrossRef CAS.
- S. Breitenlechner, M. Fleck, T. E. Müller and A. Suppan, J. Mol. Catal. A: Chem., 2004, 214, 175–179 CrossRef CAS PubMed.
- H. Hagiwara, Y. Sugawara, K. Isobe, T. Hoshi and T. Suzuki, Org. Lett., 2004, 6, 2325–2328 CrossRef CAS PubMed.
- K. Yamaguchi, C. Yoshida, S. Uchida and N. Mizuno, J. Am. Chem. Soc., 2004, 127, 530–531 CrossRef PubMed.
- A. Jess, C. Kern and W. Korth, Oil Gas Eur. Mag., 2012, 38–45 Search PubMed.
- F. F. Krull, M. Hechinger, W. Kloeckner, M. Verhuelsdonk, F. Buchbender, H. Giese and T. Melin, Colloids Surf., A, 2009, 345, 182–190 CrossRef CAS PubMed.
- S. H. Barghi, M. Adibi and D. Rashtchian, J. Membr. Sci., 2010, 362, 346–352 CrossRef CAS PubMed.
- D. D. Iarikov, P. Hacarlioglu and S. T. Oyama, Chem. Eng. J., 2011, 166, 401–406 CrossRef CAS PubMed.
- O. C. Vangeli, G. E. Romanos, K. G. Beltsios, D. Fokas, C. P. Athanasekou and N. K. Kanellopoulos, J. Membr. Sci., 2010, 365, 366–377 CrossRef CAS PubMed.
- F. Kohler, D. Roth, E. Kuhlmann, P. Wasserscheid and M. Haumann, Green Chem., 2010, 12, 979–984 RSC.
- C. P. Mehnert, Chem. – Eur. J., 2005, 11, 50–56 CrossRef PubMed.
- A. Riisager, R. Fehrmann, M. Haumann and P. Wasserscheid, Eur. J. Inorg. Chem., 2006, 695–706 CrossRef CAS.
- C. Van Doorslaer, J. Wahlen, P. Mertens, K. Binnemans and D. De Vos, Dalton Trans., 2010, 39, 8377–8390 RSC.
- A. Monge-Marcet, R. Pleixats, X. Cattoen and M. Wong Chi Man, Catal. Sci. Technol., 2011, 1, 1544–1563 CAS.
- T. Selvam, A. Machoke and W. Schwieger, Appl. Catal., A, 2012, 445, 92–101 CrossRef PubMed.
- A. Stark, M. Wild, M. Ramzan, M. M. Azim and A. Schmidt, in Product design and engineering, ed. U. Bröckel, G. Wagner and W. Meier, Wiley-VCH, Weinheim, 2013, vol. III, pp. 169–220 Search PubMed.
- M. Waechtler, M. Sellin, A. Stark, D. Akcakayiran, G. Findenegg, A. Gruenberg, H. Breitzke and G. Buntkowsky, Phys. Chem. Chem. Phys., 2010, 12, 11371–11379 RSC.
- Y. Yokota, T. Harada and K.-i. Fukui, Chem. Commun., 2010, 46, 8627–8629 RSC.
- M. Mezger, H. Schröder, H. Reichert, S. Schramm, J. S. Okasinski, S. Schöder, V. Honkimäki, M. Deutsch, B. M. Ocko, J. Ralston, M. Rohwerder, M. Stratmann and H. Dosch, Science, 2008, 322, 424–428 CrossRef CAS PubMed.
- Y. Liu, Y. Zhang, G. Wu and J. Hu, J. Am. Chem. Soc., 2006, 128, 7456–7457 CrossRef CAS PubMed.
- S. Bovio, A. Podestà, C. Lenardi and P. Milani, J. Phys. Chem. B, 2009, 113, 6600–6603 CrossRef CAS PubMed.
- R. Atkin and G. G. Warr, J. Phys. Chem. C, 2007, 111, 5162–5168 CAS.
- S. Rivera-Rubero and S. Baldelli, J. Phys. Chem. B, 2006, 110, 4756–4765 CrossRef CAS PubMed.
- R. M. Lynden-Bell, M. G. Del Pópolo, T. G. A. Youngs, J. Kohanoff, C. G. Hanke, J. B. Harper and C. C. Pinilla, Acc. Chem. Res., 2007, 40, 1138–1145 CrossRef CAS PubMed.
- N. Sieffert and G. Wipff, J. Phys. Chem. C, 2008, 112, 19590–19603 CAS.
- F. Endres, O. Hofft, N. Borisenko, L. H. Gasparotto, A. Prowald, R. Al-Salman, T. Carstens, R. Atkin, A. Bund and S. Zein El Abedin, Phys. Chem. Chem. Phys., 2010, 12, 1724–1732 RSC.
- T. Cremer, M. Killian, J. M. Gottfried, N. Paape, P. Wasserscheid, F. Maier and H.-P. Steinrück, ChemPhysChem, 2008, 9, 2185–2190 CrossRef CAS PubMed.
- T. Cremer, L. Wibmer, S. K. Calderon, A. Deyko, F. Maier and H. P. Steinruck, Phys. Chem. Chem. Phys., 2012, 14, 5153–5163 RSC.
- A. Deyko, T. Cremer, F. Rietzler, S. Perkin, L. Crowhurst, T. Welton, H.-P. Steinrück and F. Maier, J. Phys. Chem. C, 2013, 117, 5101–5111 CAS.
- B. Coasne, L. Viau and A. Vioux, J. Phys. Chem. Lett., 2011, 2, 1150–1154 CrossRef CAS.
- X. Gong, S. Frankert, Y. Wang and L. Li, Chem. Commun., 2013, 49, 7803–7805 RSC.
- T. Cremer, M. Stark, A. Deyko, H. P. Steinrück and F. Maier, Langmuir, 2011, 27, 3662–3671 CrossRef CAS PubMed.
- R. Lungwitz and S. Spange, New J. Chem., 2008, 32, 392–394 RSC.
- R. Lungwitz, M. Friedrich, W. Linert and S. Spange, New J. Chem., 2008, 32, 1493–1499 RSC.
- W. D. Einicke, H. Uhlig, D. Enke, R. Gläser, C. Reichenbach and S. G. Ebbinghaus, Colloids Surf., A, 2013, 437, 108–112 CrossRef CAS PubMed.
- H. Uhlig, M.-L. Gimpel, A. Inayat, R. Gläser, W. Schwieger, W.-D. Einicke and D. Enke, Microporous Mesoporous Mater., 2013, 182, 136–146 CrossRef CAS PubMed.
- W.-D. Einicke, D. Enke, M. Dvoyashkin, R. Valiullin and R. Gläser, Materials, 2013, 6, 3688–3709 CrossRef CAS PubMed.
- D. Zhao, J. Feng, Q. Huo, N. Melosh, G. H. Fredrickson, B. F. Chmelka and G. D. Stucky, Science, 1998, 279, 548–552 CrossRef CAS.
- D. Zhao, Q. Huo, J. Feng, B. F. Chmelka and G. D. Stucky, J. Am. Chem. Soc., 1998, 120, 6024–6036 CrossRef CAS.
- J. G. Huddleston, A. E. Visser, W. M. Reichert, H. D. Willauer, G. A. Broker and R. D. Rogers, Green Chem., 2001, 3, 156–164 RSC.
- S. Brunauer, P. H. Emmett and E. Teller, J. Am. Chem. Soc., 1938, 60, 309–319 CrossRef CAS.
- B. C. Lippens and J. H. de Boer, J. Catal., 1965, 4, 319–323 CrossRef CAS.
- K. S. W. Sing, D. H. Everett, R. A. W. Haul, L. Moscou, R. A. Pierotti, J. Rouquerol and T. Siemieniewska, Pure Appl. Chem., 1985, 57, 603–619 CrossRef CAS.
- V. Meynen, P. Cool and E. F. Vansant, Microporous Mesoporous Mater., 2009, 125, 170–223 CrossRef CAS PubMed.
- K. Cassiers, T. Linssen, M. Mathieu, M. Benjelloun, K. Schrijnemakers, P. Van Der Voort, P. Cool and E. F. Vansant, Chem. Mater., 2002, 14, 2317–2324 CrossRef CAS.
- A. Galarneau, H. Cambon, F. Di Renzo, R. Ryoo, M. Choi and F. Fajula, New J. Chem., 2003, 27, 73–79 RSC.
- Quantachrome, DFT MODELS LIBRARY OF DFT AND GCMC METHODS IN QUANTACHROME'S DATA REDUCTION SOFTWARE, http://www.quantachrome.com/technical/dft.html, Accessed 1.08.2014, 2014.
- E. Sloutskin, B. M. Ocko, L. Tamam, I. Kuzmenko, T. Gog and M. Deutsch, J. Am. Chem. Soc., 2005, 127, 7796–7804 CrossRef PubMed.
- J. Bowers, M. C. Vergara-Gutierrez and J. R. P. Webster, Langmuir, 2003, 20, 309–312 CrossRef.
- R. Hayes, S. Z. El Abedin and R. Atkin, J. Phys. Chem. B, 2009, 113, 7049–7052 CrossRef CAS PubMed.
- A. J. Carmichael, C. Hardacre, J. D. Holbrey, M. Nieuwenhuyzen and K. R. Seddon, Mol. Phys., 2001, 99, 795–800 CrossRef CAS.
- C. Ye and J. n. M. Shreeve, J. Phys. Chem. A, 2007, 111, 1456–1461 CrossRef CAS PubMed.
- R. G. Horn, D. F. Evans and B. W. Ninham, J. Phys. Chem., 1988, 92, 3531–3537 CrossRef CAS.
- J. Jacquemin, P. Nancarrow, D. W. Rooney, M. F. Costa Gomes, P. Husson, V. Majer, A. A. H. Pádua and C. Hardacre, J. Chem. Eng. Data, 2008, 53, 2133–2143 CrossRef CAS.
- N. V. Ignat'ev, P. Barthen, A. Kucheryna, H. Willner and P. Sartori, Molecules, 2012, 17, 5319–5338 CrossRef PubMed.
- X.-X. Ma, J. Wei, Q.-B. Zhang, F. Tian, Y.-Y. Feng and W. Guan, Ind. Eng. Chem. Res., 2013, 52, 9490–9496 CrossRef CAS.
- R. D. Chirico, V. Diky, J. W. Magee, M. Frenkel and N. Marsh, Pure Appl. Chem., 2009, 81, 791–828 CrossRef CAS.
- J. Jacquemin, R. Ge, P. Nancarrow, D. W. Rooney, M. F. Costa Gomes, A. A. H. Pádua and C. Hardacre, J. Chem. Eng. Data, 2008, 53, 716–726 CrossRef CAS.
- J. Fraissard and T. Ito, Zeolites, 1988, 8, 350–361 CrossRef CAS.
- B. M. Goodson, J. Magn. Reson., 2002, 155, 157–216 CrossRef CAS PubMed.
- R. Hayes, G. G. Warr and R. Atkin, Phys. Chem. Chem. Phys., 2010, 12, 1709–1723 RSC.
- R. G. Horn and J. N. Israelachvili, J. Chem. Phys., 1981, 75, 1400–1411 CrossRef CAS PubMed.
- J. Lemus, J. Palomar, M. Gilarranz and J. Rodriguez, Adsorption, 2011, 17, 561–571 CrossRef CAS.
- J. E. Gordon, J. Org. Chem., 1965, 30, 2760–2763 CrossRef CAS.
- A. Stark, M. Sellin, B. Ondruschka and K. Massonne, Sci. China: Chem., 2012, 55, 1663–1670 CrossRef CAS.
- B. D. Fitchett and J. C. Conboy, J. Phys. Chem. B, 2004, 108, 20255–20262 CrossRef CAS.
- J. B. Rollins, B. D. Fitchett and J. C. Conboy, J. Phys. Chem. B, 2007, 111, 4990–4999 CrossRef CAS PubMed.
- C. Pinilla, M. G. Del Pópolo, R. M. Lynden-Bell and J. Kohanoff, J. Phys. Chem. B, 2005, 109, 17922–17927 CrossRef CAS PubMed.
- K. Ueno, M. Kasuya, M. Watanabe, M. Mizukami and K. Kurihara, Phys. Chem. Chem. Phys., 2010, 12, 4066–4071 RSC.
- M. Kanakubo, Y. Hiejima, K. Minami, T. Aizawa and H. Nanjo, Chem. Commun., 2006, 1828–1830 RSC.
Footnote |
| † Electronic supplementary information (ESI) available: N2 sorption isotherms and pore diameter distributions of the pristine supports MB, MCM-41 and SBA-15, comparison of the QSDFT and NLDFT models for all the materials investigated; N2 sorption isotherms of all ionic liquids investigated on MB, SBA-15 and MCM-41-materials; pore diameter distribution and mean pore distribution maximum of all materials based on the MCM-41-type; linear regressions of pore volume vs. loading; density vs. loading and density vs. surface area for MCM-41-, MB- and SBA-15-type materials; tables containing details of the textural properties of all materials; a scheme demonstrating failure of the mercury intrusion technique to determine textural properties of SIL-type materials; thermogravimetric data for bulk ionic liquids and ionic liquids confined in the silicate materials. See DOI: 10.1039/c4cp02749c |
| This journal is © the Owner Societies 2014 |

