 Open Access Article
Creative Commons Attribution 3.0 Unported Licence
Three-dimensional superdiffusive chemical waves in a precipitation system†
M. M.
Ayass
a,
I.
Lagzi
b and
M.
Al-Ghoul
*a
aDepartment of Chemistry, American University of Beirut, P.O. Box 11-0236, Riad El-Solh 1107 2020, Beirut, Lebanon. E-mail: mazen.ghoul@aub.edu.lb
bDepartment of Physics, Budapest University of Technology and Economics, Budapest H-1521, Hungary
First published on 29th August 2014
Abstract
We report novel results on self-organized three-dimensional spiral and target patterns exhibiting anomalous superdiffusive behaviour in a reaction-diffusion system with simultaneous precipitation and polymorphic transformation of mercuric iodide without external forcing. The superdiffusive dynamics of propagation of the targets/spirals and their breakup are presented.
Front and wave propagation phenomena are widely encountered in physical,1 chemical2,3 and biological systems.4–6 The origin of fronts and waves can be quite different depending on their nature (e.g., electromagnetic, elastic, excitable waves or diffusion fronts). However, a common characteristic is that they propagate with finite velocity i.e. the wave front position is linearly proportional to time (r ∼ t) or in other cases (e.g., diffusion) fronts evolve with decreasing velocity in time in a manner that the front position is always linearly proportional to the square root of time (r ∼ t0.5). Front and wave propagation where mass transfer occurs in space can be usually characterized by two previously described ways such as advective motion (finite velocity case) and Brownian or eddy motion (diffusive case). The majority of waves fall into these two categories.
In a typical diffusion process the mean squared displacement (MSD) of particles is a linear function of time (MSD ∼ t2α), where exponent α is equal to 0.5, i.e. 2α = 1. However, in some systems other types of anomalous transport phenomena can occur. Anomalous diffusion7 is a process with a nonlinear relationship with time. If this exponent α is greater than 0.5, the phenomenon is called superdiffusion. Superdiffusion can be observed when tracer trajectories are no longer continuous because of the occurrence of extremely long jumps (Lévy flights), which results in mixing between distant regions of the medium.8–10 If α is lower than 0.5, the system undergoes subdiffusion. Subdiffusion is encountered in highly heterogeneous media where surfaces tend to be disordered or porous thus trapping particles, like in gels8 or metal–organic frameworks (MOFs).11
In chemical systems, the dynamics of fronts and waves are governed by the interplay between mixing in the system (transport phenomena) and the interaction (e.g., chemical reactions) between the different species. Usually the mixing is merely due to molecular diffusion as a result of underlying Brownian motion. Classical reaction-diffusion equations (RDE) are adequately used to describe the evolution of the fronts4 in homogeneous as well as in heterogeneous media. In particular, RDE are able to explain chemical wave propagation in the Belousov–Zhabotinsky (BZ) and similar reactions. Interestingly in the BZ system, classical diffusion of the species and nonlinear chemical reactions between them can produce propagating fronts with finite velocities,10,12,13 as well as precipitation fronts in Liesegang systems,14 which exhibit the normal diffusive profile. Despite the constant existence of Brownian motion as the underlying microscopic mechanism for transport, exceptions exist in numerous complex systems. Many examples are encountered in turbulent fluids,15 chaotic dynamics16 and disordered media.17 In these systems, anomalous sub- and superdiffusion mechanisms are the driving forces governing the physics of transport.
In chemistry, recent experiments have confirmed the occurrence of superdiffusive chemical waves only when the system is subjected to modulations that enhanced diffusion. Such modulations include chaotic flow created by Faraday waves,9,10 azimuthal motion of counter-rotating vortices16 and simple stirring-induced hydrodynamic turbulence.18
Herein we report a simple reaction-diffusion system, in which the mass transport of reacting chemical species occur solely by diffusion that embraces a pattern formation of propagating three-dimensional spiral and circular chemical waves (targets), perpendicular to the diffusion flux, with anomalous (superdiffusive) dynamics without the intervention of any external enhancement or modulation.
Our heterogeneous system is based on the precipitation reaction between mercuric chloride (HgCl2) and potassium iodide (KI) to form a mercuric iodide (HgI2) precipitate, with redissolution in excess iodide, accompanied by a polymorphic transformation between the different crystal forms of the solid. The observations integrate the coexistence of moving precipitation patterns perpendicular to the diffusion flux of the invading electrolytes, such as those appearing in the Liesegang phenomenon,19 and traveling waves, typical to excitable and oscillatory homogeneous media.20–22
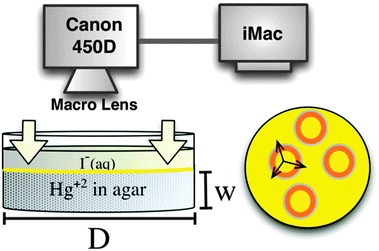
We carry out all the experiments in agar gel media. To this end, the agar powder (1% volume) is dissolved in HgCl2 solution (inner electrolyte). We then heat the mixture at a temperature ranging within 80–90 °C (below boiling) and stir thoroughly to ensure complete dissolution of the gel powder. Afterwards, we pour the hot mixtures into small petri dishes to form a gel layer of about 7 mm in thickness (Fig. 1). We then cover the plates and place them in a constant temperature chamber (20.0 ± 0.2 °C) where the gels are left for 2 hours for their gelation and aging processes to complete.
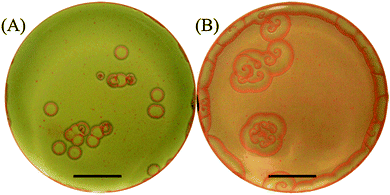
We then initiate the precipitation reaction by pouring the KI solution (outer electrolyte), onto the surface of the solidified gel (initialization step). This forms a thin orange/yellow layer of precipitate of thickness ∼70–150 μm at the interface, and this layer moves downwards in the gel due to the interplay of the precipitation reaction and the redissolution due to complex formation in excess iodide ions (Fig. 1). Seconds after initialization we observe self-organized spatiotemporal patterns forming in the gel in a plane parallel to the gel surface. We monitor the fronts, from a top view position using a high-resolution digital camera (Cannon EOS 450D) connected to an iMac with built-in remote shooting software, where the camera options can be altered according to required specifications (Fig. 1). We capture the wave dynamics under ambient lighting. The reactions proceed for around 15–20 minutes with snapshots being taken every 5 seconds. This produces a sufficient set of frames that are combined to show the evolution of the chemical fronts in space and time. Fig. 2 represents snapshots of the circular target patterns and spirals (depending on [I−]0) observed in our system.
The effect of the inner and outer concentrations is intricate on the appearance and selection of the patterns. The inner concentration judges whether the pattern will nucleate or not and we find that the range is limited to [Hg2+]0 between 0.16 and 0.26 M. On the other hand, the outer concentration decides the probability of appearance of each type of pattern. It is noted that at low outer concentrations, the target patterns are the dominant patterns and when we gradually increase the concentration, the spiral patterns become more dominant. This effect is depicted in Fig. 2A and B whereby at [I−]0 = 1.0 M targets are the major patterns observed, whereas at [I−]0 = 5.0 M spirals dominate and targets are rarely identified.
The patterns we observe have distinct features. Upon close inspection of the obtained snapshots, we confirm that their nucleation occurs at perturbed regions in the gel surface caused by tiny gas bubbles trapped inside the solidified gel. The spiral rotation shows no meandering of the tip; in fact it is pinned to the initial nucleation site. On the other hand, the target patterns observed, acting like pacemakers, emerge from similar nucleation sites but with the absence of continuous stimulation thus producing a single propagating circular wave. Furthermore, we take several measurements of many target patterns appearing in the same petri dish and we confirm that the majority of them have the same size and thus all nucleate at approximately the same time.
Both chemical waves of spirals and targets have similar characteristics. Their motion is a combination of the interplay of the polymorphic transformation of HgI2 polymorphs (α and β) and the formation of the colorless complex K2HgI4. The unperturbed region (background) of the precipitate, appearing on the outskirts of the target, constitutes β-yellow-HgI2 (orthorhombic) while the chemical wave itself, propagating through this region, is primarily made of α-red-HgI2 (tetragonal).23,24 After the red wave front passes through a particular region another polymorphic transformation occurs causing the inner part of the target to return to the yellow form (β-HgI2). We also notice an important colorless region between α-HgI2 and β-HgI2, which is attributed to the complex [HgI4]2− formed upon redissolution of the precipitate with excess iodide.25 This region, although small, has proven to be important for the actual formation of the self-organizing patterns. Without it the patterns may not form as corroborated by Volford et al.21 in their study on the aluminum hydroxide system. They also show self-organized patterns outlined with a redissolution zone made up of the complex [Al(OH)4]−. The three aforementioned regions are clearly defined in Fig. 3. β-HgI2 is the unperturbed region of the precipitate and α-HgI2 is the propagating wave front outlined with a colorless region due to the complex [HgI4]2−.
Depending on initial concentrations of reactants, it is noticeable that the background in Fig. 2A changed to yellow (metastable) at a faster rate than in Fig. 2B while the evolution in Fig. 3 represents how the orange form (unstable) fades, with time, and transforms to the more stable yellow form. Furthermore, the width of the traveling red wave front and the width of the redissolution region in Fig. 3 are constant throughout the whole course of the wave propagation. However, we find that the width of the wave front is actually dependent on the initial concentration of Hg2+, [Hg2+]0, at fixed [I−]0 in that it slightly decreases as its value increases.
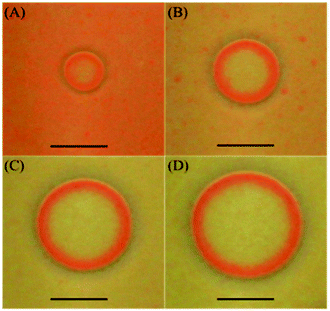 | ||
| Fig. 3 Snapshots showing the time evolution of the target patterns formed in the HgI2 precipitate in gel medium (top view). Initial conditions: 1% agar gel, inner [Hg2+]0 = 0.22 M, outer [I−]0 = 1.0 M. Time after initialization (A) 100 s; (B) 200 s; (C) 350 s (D) 450 s. The scale bar represents 0.5 cm. The width of the traveling red wave front is about twice that of the redissolution region (∼0.7 mm) (see ESI†). | ||
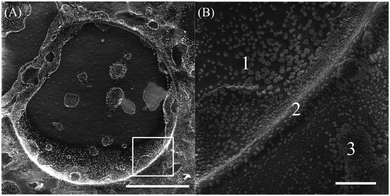
We also study the targets under a high-resolution scanning electron microscope (MIRA3). When the reaction is carried out, we allow the target pattern to propagate for about 1 minute after initialization. We then stop the reaction by pouring out the outer electrolyte and quench the front propagation by placing the petri dish in a freeze-drying machine for about 2 hours. This produces a firm precipitate layer that is easy to handle and place on the SEM stub for imaging, while preserving its structure. Fig. 4A and B show the images of the target pattern. They reveal that the edge of the target pattern, which is the chemical wave being studied, is actually three-dimensional. We unveil that the inner part (Fig. 4B (1)) of the circular pattern is relatively deeper than the outer part (Fig. 4B (3)), with the chemical wave in the middle (Fig. 4B (2)) standing higher than both surfaces. Therefore, we measure the height of the wave from region (1) to region (2) and find values varying between 70 and 100 μm, which comprises most of the thickness of the precipitation layer. And the height measured from region (3) to region (2) ranges between 20 and 40 μm.
The dynamics of the breakup of the targets and spirals, depicted in Fig. 5, is also investigated. Although the breakup mechanisms in the two cases are different, ultimately the system falls into a state of chemical turbulence in both cases. In the case of targets (Fig. 5A–C), the breakup is initiated as instabilities at different locations at the boundary of the wave itself and radiates inwards towards the nucleation center of the pattern, leaving behind a state of chemical turbulence (see ESI†). Furthermore, the higher the concentrations of [Hg2+]0 or [I−]0 were, the earlier the onset of the instability takes place and the smaller the radius is before the target collapses. As for the breakup of the spirals (Fig. 5D–F), we find that it can specifically be attributed to the Doppler effect instability leading to chemical turbulence.26–28 The breakup is initiated at the nucleation center and radiates towards the boundaries of the spiral. This is caused by Hopf instability acting on the spiral core and leading to the meandering of the spiral tip. This meandering of the tip eventually leads to a complete breakup of the spiral leaving behind a state of chemical turbulence.
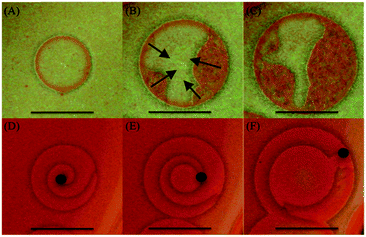 | ||
| Fig. 5 Snapshots of the time evolution of the breakup of patterns. (A–C) Target breakup, initial conditions: 1% agar gel, inner [Hg2+]0 = 0.25 M, outer [I−]0 = 4.0 M. Time after initialization: 200 s, 415 s, 530 s respectively. The black arrows in (B) indicate the boundary locations where the breakup starts and its direction. (D–F) Spiral breakup, initial conditions: 1% agar gel, inner [Hg2+]0 = 0.23 M, outer [I−]0 = 3.0 M. Time after initialization: 130 s, 185 s, 270 s respectively. The black dots indicate the locations of the meandering tip of the spiral. Scale bar represents 0.5 cm (see ESI† for a descriptive video of target and spiral evolution with time and eventual breakup of their structure). | ||
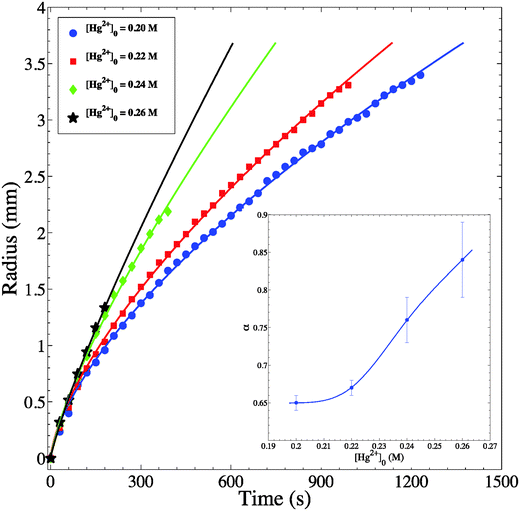
Through the spatiotemporal study of the chemical wave evolution (Fig. 3 clarifies the time evolution of our target pattern), we produce the plots shown in Fig. 6 that relate the radius of the circular wave (R) with time (t). The four plots indicate different inner concentrations at a constant outer concentration of 1.0 M. We measure the radius of a given wave in the period in which it is stable; therefore the plots discontinue at the time the wave breaks up into its chaotic pattern. It is clear that for the highest inner concentration we obtain the fastest wave propagation. Moreover, in all cases studied, the radius exhibits as a function of time a power law of the form R ∼ tα. The α values calculated are well above the diffusive value of 0.5. This represents clear evidence of superdiffusive behavior of the chemical wave. Furthermore, in every given experiment, we pick at random up to 5 waves and we obtain the same value of the exponent α. Similar measurements are also performed on spirals and targets with different initial outer/inner concentrations and in all these measurements superdiffusive behavior is also achieved.
As the concentration increases from 0.20–0.26 M, α significantly increases as well, and ranges from 0.65–0.84 as shown in Fig. 6 (inset). It clearly appears that the inner concentration has a major influence; thus going further away from diffusive behavior gaining more propagative character as in chemical waves with constant velocity. It is noteworthy that the eikonal equation29 relating the speed of the wave to its curvature does not hold in our case. This observation may be attributed to the dominance of reaction kinetics over diffusion in governing transport of chemical species in our heterogeneous system.
Conclusions
We discovered a new three-dimensional precipitation system exhibiting interesting formation of target and spiral patterns in the surface of a hydrogel layer. The precipitation/diffusion process embraces a multipart polymorphic transformation along with complex formation upon precipitate redissolution. These patterns also undergo a breakup mechanism leading to defect mediated chemical turbulence. We found that the wave propagation in the xy-plane evolves according to superdiffusive dynamics.Acknowledgements
We acknowledge the support of the Lebanese Council for National Scientific Research (LCNSR), the University Research Board, American University of Beirut and the Hungarian Research Fund (OTKA K104666).Notes and references
- M. C. Cross and P. C. Hohenberg, Rev. Mod. Phys., 1993, 65, 851 CrossRef CAS.
- B. Grzybowski, Chemistry in Motion: Reaction-Diffusion Systems for Micro- and Nanotechnology, Wiley Online Library, 2009 Search PubMed.
- R. Kapral and K. Showalter, Chemical Waves and Patterns, Kluwer Academic Pub, 1995 Search PubMed.
- J. D. Murray, Mathematical Biology: I. An Introduction (Interdisciplinary Applied Mathematics) (Pt. 1), New York, Springer, 2007 Search PubMed.
- A. Panfilov, R. Keldermann and M. Nash, Proc. Natl. Acad. Sci. U. S. A., 2007, 104, 7922–7926 CrossRef CAS PubMed.
- J. Tang, M. Yi, P. Chen, J. Luo, J. Ma and H. Xia, Europhys. Lett., 2012, 97, 28003 CrossRef.
- R. Klages, G. Radons and I. M. Sokolov, Anomalous Transport, Wiley, 2008 Search PubMed.
- A. A. Dubkov, B. Spagnolo and V. V. Uchaikin, Int. J. Bifurcation Chaos Appl. Sci. Eng., 2008, 18, 2649–2672 CrossRef.
- A. von Kameke, F. Huhn, G. Fernández-García, A. Muñuzuri and V. Pérez-Muñuzuri, Phys. Rev. E: Stat., Nonlinear, Soft Matter Phys., 2010, 81, 066211 CrossRef CAS.
- G. Fernández-García and V. Pérez-Muñuzuri, Eur. Phys. J.: Spec. Top., 2008, 165, 169–174 CrossRef.
- S. Han, T. M. Hermans, P. E. Fuller, Y. Wei and B. A. Grzybowski, Angew. Chem., 2012, 124, 2716–2720 CrossRef PubMed.
- V. K. Vanag and I. R. Epstein, Science, 2001, 294, 835–837 CrossRef CAS PubMed.
- P. M. Wood and J. Ross, J. Chem. Phys., 1985, 82, 1924 CrossRef CAS PubMed.
- M. Al-Ghoul, M. Ammar and R. O. Al-Kaysi, J. Phys. Chem. A, 2012, 116, 4427–4437 CrossRef CAS PubMed.
- G. Boffetta, F. De Lillo and S. Musacchio, Phys. Rev. E: Stat., Nonlinear, Soft Matter Phys., 2012, 85, 066322 CrossRef CAS.
- M. Paoletti, C. Nugent and T. Solomon, Phys. Rev. Lett., 2006, 96, 124101 CrossRef CAS.
- J.-P. Bouchaud and A. Georges, Phys. Rep., 1990, 195, 127–293 CrossRef.
- Z. Noszticzius, Z. Bodnar, L. Garamszegi and M. Wittmann, J. Phys. Chem., 1991, 95, 6575–6580 CrossRef CAS.
- I. Lagzi, Research Signpost, India, 2010 Search PubMed.
- M. M. Ayass and M. Al-Ghoul, J. Phys. Chem. A, 2014, 118, 3857–3865 CrossRef CAS PubMed.
- A. Volford, F. Izsák, M. Ripszám and I. Lagzi, Langmuir, 2007, 23, 961–964 CrossRef CAS PubMed.
- A. Zaikin and A. Zhabotinsky, Nature, 1970, 225, 535–537 CrossRef CAS PubMed.
- M. Hostettler, H. Birkedal and D. Schwarzenbach, Acta Crystallogr., Sect. B: Struct. Sci., 2002, 58, 903–913 Search PubMed.
- M. Hostettler, H. Birkedal and D. Schwarzenbach, Helv. Chim. Acta, 2003, 86, 1410–1422 CrossRef CAS PubMed.
- I. Das, A. Pushkarna and N. R. Agrawal, J. Phys. Chem., 1989, 93, 7269–7275 CrossRef CAS.
- Q. Ouyang, H. L. Swinney and G. Li, Phys. Rev. Lett., 2000, 84, 1047–1050 CrossRef CAS.
- L. Q. Zhou and Q. Ouyang, Phys. Rev. Lett., 2000, 85, 1650–1653 CrossRef CAS.
- L. Q. Zhou and Q. Ouyang, J. Phys. Chem. A, 2001, 105, 112–118 CrossRef CAS.
- J.-M. Flesselles, A. Belmonte and V. Gáspár, J. Chem. Soc., Faraday Trans., 1998, 94, 851–855 RSC.
Footnote |
| † Electronic supplementary information (ESI) available: Two videos displaying the propagation of the spiral and target patterns and an extra file explaining the contents of each video. See DOI: 10.1039/c4cp02587c |
| This journal is © the Owner Societies 2014 |

