 Open Access Article
Creative Commons Attribution 3.0 Unported Licence
Car–Parrinello and path integral molecular dynamics study of the intramolecular hydrogen bonds in the crystals of benzoylacetone and dideuterobenzoylacetone†
Piotr
Durlak
* and
Zdzisław
Latajka
Faculty of Chemistry, University of Wrocław, 14 F. Joliot-Curie Str., 50-383 Wrocław, Poland. E-mail: piotr@elrond.chem.uni.wroc.pl; Web: http://kwanty.wchuwr.pl/?q=durlak
First published on 1st September 2014
Abstract
The dynamics of the intramolecular short hydrogen bond in the molecular crystal of benzoylacetone and its deuterated analogue are investigated using ab initio molecular dynamics simulations. A study on intramolecular hydrogen bonding in 1-phenyl-1,3-butadione (I) and 1-deuteroxy-2-deutero-1-phenylbut-1-en-3-one (II) crystals has been carried out at 160 K and 300 K on the CPMD method level and at 300 K on the PIMD method level. The analysis of the two-dimensional free-energy landscape of reaction coordinate δ-parameter and RO⋯O distances shows that the hydrogen (deuter) between the two oxygen atoms adopts a slightly asymmetrical position in the single potential well. When the nuclear quantum effects are taken into account, very large delocalization of the bridging proton is observed. These studies indicate that hydrogen bonds in the crystal of benzoylacetone have characteristic properties for the type of bonding model resonance-assisted hydrogen bonds (RAHB) without existing the equilibrium of the two tautomers. The infrared spectrum has been calculated, and a comparative vibrational analysis has been performed. The CPMD vibrational results appear to qualitatively agree with the experimental ones.
1. Introduction
Hydrogen bond is the most important of all directional intermolecular interactions.1 We can distinguish several groups of hydrogen bonds due to their properties. Most often, we share hydrogen bonds of the three main classes: strong, moderate and weak. Among the listed classes, the most important parameters are the length and angle of the bond, the energy of the bond, the position of the proton in the hydrogen bridge and the IR frequency shift of X–H stretching vibration. The most common classification of H bonds is the Jeffrey's classification.2 Proton transfer and hydrogen bonds are fundamental for the function, stability, structure and dynamics of chemically and biologically relevant systems. Very strong hydrogen bonds are among the most interesting features of hydrogen bond categories, which have essential roles in biochemical reactions and enzyme catalysis as transition state.3,4 In some specific molecular systems, for example, amides,5,6 ketones,7 pyrroles,8 phenols,9 proteins and nucleic acids,10 the π-bond cooperativity phenomena were observed. These effects are explained by Gilli and Gilli11–16 and coworkers who described and named the new class of hydrogen bonds in the series of β-diketones. This name, resonance-assisted hydrogen bond (RAHB), operates in the scientific environment, and is used when we talk about strong or very strong hydrogen bonds with a neutral donor and acceptor, which are connected by π-conjugated double bonds. Because β-diketones are important reagents in organic synthesis and have very interesting properties, they have been recently the subject of many experimental and theoretical studies.17–22 Special attention has been paid to the keto–enol tautomerism of the β-diketones, the structural properties of both keto and enol forms and the nature of the strong O–H⋯O hydrogen bond in the enol form.23Currently, in the literature debate continues regarding the shape of the potential well for the β-diketones, especially in the context of the occurrence of the enol forms of β-diketones and the related intramolecular enol–enol forms. In this regard, the scientific community is divided into two groups. Some researchers report a well with a single minimum24–26 and others claim that it is a well with a double minimum function.27,28 In addition, large differences in the shape of the free energy function have been observed for the same substances present in different states of matter.23–25,29 Previous theoretical studies mainly on the DFT level on the benzoylacetone molecule in vacuum found the potential for proton transfer to be a double minimum with a barrier height of ca. 2 kcal mol−1.23,30 After the addition the correction of the zero-point vibrational energy to the total potential energy, the internal barrier vanished and effective potential for the proton motion is a single one.30
In the present article, we have described the structures, proton motion, two-dimensional free-energy landscapes and the shapes of the O–H⋯O potential function in benzoylacetone (BA) (I) and dideuterobenzoylacetone (II) (D2BA) in the solid state. Neutron diffraction data shows that in the solid state the enol structure of benzoylacetone with an almost symmetrical enol ring has been found.24,25 We have also discussed the influence of isotope effect on the shape of the free-energy function by analyzing the results of deuterium substitution obtained from MD simulations. To perform these tasks we used the PIMD method,31,32 which takes into account the quantum nature of the proton and enables the thorough description of the movement of proton tunneling over the potential barrier.
2. Computational details
2.1. Static calculations
To localize the key stationary points on the potential energy surface (PES) of the 1-phenyl-1,3-butadione (benzoylacetone) (I) in the solid state, a series of full geometry and cell optimizations with the London-type empirical correction for dispersion interactions, as proposed by Grimme,33 together with the vibrational harmonic frequency calculations were undertaken. For the crystal, the structural data was obtained from the neutron diffraction study by Madsen and co-workers.24,25 Calculations were performed using the CRYSTAL09 program34,35 utilizing the DFT method with PBE functional36 with the two shrinking factors (7,7) to generate a commensurate grid of k-points in reciprocal space, following the Monkhorst–Pack method.37 Calculations were carried out with the consistent Gaussian basis sets of triple-zeta valence with polarization quality for solid-state calculations (pob_TZVP_2012), as proposed by Peintinger, Vilela Oliveira, and Bredow.38 For both the crystals, 1-phenyl-1,3-butadione (benzoylacetone) (I) (BA) and 1-deuteroxy-2-deutero-1-phenylbut-1-en-3-one (dideuterobenzoylacetone) (II) (D2BA), calculation of vibrational frequencies in CRYSTAL09 was performed at the Γ-point.34,352.2. Dynamic and quantum dynamic simulations
Molecular dynamics calculations were carried out using the CPMD program, version 3.15.3.39 The initial molecular configuration for the 1-phenyl-1,3-butadione and 1-deuteroxy-2-deutero-1-phenylbut-1-en-3-one crystals was optimized by the preconditioned conjugate gradient (PCG) method with the London-type empirical correction for dispersion interactions, as proposed by Grimme33 along with periodic boundary conditions (PBCs), which was employed for the solid state calculations. In these cases, real space Ewald summation of electrostatic interactions was carried out taking into account 8 cell replicas in each direction. We also generated the Monkhorst–Pack mesh (3,3,3) for calculated k-points in reciprocal space in each direction. The crystals data from the neutron diffraction study by Madsen et al.24,25 were selected as the starting points. The crystals are monoclinic, benzoylacetone (P21/c) with cell dimensions of a = 8.028, b = 5.483, c = 19.478 Å, and α = γ = 90°, β = 110.42° with four formula units in the unit cell (Z = 4) and dideuterobenzoylacetone (P21/c) with cell dimensions a = 8.015, b = 5.485, c = 19.462 Å, and α = γ = 90°, β = 110.34° with four formula units in the unit cell (Z = 4). Molecular dynamics (NVT ensemble) were carried out at 160 K and 300 K, respectively, with a time step of 3.0 a.u. (0.072566 fs) coupled to a Nosé–Hoover chains thermostat40 at a frequency of 3200 cm−1. The experimental values of unit cell parameters were used in the CPMD and PIMD simulations. An electronic mass parameter of 600 a.u. was employed. Electronic exchange and correlation have been modeled using the gradient-corrected functional of Perdew, Burke and Ernzerhof (PBE).36 Core electrons were treated using the norm-conserving atomic pseudopotentials (PP) of Troullier and Martins,41 while valence electrons were represented in a plane-wave basis set truncated at an extended energy cut-off of 80 Ry. Following the initial equilibration period (about 8 ps), data was accrued for further 55 ps for crystals (I) and (II) Car–Parrinello at two different levels of temperature and for both crystals imaginary-time (55 ps) for the path integral dynamics simulation, carried out only at 300 K, respectively for eight (PI8) Trotter replicas (polymer-beads) using the normal mode variable transformation. The data was visualized using the VMD42 and Gnuplot43 programs with the path integral data first processed using a script by Kohlmeyer to calculate the centroid position of each set of polymer-beads.44The vibrational spectrum was also calculated using the Fourier transformation of the dipole autocorrelation function obtained from dipole trajectories generated by the CPMD simulation facilitated by the scripts of Forbert and Kohlmeyer.45 It is important to point out that this approach includes anharmonic effects and all the vibrational modes for molecules in crystals. The lattice vibrations were not received because fixed experimental values of unit cell were used.
3. Results and discussion
3.1. Structure analysis
The molecular geometry (in the unit cell) and atoms labeling of 1-phenyl-1,3-butadione (benzoylacetone, BA) in the solid state and its deuterated analogue are shown in Fig. 1. Red labeling was used for the second structure when two hydrogen atoms (H1, H5) in a single molecule has been substituted by deuterium. In Table 1, the calculated selected interatomic distances and angles after optimization compared with the average geometrical parameters from CPMD (standard deviation in brackets) and with the existing experimental data for both the crystals are presented. As can be inferred from Table 1, distances between heavy atoms in the hydrogen bond (O1–O2) in the studied crystals are very short (ca. 2.5 Å) and have a similar length regardless of the method of analysis. We can also observe that the average lengths of the deuterated bridge in the analogue (II) are slightly longer than the average lengths of the H-bridge of the structure (I). It shows very good agreement of computed MD geometrical parameters with the neutron diffraction experiment.24,25 However, the geometry optimization on the static methods level slightly underestimates the length of the hydrogen bridge of about 0.051 Å for the structure (I). For analyzing the geometric structure of the molecule in terms of the prevalence of characteristics model RAHB, we should carefully consider the length of the four bonds in the keto–enol parts of the molecule. Taking into the account our simulations carried out on the static and especially on dynamic levels, we can conclude that the bond lengths (O1![[double bond, length as m-dash]](https://www.rsc.org/images/entities/char_e001.gif) C2/O2–C4 and C4
C2/O2–C4 and C4![[double bond, length as m-dash]](https://www.rsc.org/images/entities/char_e001.gif) C3/C2–C3) coincide with typical lengths for the bonds determined experimentally. For example, let us analyze the data from both simulations for the crystal (I), static optimization on the DFT method level and molecular dynamics in terms of Car–Parrinello. The resulting values are presented in order O1
C3/C2–C3) coincide with typical lengths for the bonds determined experimentally. For example, let us analyze the data from both simulations for the crystal (I), static optimization on the DFT method level and molecular dynamics in terms of Car–Parrinello. The resulting values are presented in order O1![[double bond, length as m-dash]](https://www.rsc.org/images/entities/char_e001.gif) C2/O2–C4 (1.286/1.336 Å) and C4
C2/O2–C4 (1.286/1.336 Å) and C4![[double bond, length as m-dash]](https://www.rsc.org/images/entities/char_e001.gif) C3/C2–C3 (1.388/1.418 Å); O1
C3/C2–C3 (1.388/1.418 Å); O1![[double bond, length as m-dash]](https://www.rsc.org/images/entities/char_e001.gif) C2/O2–C4 (1.290/1.316 Å) and C4
C2/O2–C4 (1.290/1.316 Å) and C4![[double bond, length as m-dash]](https://www.rsc.org/images/entities/char_e001.gif) C3/C2–C3 (1.406/1.415 Å) for DFT and CPMD methods, respectively. It can be concluded that the equivalence of bond lengths may be attributed to delocalization over a conjugated π-bonded system in the keto–enol group.15 The quoted values of the bonds lengths clearly indicate different chemical bonds character. O2–C4, C2–C3 bonds are single and O1
C3/C2–C3 (1.406/1.415 Å) for DFT and CPMD methods, respectively. It can be concluded that the equivalence of bond lengths may be attributed to delocalization over a conjugated π-bonded system in the keto–enol group.15 The quoted values of the bonds lengths clearly indicate different chemical bonds character. O2–C4, C2–C3 bonds are single and O1![[double bond, length as m-dash]](https://www.rsc.org/images/entities/char_e001.gif) C2, C4
C2, C4![[double bond, length as m-dash]](https://www.rsc.org/images/entities/char_e001.gif) C3 bonds have a double bond character. In addition, we have a relatively short hydrogen bridge and a non-ideal symmetrical position of the proton. All of these features fit well in the assumptions of the RAHB model proposed by Gilli.15 The large non-linearity of the hydrogen bond is noteworthy. Each of the methods of calculation indicates that the angle values of the hydrogen bridge are between 150 and 157 degrees, which are close to the experimental data.24,25 Moreover, the computational results are in good agreement with the experimental data of the dihedral angles, as shown in Table 1. In our opinion this confirms the correctness of the implementation of the simulation because these parameters are particularly sensitive to structural errors.46 Moreover, the optimized parameters of the unit cell are in reasonable agreement with the experimental values.24,25 The largest error (ca. 10%) is noted for a parameter. For the remaining lattice parameters, errors between optimized and experimental values are smaller than 5%. This appears to confirm the need to use dispersion corrections to the full energy for calculations on the DFT method level.47
C3 bonds have a double bond character. In addition, we have a relatively short hydrogen bridge and a non-ideal symmetrical position of the proton. All of these features fit well in the assumptions of the RAHB model proposed by Gilli.15 The large non-linearity of the hydrogen bond is noteworthy. Each of the methods of calculation indicates that the angle values of the hydrogen bridge are between 150 and 157 degrees, which are close to the experimental data.24,25 Moreover, the computational results are in good agreement with the experimental data of the dihedral angles, as shown in Table 1. In our opinion this confirms the correctness of the implementation of the simulation because these parameters are particularly sensitive to structural errors.46 Moreover, the optimized parameters of the unit cell are in reasonable agreement with the experimental values.24,25 The largest error (ca. 10%) is noted for a parameter. For the remaining lattice parameters, errors between optimized and experimental values are smaller than 5%. This appears to confirm the need to use dispersion corrections to the full energy for calculations on the DFT method level.47
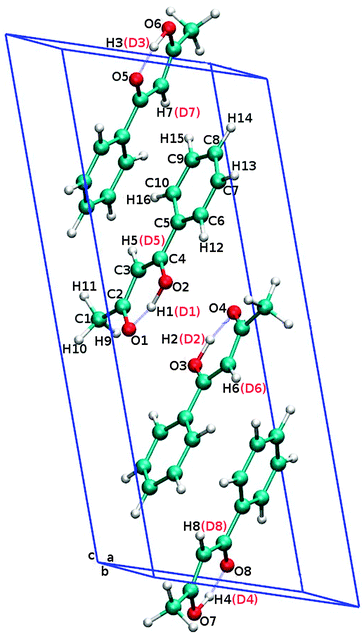 | ||
| Fig. 1 Unit cell and atoms labeling of 1-phenyl-1,3-butadione (benzoylacetone) crystal. The red colored labels are for dideuterobenzoylacetone crystal. | ||
| Parameter | PBE/pob_TZVP_2012 | PBE/PCG/80 Ry | CPMD avg. | Exptl.24–26 | ||||
|---|---|---|---|---|---|---|---|---|
| 80 Ry/160 K | 80 Ry/300 K | |||||||
| I | II | I | II | I | II | |||
| O1–O2 | 2.451 | 2.427 | 2.493 (0.071) | 2.498 (0.069) | 2.511 (0.103) | 2.515 (0.100) | 2.502 | 2.522 |
| O2–H1/O2–D1 | 1.069 | 1.073 | 1.164 (0.195) | 1.161 (0.198) | 1.225 (0.233) | 1.205 (0.234) | 1.245 | 1.002 |
| H1⋯O1/D1⋯O1 | 1.450 | 1.405 | 1.404 (0.220) | 1.416 (0.224) | 1.372 (0.277) | 1.397 (0.269) | 1.329 | 1.611 |
| O1–C2 | 1.286 | 1.277 | 1.286 (0.029) | 1.285 (0.029) | 1.290 (0.365) | 1.290 (0.036) | 1.286 | 1.290 |
| O2–C4 | 1.336 | 1.324 | 1.319 (0.029) | 1.319 (0.029) | 1.316 (0.037) | 1.316 (0.037) | 1.293 | 1.293 |
| C2–C3 | 1.418 | 1.426 | 1.416 (0.028) | 1.416 (0.028) | 1.415 (0.035) | 1.415 (0.036) | 1.414 | 1.403 |
| C4–C3 | 1.388 | 1.392 | 1.400 (0.026) | 1.399 (0.027) | 1.406 (0.034) | 1.406 (0.034) | 1.405 | 1.403 |
| C2–C1 | 1.494 | 1.492 | 1.500 (0.024) | 1.501 (0.025) | 1.503 (0.033) | 1.503 (0.033) | 1.499 | 1.493 |
| C4–C5 | 1.462 | 1.473 | 1.475 (0.023) | 1.474 (0.023) | 1.477 (0.032) | 1.477 (0.031) | 1.483 | 1.482 |
| C5–C6 | 1.408 | 1.402 | 1.409 (0.020) | 1.409 (0.019) | 1.411 (0.027) | 1.411 (0.028) | 1.406 | |
| C6–C7 | 1.389 | 1.394 | 1.397 (0.019) | 1.396 (0.019) | 1.398 (0.026) | 1.403 (0.026) | 1.402 | |
| C7–C8 | 1.395 | 1.397 | 1.395 (0.019) | 1.395 (0.019) | 1.396 (0.026) | 1.396 (0.026) | 1.387 | |
| C8–C9 | 1.395 | 1.390 | 1.397 (0.019) | 1.397 (0.018) | 1.398 (0.026) | 1.399 (0.026) | 1.404 | |
| C9–C10 | 1.389 | 1.396 | 1.396 (0.019) | 1.395 (0.018) | 1.397 (0.026) | 1.397 (0.026) | 1.394 | |
| C10–C5 | 1.403 | 1.406 | 1.402 (0.019) | 1.402 (0.019) | 1.403 (0.027) | 1.403 (0.026) | 1.404 | |
| C3–H5/C3–D5 | 1.084 | 1.081 | 1.083 (0.021) | 1.084 (0.020) | 1.085 (0.028) | 1.085 (0.028) | 1.076 | |
| C1–H9 | 1.099 | 1.102 | 1.101 (0.022) | 1.100 (0.022) | 1.103 (0.031) | 1.103 (0.030) | 1.064 | |
| C1–H10 | 1.096 | 1.093 | 1.101 (0.022) | 1.101 (0.023) | 1.102 (0.031) | 1.102 (0.030) | 1.062 | |
| C1–H11 | 1.094 | 1.091 | 1.100 (0.022) | 1.100 (0.022) | 1.103 (0.031) | 1.103 (0.030) | 1.051 | |
| C6–H12 | 1.091 | 1.089 | 1.086 (0.021) | 1.085 (0.020) | 1.087 (0.028) | 1.087 (0.028) | 1.079 | |
| C7–H13 | 1.089 | 1.085 | 1.090 (0.021) | 1.091 (0.022) | 1.093 (0.030) | 1.092 (0.029) | 1.090 | |
| C8–H14 | 1.090 | 1.088 | 1.093 (0.022) | 1.093 (0.021) | 1.094 (0.029) | 1.094 (0.029) | 1.091 | |
| C9–H15 | 1.088 | 1.087 | 1.083 (0.021) | 1.085 (0.020) | 1.087 (0.028) | 1.087 (0.028) | 1.090 | |
| C10–H16 | 1.088 | 1.085 | 1.086 (0.022) | 1.086 (0.022) | 1.088 (0.029) | 1.088 (0.029) | 1.085 | |
| <O1–H1–O2/<O1–D1–O2 | 153.07 | 156.67 | 152.03 (4.91) | 154.49 (4.87) | 150.76 (6.89) | 150.53 (6.90) | 152.36 | 148.84 |
| <H1–O2–C4/<D1–O2–C4 | 104.89 | 103.12 | 103.88 (3.07) | 104.14 (3.05) | 103.71 (4.15) | 103.83 (4.10) | 103.24 | 108.73 |
| <H1–O1–C2/<D1–O1–C2 | 100.72 | 100.25 | 100.87 (3.11) | 100.83 (3.09) | 101.07 (4.10) | 101.00 (4.10) | 101.24 | 106.73 |
| <O2–C4–C3 | 119.44 | 119.74 | 119.98 (1.98) | 120.02 (1.95) | 120.02 (2.69) | 120.05 (2.71) | 120.93 | 121.21 |
| <O1–C2–C3 | 121.29 | 120.87 | 121.49 (2.05) | 121.58 (2.03) | 121.51 (2.74) | 121.57 (2.78) | 122.13 | 122.4 |
| <C4–C3–C2 | 120.09 | 119.20 | 120.29 (2.05) | 120.39 (2.03) | 120.45 (2.78) | 120.55 (2.81) | 120.93 | 120.3 |
| <C4–C3–H5/<C4–C3–D5 | 120.69 | 121.36 | 120.30 (3.06) | 120.25 (3.01) | 120.05 (4.19) | 120.10 (4.07) | 121.54 | |
| <C2–C3–H5/<C2–C3–D5 | 119.01 | 119.42 | 118.93 (2.98) | 118.88 (2.99) | 118.66 (4.13) | 118.55 (4.02) | 118.74 | |
| <O1–C2–C1 | 118.27 | 118.15 | 118.26 (2.83) | 118.38 (2.83) | 117.92 (3.64) | 117.89 (3.75) | 117.03 | 116.8 |
| <C2–C1–H9 | 108.12 | 110.16 | 110.21 (3.46) | 109.96 (3.49) | 110.26 (4.76) | 110.12 (4.68) | 109.84 | |
| <C2–C1–H10 | 108.83 | 108.79 | 109.73 (3.93) | 110.37 (3.59) | 110.09 (4.64) | 110.27 (4.65) | 110.84 | |
| <C2–C1–H11 | 111.72 | 111.66 | 110.82 (3.53) | 110.42 (3.53) | 110.36 (4.72) | 110.46 (4.68) | 112.65 | |
| <C1–C2–C3 | 120.43 | 120.98 | 120.09 (3.03) | 119.88 (2.98) | 120.28 (3.94) | 120.23 (3.93) | 120.92 | 120.8 |
| <C3–C4–C5 | 124.90 | 125.03 | 122.89 (2.58) | 122.79 (2.59) | 122.42 (3.28) | 122.53 (3.33) | 122.62 | 122.81 |
| <O2–C4–C5 | 115.65 | 115.23 | 116.93 (2.52) | 116.99 (2.59) | 117.25 (3.21) | 117.11 (3.30) | 116.43 | 116.01 |
| <C4–C5–C6 | 119.93 | 118.87 | 119.87 (2.26) | 119.95 (2.23) | 122.42 (3.28) | 119.95 (3.01) | 121.52 | |
| <C4–C5–C10 | 120.87 | 121.88 | 121.34 (2.21) | 121.31 (2.19) | 121.32 (2.98) | 121.30 (2.93) | 119.02 | |
| <C5–C6–C7 | 120.32 | 120.43 | 120.26 (1.82) | 120.24 (1.86) | 119.94 (3.01) | 120.22 (2.48) | 119.83 | |
| <C5–C10–C9 | 120.04 | 119.86 | 120.71 (1.87) | 120.79 (1.90) | 120.83 (2.53) | 120.83 (2.54) | 120.32 | |
| <C6–C7–C8 | 120.09 | 119.91 | 120.37 (1.87) | 120.41 (1.90) | 120.40 (2.56) | 120.39 (2.57) | 120.43 | |
| <C10–C9–C8 | 120.53 | 120.40 | 120.10 (1.84) | 120.04 (1.88) | 120.02 (2.54) | 119.95 (2.52) | 119.93 | |
| <C7–C8–C9 | 119.82 | 119.98 | 119.49 (1.87) | 119.49 (1.85) | 119.33 (2.52) | 119.38 (2.54) | 120.13 | |
| <C8–C9–C10 | 120.53 | 120.40 | 120.10 (1.84) | 119.49 (1.85) | 119.33 (2.53) | 119.95 (2.52) | 119.93 | |
| <C5–C10–H16 | 120.79 | 121.06 | 120.18 (2.85) | 120.10 (2.83) | 120.05 (3.69) | 120.08 (3.93) | 119.14 | |
| <C5–C6–H12 | 119.22 | 119.05 | 119.19 (2.96) | 119.24 (2.94) | 119.02 (4.07) | 119.04 (4.08) | 120.94 | |
| <H12–C6–C7 | 120.45 | 120.53 | 120.28 (2.96) | 120.25 (2.98) | 120.23 (4.12) | 120.25 (4.14) | 119.24 | |
| <H16–C10–C9 | 119.13 | 119.07 | 118.83 (2.84) | 118.82 (2.81) | 118.63 (3.99) | 118.59 (3.89) | 120.64 | |
| <H13–C7–C6 | 119.53 | 119.43 | 119.52 (2.96) | 119.48 (2.88) | 119.47 (4.01) | 119.58 (4.02) | 119.04 | |
| <H15–C9–C10 | 119.19 | 119.32 | 119.46 (2.97) | 119.49 (2.96) | 119.36 (4.07) | 119.35 (4.07) | 119.74 | |
| <H13–C7–C8 | 120.36 | 120.65 | 119.86 (2.97) | 119.86 (2.86) | 119.68 (3.94) | 119.57 (4.00) | 120.64 | |
| <H15–C9–C8 | 120.28 | 120.28 | 120.13 (2.98) | 120.17 (2.98) | 120.09 (4.05) | 119.91 (4.04) | 120.44 | |
| <C7–C8–H14 | 118.90 | 120.40 | 120.02 (2.95) | 120.02 (2.90) | 119.98 (3.99) | 119.91 (4.04) | 120.74 | |
| <C9–C8–H14 | 121.27 | 119.59 | 120.22 (2.97) | 120.24 (2.93) | 120.23 (4.04) | 120.24 (4.08) | 119.24 | |
| ϕO2–C4–C5–C6 | −174.39 | −176.07 | −173.74 (3.25) | −173.41 (3.25) | −173.02 (3.87) | −173.43 (3.26) | −173.54 | −173.72 |
| ϕH9–C1–C2–O1 | 37.99 | 29.85 | 32.56 (4.18) | 33.04 (4.12) | 35.02 (4.25) | 37.22 (4.03) | 38.05 | 38.45 |
| ϕH11–C1–C2–O1 | −80.87 | −88.50 | −84.06 (3.56) | −87.23 (3.52) | −83.45 (3.78) | −84.02 (3.25) | −81.06 | −82.07 |
| a | 7.265 | 8.028 | 8.015 | |||||
| b | 5.317 | 5.483 | 5.485 | |||||
| c | 18.694 | 19.478 | 19.462 | |||||
| α | 90.00 | 90.00 | 90.00 | |||||
| β | 107.24 | 110.42 | 110.34 | |||||
| γ | 90.00 | 90.00 | 90.00 | |||||
3.2. Molecular dynamics simulations
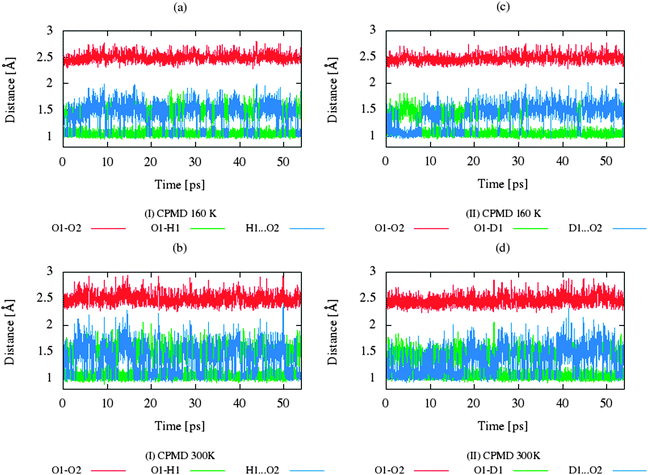
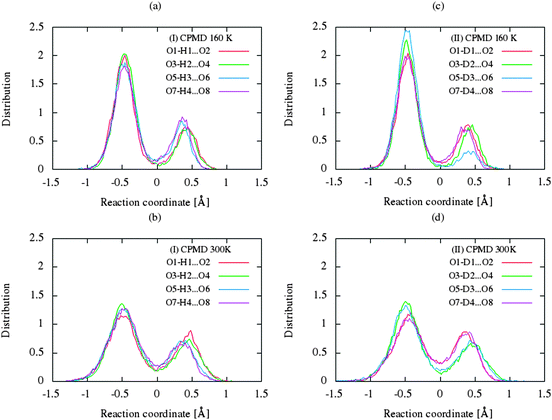
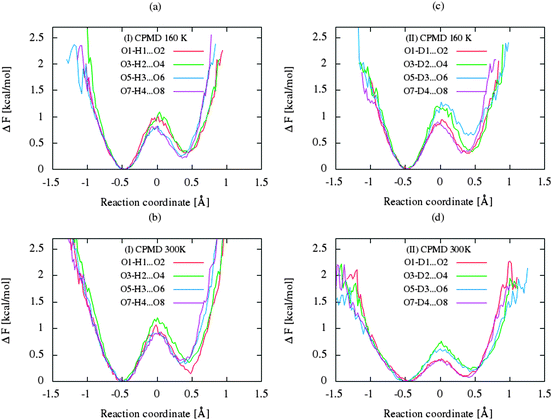
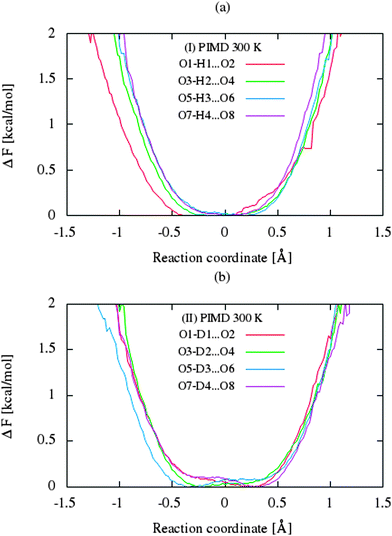
The CP dynamic simulations were performed at two different temperatures because the experimental data for crystals are reported in this manner,26 while PIMD simulations were conducted only at 300 K due to a very high computational cost. The time evolution behavior of bond lengths directly involved in the selected intramolecular hydrogen bonds O2–H1(D1)⋯O1 from crystals (I) and (II) at 160 K and 300 K is presented in Fig. 2. The careful analysis of the strong O2–H1(D1)⋯O1 intramolecular hydrogen bond shows very large fluctuation of the bridging proton/deuter between the two oxygen atoms in crystals (I) and (II) at 160 K (see Fig. 2a and c) and significantly larger mobility of proton/deuter in hydrogen bridge in the simulations at 300 K (see Fig. 2b and d). As expected, higher temperature of simulation causes more frequent proton/deuter hops (transfer). At 160 K, proton/deuter jumps about 80 times while at 300 K this occurs almost three times more often. According to our estimates, the full process of proton hopping in the crystal of benzoylacetone takes about 12–16 fs, which is close to the experimental and theoretical data.5,6,48,49 When we analyze the results of the PIMD simulation taking into account the quantum effects, it can be seen that the proton/deuter is completely delocalized between the two carbonyl oxygens (see Fig. 3). From the CPMD simulations at 160 K, the O2–H1(D1) bonds length changes in the ranges 0.953–1.895 Å for the crystal (I) and 0.896–2.052 Å for the crystal (II), while at 300 K the O2–H1(D1) bonds length changes in the ranges 0.945–1.887 Å for the crystal (I) and 0.917–2.108 Å for the crystal (II). Averaged O2–H1(D1) distances from the molecular dynamics method (see Table 1) are strongly dependent on temperature and their values are 1.164/1.161 Å and 1.225/1.205 Å for the crystal (I) and (II) at 160 K and 300 K, respectively. Following the distance of the hydrogen bridge, we observe that the O–H bonds are extremely sensitive to changes in temperatures. This phenomenon has been described by Wilson and co-workers50 on the basis of single neutron diffraction studies for the benzoic acid crystal. The analysis of the distribution function of proton/deuter in the hydrogen bridge shows the importance of quantum effects. Their inclusion in the calculation completely changes the picture of physical processes. Fig. 4 and 5 present the distribution functions (δ-parameter) of proton/deuter position along the reaction coordinate on the basis of our results from the CPMD and PIMD method. To show the influence of quantum effects in a better manner, we have prepared a series of graphs of free energy. Fig. 6 and 7 show the free energy profiles for proton motion obtained from the CPMD and PIMD results. Free energy profiles were calculated following the equation:ΔF = −kT![[thin space (1/6-em)]](https://www.rsc.org/images/entities/char_2009.gif) ln[P(δ)], ln[P(δ)], | (1) |
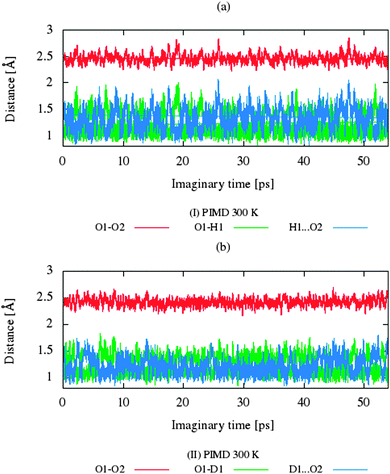 | ||
| Fig. 3 Time evolution of bonds involved in the hydrogen bonds O1–H1(D1)⋯O2 for (a) benzoylacetone at 300 K and for (b) dideuterobenzoylacetone at 300 K from the PIMD calculations. | ||
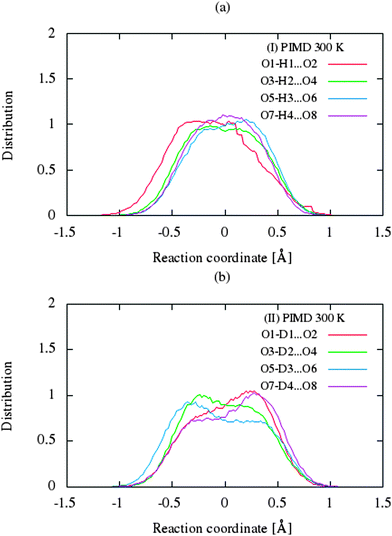 | ||
| Fig. 5 Comparison of the distribution functions (δ-parameter) from PIMD simulations for the intramolecular H-bonds for (a) benzoylacetone at 300 K and (b) dideuterobenzoylacetone at 300 K. | ||
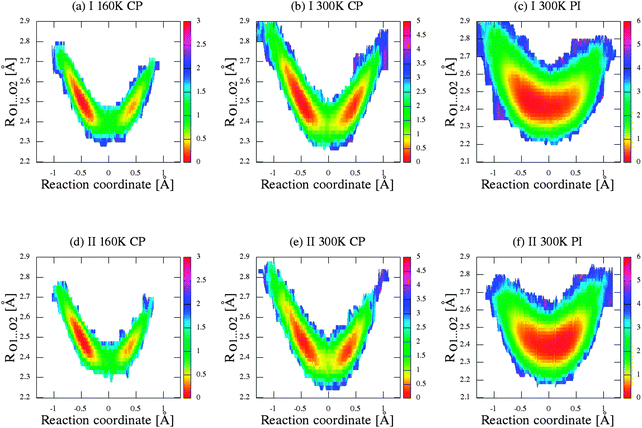
For a deeper analysis of proton mobility in the studied intramolecular H-bonds, we constructed two-dimensional free-energy landscapes from two-dimensional distribution of δ-parameter and O⋯O distances, as illustrated in Fig. 8, Fig. 1S–3S (in ESI†), for every hydrogen bridge in the crystal unit, for further analysis for the proton/deuter transfer. As shown in the series of figures from 8 to 3S (ESI†), the panels (a) and (b) presented the free energy surfaces obtained for crystal (I) from CPMD simulations and panel (c) from PIMD simulations. Similarly, the sections (d)–(f) of figures were obtained for the second crystal (II).
Let us now briefly discuss the abovementioned landscapes. As shown in sections a, b, d and e of figures, the free energy surfaces obtained from CP simulations have two minima, while sections (c) and (f) obtained from PIMD simulations have one minimum in each case. As shown in Fig. 7a and b, the nuclear quantum effects remove the proton transfer barrier, allowing barrier-less proton transfer. Considering the two-dimensional free-energy landscapes, we can also see a substantial mobility and relocation of proton position at higher temperatures of simulations and negligible impact of isotope effect on the shape and height of the energy barrier of proton/deuter transfer. Moreover, despite the fact that the potential well has one minimum, the position of the proton/deuter is not perfectly symmetrical. It is a very subtle effect, which is often accompanied by typical resonance-assisted hydrogen bond.
According to Gilli and Gilli,15,16 for the description resonance-assisted hydrogen bonded systems, the very important so-called π-delocalization index is defined as:
 | (2) |
The calculated and experimental value of the O1⋯O2 distance close to 2.5 Å might suggest strong O–H⋯O intramolecular bond. Estimation of the strength of intramolecular H-bonds for systems in a crystal is not trivial. One of the simplest methods for determining H-bond strength in vacuum is the calculation of the difference in energy between closed (X–H⋯Y) and open configuration. However, this approach cannot be applied for a system in a crystal. Therefore, for estimating this intramolecular H-bond, we used the very simple relation proposed by Musin and Marian:52
EHB = (5.554 × 10⁵)![[thin space (1/6-em)]](https://www.rsc.org/images/entities/char_2009.gif) exp(−4.12R), exp(−4.12R), | (3) |
3.3. IR spectra
For crystal (I) and (II), selected characteristics of vibrational frequencies from CPMD, together with harmonic frequencies from static calculations and available experimental data, are presented in Table 2. Fig. 10 presents the CPMD infrared spectrum for both the examined crystals BA and D2BA with experimental spectra for BA crystal.53,54 For further comparative vibrational analysis, we also compared the simulated and experimental spectra for BA crystal and its deuterated analogue, as illustrated in Fig. 11. The assignments of the calculated frequencies are based on the experimental IR53 spectra for benzoylacetone and its deuterated analogue. As we know, infrared spectroscopy is a very useful experimental method for studying the strength of the hydrogen bond and it is also very important because it confirms that the results of molecular dynamics simulation are correct. In the context of this paper, the analysis of the vibration frequency of –OH groups appears to be the most important. The characteristics of –OH stretching vibration in the enol form of the β-diketones appears as a weak and a very broad band in the 3300–2000 cm−1 region.55–58 The intensity and broadness of this band are dependent on the strength of the intramolecular hydrogen bond.53 We have observed that the stretching vibrations –OH/–OD are shifted in comparison to the –OH/–OD frequencies of bonds not involved in H-bond to lower frequencies of about 2217/1681 cm−1 and 2514/1922 cm−1 for crystals (I) and (II), respectively, in both the calculation methods. The calculated stretching vibrations –OH/–OD are in good agreement with experimental results (2650/1960 cm−1) but it appears that the CP molecular dynamics method reproduces the frequencies of vibrations better than static methods in harmonic approximation in every case. As compared with the experiment, most of the frequencies from CPMD methods are slightly shifted toward a lower frequency; however, no clear tendency can be observed because some frequencies are a slightly higher. As expected, we observed very large red shift effects of –OH stretching vibrations in these molecular systems. This phenomenon is typical for the incidence of enol–enol resonance structure with the strong intramolecular hydrogen bond.| Assignment frequencies | PBE/pob_TZVP_2012 (I)/(II) | CPMD/PBE/80 Ry (I)/(II) | Exptl.53 (I)/(II) |
|---|---|---|---|
| Experimental data from ref. 53.a IR of BA in solid state.b IR of BA in CCl4 solution. | |||
| νCH/νCD | 3186/2361 | 3107/2336 | 3110b/2313b |
νCHring![[thin space (1/6-em)]](https://www.rsc.org/images/entities/char_2009.gif) assym. assym. |
3153/3152 | 3023/3015 | 3070b/3090b |
νCHring![[thin space (1/6-em)]](https://www.rsc.org/images/entities/char_2009.gif) symm. symm. |
3136/3136 | 2995/3006 | 3070b/3070b |
| νCH | 3128/3128 | 2984/2978 | 3055b/3055b |
| νCH | 3114/3114 | 2956/2937 | 3030b/3030b |
| νCH3assym. | 3072/3071 | 2916/2895 | 3000b/3000b |
| νCH3symm. | 2986/2988 | 2892/2856 | 2920b/2920b |
| νOH/νOD | 2217/1681 | 2514/1922 | 2650b/1960b |
νC![[double bond, length as m-dash]](https://www.rsc.org/images/entities/char_e001.gif) O–C O–C![[double bond, length as m-dash]](https://www.rsc.org/images/entities/char_e001.gif) C + δOH + δCH/νC C + δOH + δCH/νC![[double bond, length as m-dash]](https://www.rsc.org/images/entities/char_e001.gif) O–C O–C![[double bond, length as m-dash]](https://www.rsc.org/images/entities/char_e001.gif) C + δOD + δCH C + δOD + δCH |
1608/1541 | 1624/1546 | 1620a 1618b/1525b |
δOH + νC![[double bond, length as m-dash]](https://www.rsc.org/images/entities/char_e001.gif) O–C O–C![[double bond, length as m-dash]](https://www.rsc.org/images/entities/char_e001.gif) C/δOD + νC C/δOD + νC![[double bond, length as m-dash]](https://www.rsc.org/images/entities/char_e001.gif) O–C O–C![[double bond, length as m-dash]](https://www.rsc.org/images/entities/char_e001.gif) C C |
1605/1540 | 1609/1511 | 1600a 1605b/1516b |
νC![[double bond, length as m-dash]](https://www.rsc.org/images/entities/char_e001.gif) C + δOH/νC C + δOH/νC![[double bond, length as m-dash]](https://www.rsc.org/images/entities/char_e001.gif) C + δOD C + δOD |
1597/1461 | 1579/993 | 1570a 1572b/1098b |
νC![[double bond, length as m-dash]](https://www.rsc.org/images/entities/char_e001.gif) C + δOH/νC C + δOH/νC![[double bond, length as m-dash]](https://www.rsc.org/images/entities/char_e001.gif) C + δOD C + δOD |
1572/1433 | 1552/969 | 1555a 1554b/1098b |
δCH3 + δCH + νC–C![[double bond, length as m-dash]](https://www.rsc.org/images/entities/char_e001.gif) C–O C–O |
1497/1415 | 1465/1320 | 1458a 1458b/1362b |
| δCH3 | 1443/1433 | 1423/1407 | 1430b/1430b |
| νC–O + δOH + δCH3/νC–O + δOD + δCH3 | 1408/1343 | 1412/1073 | 1430b/1135b |
νC–C![[double bond, length as m-dash]](https://www.rsc.org/images/entities/char_e001.gif) C + δOH/νC–C C + δOH/νC–C![[double bond, length as m-dash]](https://www.rsc.org/images/entities/char_e001.gif) C + δOD C + δOD |
1299/1072 | 1284/991 | 1280a 1272b/1070b |
| γOH/γOD | 1109/1050 | 930/702 | 955a 957b/720b |
| ρCH3 | 991/989 | 960/910 | 985a 987b/890b |
| γCH/γCD | 749/710 | 774/648 | 805a 801b/815b |
| γCHring | 695/670 | 691/642 | 764a 770b/720b |
| γC–CH3 | 556/549 | 561/550 | 588a 588b/— |
| νO⋯O + δC–CH3 | 410/395 | 345/279 | 396a 396b/384b |
| γC–CH3 | 152/150 | 161/162 | 153a/143b |
| τCH3 | 147/144 | 136/140 | 138a/143b |
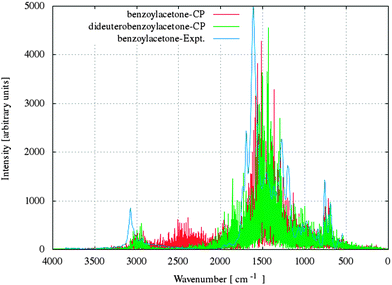 | ||
| Fig. 10 Comparison of the experimental (blue line)53,54 and simulated IR spectra for benzoylacetone (red line) and dideuterobenzoylacetone (green line). | ||
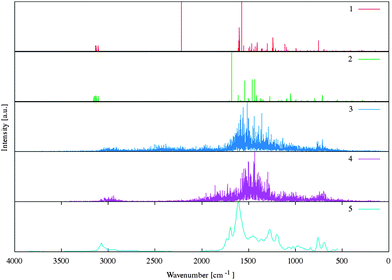 | ||
| Fig. 11 Comparison of the experimental and simulated IR spectra for benzoylacetone in the solid state. The numbers of spectra were assigned as follows: (1) benzoylacetone and (2) dideuterobenzoylacetone in the solid state from the DFT (PBE) harmonic calculation with London-type empirical correction for dispersion interactions, (3) benzoylacetone and (4) dideuterobenzoylacetone in the solid state from CP molecular dynamics simulation at 300 K and number (5) experimental IR absorbance spectrum53,54 for the benzoylacetone in the solid. | ||
A very important parameter related with the IR spectra of H-bonded systems is the isotope effect defined by the isotopic ratio (ISR) νOH/νOD. Because of the anharmonicity in a majority of H-bonded systems, the ISR value is different from √2. It has been shown that in the case of O–H⋯OH-bonds, the maximum value of ISR does not exceed 1.5.59 The calculated ISR values equal 1.32, 1.31, 1.35 from the static calculations, CPMD simulations and experiment, respectively. These values also indicate a very strong hydrogen bond and high mobility of proton in the hydrogen bridge. We observed a good agreement of the experimental data (3110/2313 cm−1) with the calculated (3186/2361 cm−1 and 3107/2336 cm−1) values for –CH/–CD stretching vibration frequency. In this case, we can also see a very large isotopic effect for these vibrations. The O⋯O stretching mode for BA in the experiment appears at about 396/384 cm−1. According to our static and CP calculations, these modes are located at about 410/395 cm−1 and 345/279 cm−1. The νO⋯O mode is coupled with δC–CH3 and the position of this band relates to other β-diketones, which also suggests the existence of very strong HB.
4. Conclusion
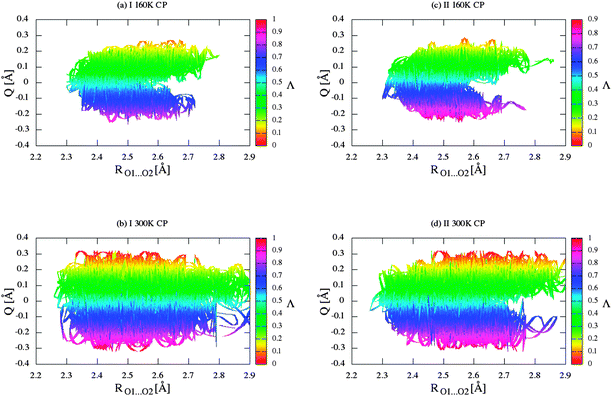
We have presented the results of theoretical studies on the intramolecular hydrogen bonds in 1-phenyl-1,3-butadione and its deuterated analogue 1-deuteroxy-2-deutero-1-phenylbut-1-en-3-one in the solid state using static as well as ab initio molecular dynamics methods. In our study of both the crystals, we found evidence for the existence of strong π-delocalized structure (enol–enol forms) with the location of the enol hydrogen in a very flat slightly asymmetric (almost symmetric) single minimum potential, which is in accordance with neutron diffraction studies performed by Madsen24,25 and co-workers. The analysis of average distances in the geometric structure of four bonds in the keto–enol parts of the molecule indicated that the equivalence of the bond lengths may be attributed to delocalization over a conjugated π-bonded system in the keto–enol group. We also calculated the π-delocalization index (which is equal to 0.445) for the both crystals taking as the basis for calculating the average bond lengths from CPMD simulation. In addition, the calculated correlation between the Q and the Λ parameters and the length of the hydrogen/deuter bridge throughout the simulation shows that the system is characterized by the type of strong π-delocalized structure (enol–enol forms) with slightly more contribution from the π-localized enol–keto (EK) form than π-localized keto–enol (KE) form. In our opinion, all the arguments presented above (a relatively short hydrogen bridge, non-ideal symmetrical position of the proton, the shape of the potential function of proton, the correlation between the Q and Λ parameters and very big red shift effects of –OH stretching vibrations) indicate that the hydrogen bonds in the benzoylacetone crystals have properties characteristic of the type of bonding model resonance-assisted hydrogen bonds without the existing equilibrium of the two tautomers.Acknowledgements
This paper is dedicated to the memory of my wonderful Mother, who recently passed away. The authors would like to gratefully acknowledge the Academic Computer Centre in Gdansk (CI TASK) for the use of the Galera-ACTION Cluster and the Wroclaw Centre for Networking and Supercomputing (WCSS) for the use of the Supernova Cluster. Dr Przemysław Dopieralski is acknowledged for helpful discussion as well as help with preparing the AWK's scripts.References
- T. Steiner, Angew. Chem., Int. Ed., 2002, 41, 48 CrossRef CAS.
- G. A. Jeffrey, An Introduction of Hydrogen Bonding, Oxford University Press, New York, USA, 1997 Search PubMed.
- W. W. Cleland and M. M. Kreevoy, Science, 1994, 264, 1887 CAS.
- A. Warshel, A. Papazyan and P. A. Kollman, Science, 1995, 269, 102 CAS.
- G. R. Desiraju and T. Steiner, The Weak Hydrogen Bond: In Structural Chemistry and Biology.(International Union of Crystallography Monographs on Crystallography; no. 23), Oxford University Press, USA, 1997 Search PubMed.
- P. Durlak, K. Mierzwicki and Z. Latajka, J. Phys. Chem. B, 2013, 117, 5430 CrossRef CAS PubMed.
- P. Sanz, O. Mó, M. Yáñez and J. Elguero, J. Phys. Chem. A, 2007, 111, 3585 CrossRef CAS PubMed.
- R. N. Singh, A. Kumar, R. K. Tiwari, P. Rawat, V. Baboo and D. Verma, Spectrochim. Acta, Part A, 2012, 92, 295 CrossRef CAS PubMed.
- H. Karabıyık, R. Sevinçek, H. Petek and M. Aygün, J. Mol. Model., 2012, 17, 1295 CrossRef PubMed.
- S. W. Rick and S. J. Stuart, Potentials and Algorithms for Incorporating Polarizability in Computer Simulations, in Reviews in Computational Chemistry, ed. K. B. Lipkowitz, T. R. Cundari, V. J. Gillet and D. B. Boyd, Wiley-VCH, Hoboken, New Jersey, 2002, vol. 18, pp. 89–146 Search PubMed.
- P. Gilli, V. Bertolasi, L. Pretto, L. Antonov and G. Gilli, J. Am. Chem. Soc., 2005, 127, 4943 CrossRef CAS PubMed.
- P. Gilli, V. Bertolasi, L. Pretto, V. Ferretti and G. Gilli, J. Am. Chem. Soc., 2004, 126, 3845 CrossRef CAS PubMed.
- P. Gilli, V. Bertolasi, V. Ferretti and G. Gilli, J. Am. Chem. Soc., 1994, 116, 909 CrossRef CAS.
- V. Bertolasi, P. Gilli, V. Ferretti and G. Gilli, J. Am. Chem. Soc., 1991, 113, 4917 CrossRef CAS.
- G. Gilli, F. Bellucci, V. Ferretti and V. Bertolasi, J. Am. Chem. Soc., 1989, 111, 1023 CrossRef CAS.
- G. Gilli and P. Gilli, The Nature of the Hydrogen Bond: Outline of a Comprehensive Hydrogen Bond Theory (International Union of Crystallography Monographs on Crystallography; no. 23), Oxford University Press, USA, 2009 Search PubMed.
- N. V. Belova, V. V. Sliznev, H. Oberhammer and G. V. Girichev, J. Mol. Struct., 2010, 978, 282 CrossRef CAS PubMed.
- F. Gomez-Garibay, J. S. Calderon, L. Quijano, O. Tellez, M. Soccoro-Olivares and T. Rios, Phytochemistry, 2001, 46, 1285 CrossRef.
- F. Wetz, C. Routaboul, D. Lavabre, J. C. Garrigues, I. Rico-Latters, I. Pernet and A. Denis, Photochem. Photobiol., 2004, 80, 316 CrossRef CAS.
- V. Bertolasi, V. Ferretti, P. Gilli, X. Yao and Ch.-J. Li, New J. Chem., 2008, 32, 694 RSC.
- C. M. Silvernail, G. Yap, R. D. Sommer, A. L. Rheingold, V. W. Day and J. A. Belot, Polyhedron, 2001, 20, 3113 CrossRef CAS.
- J. A. Belot, J. Clark, J. A. Cowan, G. S. Harbison, A. I. Kolesnikov, Y.-S. Kye, A. J. Schultz, C. Silvernail and X. Zhao, J. Phys. Chem. B, 2004, 108, 6922 CrossRef CAS.
- N. V. Belova, G. V. Girichev, H. Oberhammer, T. N. Hoang and S. A. Shlykov, J. Phys. Chem. A, 2012, 116, 3428 CrossRef CAS PubMed.
- G. K. H. Madsen, B. B. Iversen, F. K. Larsen, M. Kapon, G. M. Reisner and F. H. Herbstein, J. Am. Chem. Soc., 1998, 120, 10040 CrossRef CAS.
- G. K. H. Madsen, G. J. McIntyre, B. Schiøtt and F. K. Larsen, Chem. – Eur. J., 2007, 13, 5539 CrossRef CAS PubMed.
- F. H. Herbstein, B. B. Iversen, M. Kapon, F. K. Larsen, G. K. H. Madsen and G. M. Reisner, Acta Crystallogr., Sect. B: Struct. Sci., 1999, 55, 767 Search PubMed.
- S. I. Chan, L. Lin, D. Clutter and P. Dea, Proc. Natl. Acad. Sci. U. S. A., 1970, 65, 816 CrossRef CAS.
- E. V. Borisov, E. V. Skorodumov, V. M. Pachevskaya and P. E. Hansen, Magn. Reson. Chem., 2005, 43, 992 CrossRef CAS PubMed.
- J. W. Bunting, J. P. Kanter, R. Nelander and Z. Wu, Can. J. Chem., 1995, 73, 1305 CrossRef CAS.
- B. Schiøtt, B. B. Iversen, G. K. H. Madsen and T. C. Bruice, J. Am. Chem. Soc., 1998, 120, 12117 CrossRef.
- D. Marx, Advanced Car–Parrinello Techniques: Path Integrals and Nonadiabaticity in Condensed Matter Simulations, in Computer Simulations in Condensed Matter Systems: From Materials to Chemical Biology Volume 2, Lect. Notes Phys., ed. M. Ferrario, G. Ciccotti and K. Binder, Springer, Berlin, 2006, vol. 704, pp. 507–539 Search PubMed.
- M. E. Tuckerman, Path Integration via Molecular Dynamics, in Quantum Simulation of Complex Many-Body Systems: From Theory to Algorithms, ed. J. Grotendorst, D. Marx, A. Muramatsu, John von Neumann Institiute for Computing (NIC), Juelich, Germany, 2002, vol. 10, pp. 269–298 Search PubMed.
- S. J. Grimme, J. Comput. Chem., 2006, 27, 1787 CrossRef CAS PubMed.
- R. Dovesi, V. R. Saunders, C. Roetti, R. Orlando, C. M. Zicovich-Wilson, F. Pascale, B. Civalleri, K. Doll, N. M. Harrison, I. J. Bush, Ph. D'Arco and M. Llunell, CRYSTAL09 User's Manual, University of Torino, Torino, 2009 Search PubMed.
- R. Dovesi, R. Orlando, B. Civalleri, C. Roetti, V. R. Saunders and C. M. Zicovich-Wilson, Z. Kristallogr., 2005, 220, 571 CrossRef CAS.
- J. P. Perdew, K. Burke and M. Ernzerhof, Phys. Rev. Lett., 1996, 77, 3865 CrossRef CAS.
- H. J. Monkhorst and J. D. Pack, Phys. Rev. B: Solid State, 1976, 13, 5188 CrossRef.
- M. F. Peintinger, D. Vilela Oliveira and T. Bredow, J. Comput. Chem., 2013, 34, 451 CrossRef CAS PubMed.
- CPMD, version 3.15.3; Copyright IBM Corp 1990-2008, Copyright MPI für Festkörperforschung Stuttgart 1997-2001; http://www.cpmd.org.
- G. J. Martyna, M. L. Klein and M. Tuckerman, J. Chem. Phys., 1992, 97, 2635 CrossRef PubMed.
- N. Troullier and J. L. Martins, Phys. Rev. B: Condens. Matter Mater. Phys., 1991, 43, 1993 CrossRef CAS.
- W. Humphrey, A. Dalke and K. Schulten, J. Mol. Graphics, 1996, 14, 33 CrossRef CAS.
- T. Williams and C. Kelley, Gnuplot 4.5 (patchlevel 5), 2014, http://gnuplot.info Search PubMed.
- A. Kohlmeyer and H. Forbert, traj2xyz.pl, version 1.4, 2004 Search PubMed.
- H. Forbert and A. Kohlmeyer, Fourier, version 2, 2002–2005 Search PubMed.
- P. Durlak and Z. Latajka, J. Mol. Model., 2011, 17, 2159 CrossRef CAS PubMed.
- P. Durlak and Z. Latajka, J. Chem. Theory Comput., 2013, 9, 65 CrossRef CAS.
- C. A. Morrison, M. M. Siddick, P. J. Capm and C. C. Wilson, J. Am. Chem. Soc., 2005, 127, 4042 CrossRef CAS PubMed.
- S. Pantano, F. Alber and P. J. Carloni, THEOCHEM, 2000, 530, 177 CrossRef CAS.
- C. C. Wilson, N. Shankland and A. J. Florence, Chem. Phys. Lett., 1996, 253, 103 CrossRef CAS.
- W. W. Cleland, Biochemistry, 1992, 31, 317 CrossRef CAS.
- R. N. Musin and Y. H. Marian, J. Phys. Org. Chem., 2006, 19, 425 CrossRef CAS.
- S. F. Tayyari, J. S. Emampour, M. Vakili, A. R. Nekoei, H. Eshghi, S. Salemi and M. Hassanpour, J. Mol. Struct., 2006, 794, 204 CrossRef CAS PubMed.
- NIST/EPA Gas-Phase Infrared Database JCAMP Format. http://webbook.nist.gov/cgi/cbook.cgi?ID=C93914&Mask=80#Refs.
- S. F. Tayyari and F. Milani-Nejad, Spectrochim. Acta, Part A, 2000, 56, 2679 CrossRef CAS.
- R. R. Lozada-Garcia, J. Ceponkus, W. Chin, M. Chevalier and C. Crépin, Chem. Phys. Lett., 2011, 504, 142 CrossRef CAS PubMed.
- Z. Yoshida, H. Ogoshi and T. Tokumitsu, Tetrahedron, 1970, 26, 5691 CrossRef CAS.
- S. F. Tayyari, T. Zeegers-Huyskens and J. L. Wood, Spectrochim. Acta, Part A, 1979, 35, 1265 CrossRef.
- Z. Latajka and L. Sobczyk, The Potential Energy Shape for the Proton Motion In Protonated Naphthalene Proton Sponges (DMAN-s) and its Manifestations, in Practical Aspects of Computational Chemistry. Methods, Concepts and Applications, ed. J. Leszczynski and M. K. Shukla, Springer, Heidelberg, Dordrecht, London, New York, 2010, pp. 371–386 Search PubMed.
Footnote |
| † Electronic supplementary information (ESI) available: Fig. 1S–3S present two-dimensional free-energy landscape of δ-parameter (reaction coordinate) RO3⋯O4, RO5⋯O6, and RO7⋯O8 distances, respectively, for crystal (I) and crystal (II). This material is available free of charge via the Internet. See DOI: 10.1039/c4cp02569e |
| This journal is © the Owner Societies 2014 |

