
 Open Access Article
 This Open Access Article is licensed under a Creative Commons Attribution-Non Commercial 3.0 Unported Licence
The effect of fluorine substitution in alcohol–amine complexes†
Anne S.
Hansen
,
Lin
Du
and
Henrik G.
Kjaergaard
*
Department of Chemistry, University of Copenhagen, Universitetsparken 5, DK-2100 Copenhagen, Denmark. E-mail: hgk@chem.ku.dk; Fax: +45-35320322; Tel: +45-35320334
First published on 9th September 2014
Abstract
The effect of fluorine substitution on the hydrogen bond strength in alcohol–amine molecular complexes was investigated, with a combination of vapour phase infrared spectroscopy and theoretical calculations. The complexes were combined from methanol (MeOH), ethanol (EtOH) and trifluoroethanol (TFE) as the hydrogen bond donor, and either dimethylamine (DMA) or trimethylamine (TMA) as the acceptor. The fundamental OH-stretching vibration involved in hydrogen bonding was measured for all complexes, as well as the weak second NH-stretching overtone for the DMA complexes. Equilibrium constants for complex formation were determined by combining a calculated intensity and the measured integrated absorbance. The observation of two transitions in the alcohol–DMA complexes provides an opportunity for two independent determinations of the equilibrium constants. Molecular interactions between the monomers were elucidated by Natural Bond Orbital, Atoms in Molecules and Non-covalent Interactions analysis. We find that the alcohol–amine complexes with TFE as the hydrogen bond donor form stronger hydrogen bonds and that secondary interactions between the monomers increase from MeOH to EtOH to TFE. TFE is a stronger acid than EtOH and MeOH making the OH bond weaker, and the OH-stretching frequency is redshifted in TFE relative to EtOH. This redshift is small in the monomers but significantly enhanced upon complexation.
Introduction
The importance of the hydrogen bond (XH⋯Y) has been recognised for decades.1,2 More recently, it has been found that hydrogen bound complexes of various kinds are important for the physics and chemistry of the atmosphere. Hydrated complexes impact radiative transfer in the atmosphere,3–5 and can affect reaction rates through water catalysis or lead to alternative reaction paths.6–8 In addition, it has been discovered that hydrogen bound complexes give rise to the formation of nanometer sized aerosol particles.9,10 These aerosol particles and their associated cloud formation represent one of the largest uncertainties in current climate models. Central to all of these issues is the atmospheric abundance of the hydrogen bound complexes.The abundance of a complex, which is given by the pressure of a complex (Pcomplex) is determined from the equilibrium constant (Keq) and the pressures of the two monomers, PA and PB, forming the complex:
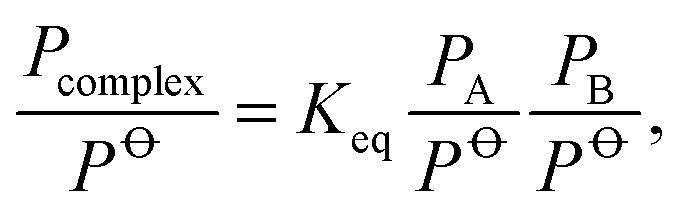 | (1) |
![[circle, cut, short horiz bar]](https://www.rsc.org/images/entities/char_e0eb.gif) is the standard pressure, 1 bar. At thermal equilibrium, the equilibrium constant is related to the Gibbs free energy (ΔG) by:
is the standard pressure, 1 bar. At thermal equilibrium, the equilibrium constant is related to the Gibbs free energy (ΔG) by: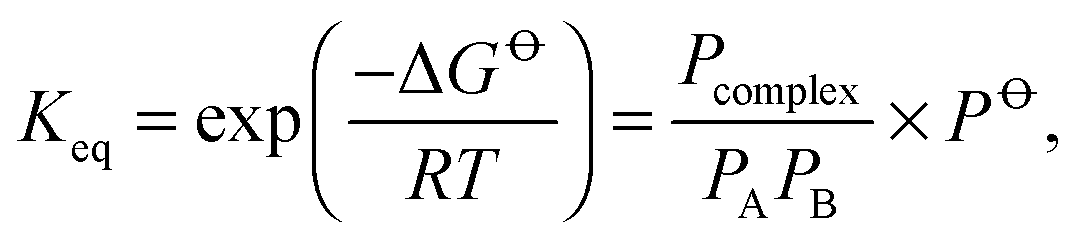 | (2) |
is calculated with ab initio methods, which is difficult and associated with large uncertainties as both ΔH and ΔS are required.
Gas phase vibrational spectroscopy is a good method for observing hydrogen bound complexes and characteristics related to hydrogen bonding can be observed.2 These typically include a measured redshift in the vibrational XH-stretching frequency, an intensity enhancement of the fundamental XH-stretching transition and a corresponding intensity decrease for the first overtone.2 However, occasionally a blueshift of the XH-stretching frequency is observed upon complexation.2,11 Both the frequency redshift and the intensity enhancement facilitate detection of even weakly bound complexes.12 Recent studies on weak hydrogen bound complexes have shown that IR spectroscopy combined with calculated vibrational intensities makes it possible to determine reasonable Keq or ΔG values,12–14 which are better than values obtained from ab initio calculations.15
Here, we investigate a series of alcohol–amine complexes:
 298K) for the formation of the complexes, was calculated with standard statistical mechanics in Gaussian 09,19,20 and from it, the equilibrium constant (Kcalceq), which was compared with our determined Keq. To elucidate the experimental evidence of changes in the hydrogen bond strength, Natural Bond Orbital (NBO), Atoms in Molecules (AIM)21,22 and Non-covalent Interactions (NCI)23 analysis were performed.
Experimental methods
TMA (anhydrous, 99%) and DMA (anhydrous, 99+%) were purchased from Aldrich and used without further purification. Methanol (Aldrich anhydrous, 99.8%), ethanol (Kemetyl anhydrous, 99.9%) and 2,2,2-trifluoroethanol (Aldrich anhydrous, 99.9%) were purified by freeze, pump and thaw cycles. The complexes were studied with a VERTEX 70 (Bruker) FTIR spectrometer using a 1 cm−1 resolution. A CaF2 beam splitter, MCT and InGaAs detectors were fitted to the spectrometer. To minimise the interference by H2O and CO2 vapours, the spectrometer was purged with dry nitrogen gas. Mixtures were prepared in a glass vacuum line with a base pressure of 1 × 10⁻⁴ Torr. Known pressures of the two components in the mixture were left to mix for half an hour to ensure that equilibrium was reached. Sample pressures were measured with a Varian diaphragm pressure gauge (1–1500 Torr, DV100) and a CCM instrument pressure gauge (0–10 Torr, LPC501) connected to the vacuum line. Measurements were performed at room temperature (298 K). A 10 cm path length gas cell, equipped with KBr windows was used to measure the fundamental transitions, and a 4.8 m multi-reflection White cell (Infrared Analysis, Inc) equipped with KCl windows and coated gold mirrors, was used to measure the overtone transitions. Spectral subtraction and analyses were performed with OPUS 6.5 and Origin 8.1 software. Spectra were deconvoluted with a number of Lorentzian bands and a straight baseline.Computational details
Initially, the geometries of the monomers and complexes were optimised in Gaussian 0919 with the B3LYP,24 wB97XD25 and M06-2X26 functionals and the aug-cc-pVTZ basis set, using the options “opt = verytight” and “integral = ultrafine”. Very similar geometries were obtained with these three DFT functionals. The largest difference was a 4 degree difference in the hydrogen bond angle for the TFE·TMA complex. The optimisation was followed by a harmonic frequency calculation with each functional to ensure that an energy minimum was found. Posteriori to the DFT27 optimisations, the counterpoise correction (CP)28,29 was calculated, to reduce the basis set superposition error (BSSE) in the calculations of the electronic energy of the complexes.The Gibbs free energy of formation was calculated, in Gaussian 09 using standard statistical mechanics,19,20 for the alcohol–amine complexes at 298.15 K (ΔG298K) and from it, a calculated equilibrium constant (Kcalceq) was obtained.
The vibrational frequencies and oscillator strengths of the OH- and NH-stretching vibrations in the complexes, were calculated with an anharmonic oscillator local mode model.16–18 We assume, that the OH- and NH-stretching vibrational modes can be described by an isolated Morse oscillator with the energy levels given by:30
 | (3) |
![[small omega, Greek, tilde]](https://www.rsc.org/images/entities/i_char_e10f.gif) and the anharmonicity x are determined using the 2nd, 3rd and 4th order derivatives of the potential energy surface.31 The derivatives are obtained from a 15-point DFT calculated potential energy grid. The energy potential is obtained by displacing the XH bond length by −0.30 Å to 0.40 Å in steps of 0.05 Å from the optimised bond length.
and the anharmonicity x are determined using the 2nd, 3rd and 4th order derivatives of the potential energy surface.31 The derivatives are obtained from a 15-point DFT calculated potential energy grid. The energy potential is obtained by displacing the XH bond length by −0.30 Å to 0.40 Å in steps of 0.05 Å from the optimised bond length.
The dimensionless oscillator strength, f, is given by:32
fv0 = 4.702 × 10⁻⁷ [cm D−2] ![[small nu, Greek, tilde]](https://www.rsc.org/images/entities/i_char_e0e1.gif) v0| v0|![[small mu, Greek, vector]](https://www.rsc.org/images/entities/i_char_e0e9.gif) v0|2, v0|2, | (4) |
v0 is the wavenumber of the vibrational transition from 0 → v in cm−1 and v0 = 〈v||0〉 is the transition dipole moment in Debye (D). The transition dipole moment can be expanded: | (5) |
i is the dipole moment expansion coefficients. The expansion coefficients are obtained by fitting a 6th order polynomial to a 15-point dipole moment grid in the same range as the potential energy. The local mode grids were calculated with all three DFT methods around their respective geometries.
The Natural Bond Orbital (NBO) analyses were performed in Gaussian 09 with the functionals B3LYP, wB97XD and M06-2X and the aug-cc-pVTZ basis set. The Atoms in Molecules (AIM)21,22 calculations were performed in AIM2000, and the Non-Covalent Interactions (NCI)23 calculations were carried out with NCIPLOT. The wavefunction files used for AIM and NCI were generated in Gaussian 09 with DFT/aug-cc-pVTZ methods.
Results and discussion
In Fig. 1, the lowest energy M06-2X/aug-cc-pVTZ optimised structures of the TFE–amine (TFE·DMA, TD1 and TFE·TMA, TT) and EtOH–amine (EtOH·DMA, ED1 and EtOH·TMA, ET1) complexes are shown. Additional conformers were found and are shown in Fig. S1 (ESI†) (TFE·DMA; TD2 and TD3, EtOH·DMA; ED2, ED3, ED4, and EtOH·TMA; ET2). For the TFE·DMA complex three conformers were found. In two of the conformers, TD1 and TD2, the OH bond in TFE is the hydrogen donor, and in the third conformer TD3 the NH bond in DMA is the hydrogen donor. For the TFE·TMA complex only one conformer was found, TT. For the EtOH·DMA complex four conformers were found. Two with the OH bond in EtOH as the hydrogen bond donor, where the EtOH unit is in either a gauche (ED1) or trans (ED2) conformation. Likewise, two conformers with the NH bond of DMA as the hydrogen donor where the EtOH unit is in either a gauche (ED3) or trans (ED4) conformation. For the EtOH·TMA complex two conformers were found, which have the EtOH unit in either a trans (ET1) or gauche (ET2) conformation. | ||
| Fig. 1 Optimised M06-2X/aug-cc-pVTZ structures of the TD1, TT, ED1 and ET1 conformers in the TFE–amine and EtOH–amine complexes. | ||
Calculations with the CCSD(T)-F12a33 method could not be performed on all complexes due to the size of the complexes. The M06-2X/aug-cc-pVTZ26 method has previously shown to calculate binding energies of hydrogen bound complexes, in good agreement with those obtained with higher level CCSD(T)-F12a calculations,12,13,34 and significantly better than the B3LYP/aug-cc-pVTZ energies. In Table 1, we compare the M06-2X/aug-cc-pVTZ calculated binding energies (BE) and structural parameters relevant for hydrogen bonding for the lowest energy conformers of the amine–alcohol complexes. Tables S1 and S2 (ESI†) present the calculated BE and structural parameters of additional conformers found. In Table S1 (ESI†), we also give the Gibbs free energies (ΔG298K) and equilibrium constants (Kcalceq) calculated with different DFT functionals for all conformers in the TFE–amine and EtOH–amine complexes. The EtOH–amine and MeOH–amine complexes have similar BE (ca. −28 kJ mol−1) whereas The TFE–amine complexes have more negative binding energies (ca. −40 kJ mol−1), and thus TFE forms stronger hydrogen bound complexes than EtOH and MeOH, which is also evident from the geometric parameters. However, little difference is found in the BE between DMA and TMA as the hydrogen bond acceptors. It is clear from Table 1 that the previously studied dimers (alcohol dimers and DMA dimer)35–41 have significantly lower BE than the corresponding alcohol–amine complexes and hence dimer formation will be limited and will not effect our experiment. We further reduce the effect of dimers in our experiment by subtracting monomer spectra recorded at pressures close to those used in the mixtures.
| Complex | BE | ΔROHa | R HB | θ HB |
|---|---|---|---|---|
| a Change in the OH bond length upon complexation, Rcomplex − RTFE/EtOH/MeOH. b The intermolecular hydrogen bond distance as shown in Fig. 1. c The intermolecular hydrogen bond angle as shown in Fig. 1. | ||||
| MeOH·DMA | −28.07 | 0.016 | 1.881 | 161.6 |
| EtOH·DMA | −28.01 | 0.015 | 1.899 | 169.3 |
| TFE·DMA | −41.69 | 0.030 | 1.767 | 171.3 |
| MeOH·TMA | −28.20 | 0.018 | 1.881 | 169.1 |
| EtOH·TMA | −29.24 | 0.016 | 1.901 | 165.6 |
| TFE·TMA | −42.97 | 0.031 | 1.752 | 175.0 |
| (MeOH)2 | −19.50 | 0.006 | 1.950 | 147.9 |
| (EtOH)2 | −23.05 | 0.007 | 1.918 | 161.1 |
| (TFE)2 | −24.69 | 0.007 | 1.907 | 150.6 |
| (DMA)2 | −16.90 | 0.005 | 2.172 | 148.9 |
Observed and calculated OH- and NH-stretching transitions
The TFE–amine, EtOH–amine and MeOH–amine complexes were investigated in the region 3000–10![[thin space (1/6-em)]](https://www.rsc.org/images/entities/char_2009.gif) 000 cm−1. We have observed the fundamental OH-stretching vibration in all complexes and the second overtone of the free NHf-stretching vibration in the alcohol–DMA complexes.
000 cm−1. We have observed the fundamental OH-stretching vibration in all complexes and the second overtone of the free NHf-stretching vibration in the alcohol–DMA complexes.
In Fig. 2 left, gas phase FTIR spectra of TFE, DMA and a mixture of the two gases are shown. In order to obtain a spectrum of the TFE·DMA complex, the monomer spectra of TFE and DMA were subtracted from the spectrum of the mixture. The monomer spectra are recorded at a different pressure relative to the pressure of each monomer in the mixtures. We use bands specific to each monomer to determine the monomer pressures in the mixture and thus provides an accurate subtraction. An accurate subtraction is found when after scaling and subtracting the monomer spectra a straight baseline is found in the region of monomer absorbance. An example is seen in Fig. 2 (right panel) where the OH-stretching band of TFE is observed in the spectra of both the monomer and the mixture, but completely subtracted in the spectrum of the complex. The scaling is expected to have minimal effect on the full width at half maximums (FWHM) and the integrated absorbance of the OH-stretching band in the complexes as it mainly affects bands lying outside the OH-stretching absorption in these complexes. Weak water lines appear in the spectra around 3600–3700 cm−1 and are difficult to subtract completely, but do not affect the complex spectra. The OH-stretching vibration in the TFE–amine complexes is clearly observed in the subtracted spectrum (red curve) around 3200 cm−1. Similarly, in the right panel spectra are shown for the TFE·TMA complex. In Fig. S2 and S3 (ESI†), spectra are shown for the other alcohol–amine complexes. To check the reproducibility of our work, and to confirm that binary complexes were observed, we recorded spectra of all the alcohol–amine complexes with different combinations of monomer pressure (Fig. S3–S5, ESI†).
 | ||
| Fig. 2 Left: spectra of 1.6 Torr TFE + 65 Torr DMA (black), 63 Torr DMA (blue) and 7 Torr TFE (green). A spectrum of the TFE·DMA complex is also shown (red), which was obtained by subtracting the blue and green spectra from the black spectrum. Right: spectra of 1.2 Torr TFE + 183 Torr TMA (black), 190 Torr TMA (blue) and 7.4 Torr TFE (green). A spectrum of the TFE·TMA complex is also shown (red), which was obtained by subtracting the blue and green spectra from the black spectrum. All spectra were recorded with a 10 cm path length cell, MIR light source, 500 scans and an MCT detector. | ||
In Fig. 3, spectra of the fundamental OH-stretching vibration in the six alcohol–amine complexes are compared. In Table 2, our observed wavenumbers, redshifts and FWHM of the OH-stretching transitions in the alcohol–amine complexes are summarised and compared with our calculated OH-stretching redshifts. Our observed fundamental OH-stretching wavenumbers agree with those previously observed for the alcohol–amine complexes.13,42–44 To determine the redshift of the OH-stretching vibration in the complexes relative to the alcohol monomers, spectra of the alcohols were recorded in the ΔvOH = 1–3 region, and these also agree with previously recorded spectra (Fig. 3 and Fig. S6, ESI†).45–47 We observe redshifts of 485 and 460 cm−1 for the fundamental OH-stretching vibration in the TFE·TMA and TFE·DMA complexes, respectively. For the EtOH–amine and MeOH–amine complexes, smaller redshifts of approximately 300–330 cm−1 were observed for the fundamental OH-stretching transition. These observed redshifts suggest that TFE forms stronger hydrogen bound complexes than EtOH and MeOH, which are comparable. The larger redshift of the OH-stretching vibration observed with TFE as a hydrogen bond donor relative to EtOH and MeOH, agrees with previous observations for other similar hydrogen bound complexes: TFE·H2O (Δ = 129 cm−1), EtOH·H2O (Δ = 23 cm−1),48 TFE·DME (Δ = 202 cm−1) and EtOH·DME (Δ = 110 cm−1).49 The OH-stretching frequency in the TFE–amine complex is 150 cm−1 lower relative to the OH-stretching frequency in the EtOH–amine complex. For the alcohol monomers we observe that the OH-stretching frequencies are close. The OH-stretching frequency in TFE is only approximately 20 cm−1 lower compared to OH-stretching frequency in EtOH, thus the substitution of fluorine is more significant for the complexes than for the alcohol monomers. From Fig. 3 it is also clear that a slightly larger redshift of the OH-stretching vibration is observed for the alcohol–TMA complexes than for the alcohol–DMA complexes. This agrees with TMA being a slightly better hydrogen bond acceptor, as expected from the additional electron donating methyl group in TMA. The FWHM of the OH-stretching vibrations in the TFE–amine complexes are approximately 200 cm−1 compared with smaller widths of only 80 cm−1 for the EtOH–amine and MeOH–amine complexes. This suggests a stronger hydrogen bond interaction in the TFE–amine complexes (Fig. S7 and S8 and Table S3, ESI†).
) and bandwidths (FWHM, Γ) in cm−1 for the different alcohol–amine complexes
| Complex | Observed | Calculated | Observed | Calculated | |||||
|---|---|---|---|---|---|---|---|---|---|
|
OH
|
ΔOHa |
Γ | ΔOHa,b |
ΔOHa,c |
NHf
|
ΔNHfa |
Γ | ΔNHfa,c |
|
|
a Δ = monomer − complex.
b Harmonic normal mode calculation.
c Anharmonic local mode calculation.
d Taken from ref. 13.
|
|||||||||
| MeOH·DMAd | 3387 | 301 | 77 | 376 | 468 | 9618 | 38 | 44 | 29 |
| EtOH·DMA | 3380 | 296 | 82 | 354 | 445 | 9615 | 41 | 41 | −3 |
| TFE·DMA | 3199 | 460 | 218 | 572 | 731 | 9614 | 42 | 38 | 21 |
| MeOH·TMAd | 3355 | 333 | 78 | 381 | 465 | — | — | — | — |
| EtOH·TMA | 3345 | 331 | 82 | 356 | 450 | — | — | — | — |
| TFE·TMA | 3174 | 485 | 204 | 570 | 739 | — | — | — | — |
 | ||
| Fig. 3 The OH-stretching vibration in the TFE–amine, EtOH–amine and MeOH–amine complexes compared with spectra of the fundamental OH-stretching transitions in TFE (3659 cm−1), EtOH (3676 cm−1) and MeOH (3688 cm−1). All spectra were recorded with a 10 cm path length cell, MIR light source, 500 scans and an MCT detector. | ||
Gas phase spectra of the alcohol–amine complexes in the 4500–6550 cm−1 region are presented in Fig. S9–S12 (ESI†). Very weak bands are observed around 6000 cm−1, which is where the second OH-stretching overtone transition should be found. However, based on calculations and previous observations of first overtone transitions, these transitions are extremely weak and not likely to be observed in our spectra of the alcohol–amine complexes.2,4,5,32,50
In Fig. 4, spectra of the alcohol–DMA complexes in the 9000–10000 cm−1 region are shown. We assign the strong transition at approximately 9615 cm−1 to the 3NHf second overtone transition of the free NH-stretching in the DMA unit, which is in reasonable agreement with the local mode calculated frequency (9653 cm−1). The corresponding fundamental transition was not observed since it is very weak compared to the OH-stretching and close to the NH-stretching in the DMA monomer.56 The first overtone of the NH-stretching transition could be observed, however, the second overtone transition is redshifted more relative to the NH-stretching vibration in the DMA monomer and appears more clearly. The much weaker band at approximately 9368 cm−1 is assigned to a hot band, which is a combination of low frequency methyl torsion and 3NHf.13Table 2 and Table S4 (ESI†) summarise the observed NHf-stretching frequencies.
 | ||
| Fig. 4 The 3NHf and combination bands of the complexes TFE·DMA, MeOH·DMA13 and EtOH·DMA. The spectra were recorded with a 4.8 m path length cell with NIR light source and an InGaAs detector. The black and red spectra were recorded with 2000 scans. The blue spectrum was recorded with 500 scans. | ||
The shift for the NHf-stretching transition is minimal between the three complexes, which indicates that the NH-bond is not involved in the interaction between the monomer units forming the complex. The shift in this second NHf-stretching overtone is ∼40 cm−1 corresponding to a change in the harmonic frequency of only ∼10 cm−1. In comparison, the OH bond involved in the hydrogen bond has a large redshift of approximately 300–460 cm−1 for the fundamental OH-stretching transition upon complexation. The small shift of the NHf-stretching transition is in fair agreement with the B3LYP local mode calculation that predicts a minimal shift of the NHf-stretching vibration upon complexation (Table 2 and Tables S9, S12 and S15, ESI†).
We have used a range of DFT methods in combination with the local mode model to calculate vibrational transition frequencies and intensities. We also calculated the harmonic frequencies with the B3LYP, wB97XD and M06-2X DFT methods at their respective optimised geometries. Of the three DFT methods the B3LYP/aug-cc-pVTZ calculated frequencies and intensities were found to be in best agreement with experimental frequencies and intensities of the monomers TFE and EtOH (Fig. 3 and Tables S8, S10 and S11, ESI†). The DFT/aug-cc-pVTZ calculated local mode parameters are given in Tables S5–S7 (ESI†), for all the optimised conformers of the alcohol–amine complexes and the corresponding monomers. The DFT calculated local mode parameters of the OH- and NH-stretching vibrations are close to the observed parameters for the monomers.13 In Tables S8–S15 (ESI†) the DFT/aug-cc-pVTZ calculated anharmonic frequencies and intensities are summarised for the monomers and corresponding alcohol–amine complexes. The calculated frequencies of the OH-stretching vibrations are underestimated and the NHf-stretching vibration is somewhat overestimated relative to the experimental observation. In Table S16 (ESI†), calculated harmonic normal mode OH-stretching frequencies and intensities are summarised for the TFE–amine and EtOH–amine complexes. The calculated harmonic oscillator OH-stretching frequencies are close to the harmonic frequencies of the OH-stretching local mode, suggesting that the local mode model is a reasonable approach. In Table 2, the B3LYP/aug-cc-pVTZ calculated redshifts are compared to the observed redshifts of the fundamental OH-stretching transition and the second overtone of the NHf-stretching transition. The shifts in the MeOH and EtOH complexes are similar, while larger redshifts are predicted and observed for the TFE–amine complexes. The frequency redshifts are about 30 cm−1 larger in the alcohol–TMA complexes relative to the alcohol–DMA complexes. In the weaker amine–amine complexes this difference was less than 10 cm−1.12
The determination of the experimental Keq relies on an accurate intensity. The results in Tables S8–S16 (ESI†) show that the calculated OH-stretching fundamental transition oscillator strengths are similar for all DFT methods used, and similar for the anharmonic local mode and harmonic normal mode models. We measured the experimental oscillator strength for the fundamental OH-stretching vibration in EtOH to be 2.5 × 10⁻⁶ (see Fig. S13, ESI†), which is similarly to the previously determined experimental oscillator strength of 3.1 × 10−6.45 There are two conformers of EtOH, which are difficult to observe in the spectra. Taking a 50%/50% average of the gauche and trans calculated M06-2X/aug-cc-pVTZ and B3LYP/aug-cc-pVTZ local mode intensities, oscillator strengths of 4.7 × 10⁻⁶ and 2.7 × 10⁻⁶ are obtained, respectively. The B3LYP result agrees best with the experimental determined oscillator strength. The calculated oscillator strengths for the different conformers are quite similar and thus the calculated oscillator strengths of the transition is insensitive to the relative abundance of the conformers. An significant increase in the fundamental OH-stretching intensities and a large decrease in the intensity of the first overtone are found as expected upon hydrogen bond formation.12,13,51
Equilibrium constant
Complexation is described by the following equilibrium:TFE + DMA ![[left over right harpoons]](https://www.rsc.org/images/entities/char_21cb.gif) TFE·DMA TFE·DMA | (6) |
The equilibrium constant of the complex (TFE·DMA) can be determined from the pressure of the complex (PTFE·DMA) and the product of the monomer pressures:
 | (7) |
is the standard pressure (1 bar = 0.99 atm). PTFE and PDMA are measured in our experiments and we determine the pressure of the complex using the following equation:13 | (8) |
)d the observed integrated absorbance, fcalc the calculated oscillator strength and l the optical path length. This method has shown to be successful when determining Keq.12,13,41,52,53 The pressure of the complex is small with a maximum value of less than 1 Torr for the stronger hydrogen bound TFE·DMA complex and could not be measured directly.
It is difficult to accurately determine the ∫A()d of the OH-stretching vibration in the EtOH–amine complexes, since the separation from the sidebands is small. The intensities of the sidebands are small compared to the intensity of the OH-stretching band, and part of their intensity is probably obtained by coupling to the strong fundamental OH-stretching transition. Thus the ∫A()d of the full band is used in eqn (8). Based on our calculated abundances (Tables S17–S19, ESI†), a 50%/50% average of the local mode B3LYP/aug-cc-pVTZ calculated oscillator strengths for the two conformers for each TFE·DMA, EtOH·DMA and EtOH·TMA complexes were used in eqn (8) to calculate the pressure. For the other complexes only one conformer was used.
In Fig. 5, we show a plot of the pressure of the TFE·DMA and EtOH·DMA complexes (Pcomplex) determined from eqn (8) as a function of the product of the monomer pressures (Palcohol × PDMA). Average fundamental OH-stretching oscillator strengths of 3.2 × 10⁻⁴ and 2.2 × 10⁻⁴ were used for the TFE·DMA and EtOH·DMA complexes, respectively. Multiplying the slope with the standard pressure leads to equilibrium constants of 3.6 and 0.11 for the TFE·DMA and EtOH·DMA complexes at 297 K, respectively. The same is done for the TFE·TMA and EtOH·TMA complexes (Fig. S14, ESI†), and equilibrium constants of 3.5 (297 K) and 0.14 (296 K) were obtained, respectively. Average fundamental OH-stretching oscillator strengths of 3.4 × 10⁻⁴ and 2.3 × 10⁻⁴ were used for the TFE·TMA and EtOH·TMA complexes, respectively. The determined Keq for the EtOH–amine complexes are similar to that previously determined for the MeOH·DMA complex, 0.11 at 300 ± 1 K, using the same approach.13 For the MeOH·TMA complex we find a Keq of 0.12 at 297 K (Fig. S3, ESI†).
 | ||
| Fig. 5 The pressure of the complex as a function of the multiplied pressure of the monomers. The slopes multiplied with the standard pressure yields equilibrium constants of 3.6 and 0.11 for the TFE·DMA (black triangles) and EtOH·DMA (red circles) complexes, respectively. Average B3LYP/aug-cc-pVTZ calculated oscillator strengths of 3.2 × 10⁻⁴ and 2.2 × 10⁻⁴, for the fundamental OH-stretching transitions, were used to determine Pcomplex for the TFE·DMA and EtOH·DMA complexes, respectively. | ||
The uncertainty of the determined Keq stems from the pressure measurement, determination of the integrated absorbance and most important the calculated intensities.13 The B3LYP/aug-cc-pVTZ local mode calculated OH-stretching intensities for the MeOH·DMA/TMA complexes are in very good agreement with previous CCSD(T)-F12a calculated intensities.13 For the water dimer ((H2O)2) it was found that the reduced dimensionality local mode calculated OH-stretching intensity (CCSD(T)/aug-cc-pVTZ) of the OH-stretching vibration involved in the hydrogen bonding was approximately a factor of 2 larger than the intensity calculated with a full dimensional VPT2 approach,50,54 which was in good agreement with the experimental value.55 We assume that the B3LYP calculated oscillator strengths for the TFE/EtOH–amine complex have uncertainties of approximately a factor of 2. The determined Keq are listed in Table 3. The TFE–amine Keq are approximately 30 times larger than the Keq determined for the MeOH–amine and EtOH–amine complexes. This clearly indicates that TFE forms stronger hydrogen bound complexes than EtOH and MeOH.
| Complex | K eq | K eq | σ*(OH):N | ρ | ∇2ρ |
|---|---|---|---|---|---|
| a K eq determined from the fundamental OH-stretching intensity. b K eq determined from the second overtone of the NHf-stretching intensity. c Result taken from ref. 13Keq calculated assuming only one conformer. | |||||
| MeOH·DMA | 0.11c | 0.19c | 12.86 | 0.037 | 0.077 |
| EtOH·DMA | 0.11 | 0.44 | 13.20 | 0.035 | 0.077 |
| TFE·DMA | 3.6 | 8.0 | 25.47 | 0.049 | 0.064 |
| MeOH·TMA | 0.12 | — | 12.34 | 0.038 | 0.072 |
| EtOH·TMA | 0.14 | — | 12.05 | 0.036 | 0.075 |
| TFE·TMA | 3.5 | — | 23.80 | 0.051 | 0.061 |
For the TFE·DMA and EtOH·DMA complexes we can also use the observed second overtone of the NHf-stretching vibration to determine the equilibrium constants (Fig. S15, ESI†). From this overtone transition, we obtain equilibrium constants of 8.0 and 0.44 at 298 K for the TFE·DMA and EtOH·DMA complexes, respectively. The NHf-stretching vibration is relative unaffected by the complexation and the uncertainties of its intensities relates to the uncertainty of calculated overtone intensities. The 3NH transition in DMA has been observed with an intensity of 1.77 × 10−8.56 The B3LYP/aug-cc-pVTZ calculated local mode NH-stretching intensity of 2.61 × 10⁻⁸ is about a factor of 1.5 higher than the observed intensity and we assume a similar error in the calculated intensities of the complexes.
For the TFE·DMA and EtOH·DMA complexes the determined Keq values, obtained from the two different transitions, are in reasonable agreement considering the mentioned uncertainties for the oscillator strengths. In comparison Kcalceq values determined from ΔG calculated with DFT or ab initio methods using the harmonic oscillator rigid rotor approach often lead to a variation in Kcalceq that can be up to several orders of magnitude (see Table S1, ESI†). The variation between our determined Keq values from the fundamental OH-stretching vibration and the second overtone of the NHf-stretching vibration, is significantly less than the variation in the ab initio calculated values of Keq or ΔG.
Hydrogen bond and secondary interactions
Natural Bond Orbital (NBO), Atoms in Molecules (AIM)21,22,57 and Non-covalent Interactions (NCI)23,57 are methods, which can characterise the strength of interactions between two units. The main results of the NBO, AIM and NCI analysis are summarised in Table 3. It is clear that MeOH and EtOH are very similar in all aspects of complex formation, as also seen in the similar OH-stretching frequency shifts and Keq values. The calculated NBO interaction between the antibonding orbital (σ*) of the OH bond and the lone pair on N is similar for the MeOH–amine and EtOH–amine complexes, and almost twice as large for the TFE–amine complexes. This explains the stronger hydrogen bond formed in the TFE–amine complexes, in agreement with the larger determined equilibrium constants and observed OH-stretching frequency shifts.Both AIM and NCI theories are based on the electron density, ρ. In AIM, the topological properties of ρ are correlated with elements of molecular structure (atoms and bonds). Since the ρ is at a maximum at the nuclei the localisation of the maxima enables the identification of atomic positions. As atomic positions are identified, chemical bonds are defined as saddle points (minima) between these maxima. These saddle points are known as bond critical points (BCP). Mathematically, this is defined as the second derivatives, λ1, λ2 and λ3, along the main axes of variation (eigenvalues). At a BCP λ1 and λ2 are positive and λ3 is negative. Ring critical points (RCP) can also appear, which are second order saddle points with λ1 negative whereas λ2 and λ3 are positive and signify ring strain. The AIM calculations show a (3, −1) bond critical point for the OH⋯N hydrogen bond in all complexes, where 3 is the number of eigenvalues different from zero and −1 is the sum of the sign of the eigenvalues. The calculated AIM electron density (ρ) at the bond critical point of the hydrogen bond, show similar density for the MeOH and EtOH complexes and a larger density for the TFE complexes. When the monomer size increase from MeOH to EtOH to TFE, a larger number of secondary interactions arise as seen in the appearance of additional bond critical points between the two units (Fig. S16–S18 and Tables S21 and S22, ESI†). Previously AIM calculations showed that for weak interactions ρ is smaller than for strong interactions, and for weak interactions the laplacian of the electron density (∇2ρ) is more positive than for strong interactions.58 For the hydrogen bond interaction in the TFE–amine complexes, larger ρ and smaller ∇2ρ are calculated, compared to those in the MeOH/EtOH–amine complexes. These also suggest that a stronger hydrogen bond is formed in the TFE–amine complexes.
In NCI, both the electron density (ρ) and its reduced gradient are used. Regions where ρ and the reduced electron density gradient are low corresponds to appearance of non-covalent interactions. The isosurfaces of the reduced electron density gradient can be used to visualise the non-covalent interactions in 3D. In NCI plots, values of the reduced electronic density gradient, the electron density and the eigenvalue λ2 determined at points in a grid around the molecule are plotted. In the presence of non-covalent interactions troughs are observed in the reduced electron density gradient and are characterised as BCP or RCP based on the sign of λ2. In Fig. 6, the NCI plots (reduced electronic density gradient versus the electron density oriented by the sign of the second eigenvalue λ2) and NCI isosurfaces for the B3LYP density of the TFE·TMA, EtOH·TMA and MeOH·TMA complexes are shown. For all three complexes troughs are observed around −0.04 a.u., illustrating the main hydrogen bond interaction in agreement with AIM. For the EtOH·TMA and MeOH·TMA complexes, the troughs are calculated slightly above −0.04 a.u. whereas for the TFE·TMA complex the trough due to the hydrogen bond interaction is below −0.04 a.u., which again indicates a stronger hydrogen bond interaction in the TFE·TMA complex. The hydrogen bond interaction is clearly seen in all NCI plots as the blue circular isosurface. For the EtOH·TMA and TFE·TMA complexes, secondary interactions are also observed as the two troughs close to zero (BCP and RCP), and also clearly seen as the green isosurface between monomer units. The slightly stronger secondary interaction in the TFE·TMA complex, compared to EtOH·TMA, is also seen in both the NCI plots and the isosurfaces. We suspect that the larger Keq values for the TFE–amine complexes arise from both the primary hydrogen bond interaction and from the larger number of secondary interactions.
 | ||
| Fig. 6 Top: the B3LYP/aug-cc-pVTZ normalised and reduced density gradient as a function of the sign(λ)ρ. Bottom: B3LYP/aug-cc-pVTZ NCI isosurfaces. The strong interactions between the OH⋯N are represented in blue and the weak secondary interactions in green. | ||
We also investigated the effect of calculating the hydrogen bond interaction using different DFT functionals, and find significant differences. B3LYP suggests smaller interaction as seen in both NBO, AIM, NCI and the calculated binding energies. Table S20 (ESI†), summarises the NBO interaction between the σ* orbital at the OH bond and the lone pair on N calculated with different DFT functionals. The NBO interactions calculated with the B3LYP method is smaller than the interactions calculated with the wB97XD and M06-2X methods. The smaller hydrogen bond interaction calculated with the B3LYP method also results in smaller calculated redshifts (Table S16, ESI†). In Fig. S16–S18 (ESI†), the calculated bond critical points for the alcohol–amine complexes with different DFT functionals are shown, and Tables S21 and S22 (ESI†), summarise ρ and ∇2ρ values for all bond critical points found for the alcohol–amine complexes with different DFT functionals. The B3LYP method yields fewer bond critical points than the wB97XD and M06-2X methods. This observation agrees with the smaller B3LYP interaction calculated from the binding energies and the NBO analysis. Fig. S19 (ESI†), illustrates the NCI plots for one conformer in the EtOH·TMA complex calculated with the three different DFT functionals. The troughs corresponding to the hydrogen bond interaction are virtually unaffected when the different functionals are used. However, changes in the troughs due to secondary interactions are observed when different functionals are used. The secondary interactions become more prevalent as we change from B3LYP to wB97XD or M06-2X, i.e. as the DFT functionals include more dispersion. In Fig. S20 (ESI†), NCI plots for the conformers ET1 and ET2 are compared. Because of the different orientations of the EtOH unit, secondary interactions are only observed for the ET1 conformer.
Conclusion
The fundamental OH-stretching and second NHf-stretching overtone transitions in a series of alcohol–amine complexes have been observed. The addition of a methyl group to MeOH has limited effect on the hydrogen bond interaction, similar to the effect of adding a methyl group to the DMA donor. However, adding a CF3 group has a large effect on the hydrogen bond interaction. This is based on our calculated binding energies, observed redshifts and determined equilibrium constants. Only small differences are observed in the OH-stretching frequencies of the monomers, with the TFE frequency redshifted approximately 20 cm−1 relative to the EtOH frequency. Redshifts of approximately 470 cm−1 and 300 cm−1 were observed for the OH-stretching transition of the TFE–amine complexes and the EtOH/MeOH–amine complexes, respectively, thus the substitution of fluorine is much more pronounced for the complexes than for the alcohol monomers. TFE is a stronger acid than EtOH, thus TFE has a smaller proton affinity.59,60 The OH bond in TFE is therefore weaker than the OH bond in EtOH, which gives rise to a stronger hydrogen bond in the TFE–amine complexes. So even though the CF3 group is substituted far from the OH bond forming the hydrogen bond, it significantly effects the hydrogen bond strength. NBO, NCI and AIM analysis confirm that a stronger hydrogen bond is formed in the TFE–amine complexes relative to the EtOH/MeOH–amine complexes, and secondary interactions increase from MeOH to EtOH to TFE.Acknowledgements
We thank Kasper Mackeprang and Sidsel Dahl Schrøder for helpful discussions. We acknowledge the financial support from The Danish Council for Independent Research – Natural Sciences and the Danish Center for Scientific Computing.References
- G. C. Pimentel and A. L. McClellan, The Hydrogen Bond, W. H. Freeman, 1960 Search PubMed.
- E. Arunan, G. R. Desiraju, R. A. Klein, J. Sadlej, S. Scheiner, I. Alkorta, D. C. Clary, R. H. Crabtree, J. J. Dannenberg, P. Hobza, H. G. Kjaergaard, A. C. Legon, B. Mennucci and D. J. Nesbitt, Pure Appl. Chem., 2011, 83, 1619–1636 CAS.
- V. Vaida, H. G. Kjaergaard and K. J. Feieraband, Int. Rev. Phys. Chem., 2003, 22, 203–219 CrossRef CAS.
- V. Vaida, J. S. Daniel, H. G. Kjaergaard, L. M. Goss and A. F. Tuck, Q. J. R. Meteorol. Soc., 2001, 127, 1627–1643 CrossRef.
- I. V. Ptashnik, K. M. Smith, K. P. Shine and D. A. Newnham, Q. J. R. Meteorol. Soc., 2004, 130, 2391–2408 CrossRef.
- W. Klemperer and V. Vaida, Proc. Natl. Acad. Sci. U. S. A., 2006, 103, 10584–10588 CrossRef CAS PubMed.
- S. Aloisio and J. S. Francisco, Acc. Chem. Res., 2000, 33, 825–830 CrossRef CAS PubMed.
- S. Jørgensen and H. G. Kjaergaard, J. Phys. Chem. A, 2010, 114, 4857–4863 CrossRef PubMed.
- J. Kirkby, et al. , Nature, 2011, 476, 429–433 CrossRef CAS PubMed.
- M. Kulmala, et al. , Science, 2013, 339, 943–946 CrossRef CAS PubMed.
- P. Hobza and Z. Havlas, Chem. Rev., 2000, 100, 4253–4264 CrossRef CAS PubMed.
- L. Du, J. R. Lane and H. G. Kjaergaard, J. Chem. Phys., 2012, 136, 184305 CrossRef PubMed.
- L. Du, K. Mackeprang and H. G. Kjaergaard, Phys. Chem. Chem. Phys., 2013, 15, 10194–10206 RSC.
- N. Bork, L. Du and H. G. Kjaergaard, J. Phys. Chem. A, 2014, 118, 1384–1389 CrossRef CAS PubMed.
- J. Elm, M. Bilde and K. V. Mikkelsen, J. Chem. Theory Comput., 2012, 8, 2071–2077 CrossRef CAS.
- B. R. Henry, Acc. Chem. Res., 1977, 10, 207–213 CrossRef CAS.
- B. R. Henry, Acc. Chem. Res., 1987, 20, 429–435 CrossRef CAS.
- B. R. Henry and H. G. Kjaergaard, Can. J. Chem., 2002, 80, 1635–1642 CrossRef CAS.
- M. J. Frisch, et al., Gaussian 09, Revision B.01, Gaussian, Inc., 2009 Search PubMed.
- V. Vaida and J. E. Headrick, J. Phys. Chem. A, 2000, 104, 5401–5412 CrossRef CAS.
- W. Kutzelnigg, Angew. Chem., 1992, 104, 1423 CrossRef.
- F. Biegler-König, J. Schönbohm and D. Bayles, J. Comput. Chem., 2001, 22, 545–559 CrossRef.
- J. Contreras-García, E. R. Johnson, S. Keinan, R. Chaudret, J. P. Piquemal, D. N. Beratan and W. Yang, J. Chem. Theory Comput., 2011, 7, 625–632 CrossRef PubMed.
- A. D. Becke, J. Chem. Phys., 1993, 98, 5648–5652 CrossRef CAS PubMed.
- J. D. Chai and M. H. Gordon, Phys. Chem. Chem. Phys., 2008, 10, 6615–6620 RSC.
- Y. Zhao and D. G. Truhlar, Theor. Chem. Acc., 2008, 120, 215–241 CrossRef CAS.
- W. Kohn and L. J. Sham, Phys. Rev. A: At., Mol., Opt. Phys., 1965, 140, 1133–1138 Search PubMed.
- S. Boys and F. Bernardi, Mol. Phys., 1970, 19, 553–566 CrossRef CAS.
- F. B. van Duijneveldt, J.G.C.M. van Duijneveldt-van de Rijdt and J. H. van Lenthe, Chem. Rev., 1994, 94, 1873–1885 CrossRef CAS.
- P. Atkins, J. de Paula and R. Friedman, Quanta, Matter and Change. A Molecular Approach to Physical Chemistry, Oxford, 2009, p. 4, 62, 317, 339–340 Search PubMed.
- D. L. Howard, P. Jørgensen and H. G. Kjaergaard, J. Am. Chem. Soc., 2005, 127, 17096–17103 CrossRef CAS PubMed.
- D. P. Schofield, J. R. Lane and H. G. Kjaergaard, J. Phys. Chem. A, 2007, 111, 567–572 CrossRef CAS PubMed.
- D. P. Tew, W. Klopper, C. Neiss and C. Hattig, Phys. Chem. Chem. Phys., 2007, 9, 1921–1930 RSC.
- J. R. Lane and H. G. Kjaergaard, J. Chem. Phys., 2009, 131, 034307 CrossRef PubMed.
- L. A. Curtiss, D. J. Frurip and M. Blander, J. Am. Chem. Soc., 1978, 100, 79–86 CrossRef CAS.
- T. Scharge, C. Cezard, P. Zielke, A. Schutz, C. Emmeluth and M. A. Suhm, Phys. Chem. Chem. Phys., 2007, 9, 4472–4490 RSC.
- T. Scharge, T. Haber and M. A. Suhm, Phys. Chem. Chem. Phys., 2006, 8, 4664–4667 RSC.
- T. N. Wassermann and M. A. Suhm, J. Phys. Chem. A, 2010, 114, 8223–8233 CrossRef CAS PubMed.
- H. L. Han, C. Camacho, H. A. Witek and Y. P. Lee, J. Chem. Phys., 2011, 134, 144309 CrossRef PubMed.
- V. Mitev, B. Stefanov, L. Ivanov and G. Georgiev, J. Mol. Struct., 1985, 129, 11–15 CrossRef CAS.
- L. Du and H. G. Kjaergaard, J. Phys. Chem. A, 2011, 115, 12097–12104 CrossRef CAS PubMed.
- D. J. Millen and J. Zabicky, J. Chem. Soc., 1965, 3080–3085 RSC.
- M. A. Hussein and D. J. Millen, J. Chem. Soc., Faraday Trans. 2, 1974, 70, 685–692 RSC.
- D. L. Howard and H. G. Kjaergaard, J. Phys. Chem. A, 2006, 110, 9507–9601 Search PubMed.
- K. R. Lange, N. P. Wells, K. S. Plegge and J. A. Phillips, J. Phys. Chem. A, 2001, 105, 3481–3486 CrossRef CAS.
- H. L. Fang and D. A. C. Compton, J. Phys. Chem., 1988, 92, 6518–6527 CrossRef CAS.
- H. L. Fang and R. L. Swofford, Chem. Phys. Lett., 1984, 105, 5–11 CrossRef CAS.
- M. Heger, T. Scharge and M. A. Suhm, Phys. Chem. Chem. Phys., 2013, 15, 16065–16073 RSC.
- O. Schrems, H. M. Oberhoffer and W. A. P. Luck, J. Phys. Chem., 1984, 88, 4335–4342 CrossRef CAS.
- H. G. Kjaergaard, A. L. Garden, G. M. Chaban, R. B. Gerber, D. A. Matthews and J. F. Stanton, J. Phys. Chem. A, 2008, 112, 4324–4335 CrossRef CAS PubMed.
- S. B. Hendricks, O. R. Wulf, G. E. Hilbert and U. Liddel, J. Am. Chem. Soc., 1936, 58, 1991–1996 CrossRef CAS.
- S. Chung and M. Hippler, J. Chem. Phys., 2006, 124, 214316 CrossRef PubMed.
- M. Hippler, J. Chem. Phys., 2007, 127, 084306 CrossRef PubMed.
- K. Mackeprang, H. G. Kjaergaard, T. Salmi, V. Hänninen and L. Halonen, J. Chem. Phys., 2014, 140, 184309 CrossRef PubMed.
- K. Kuyanov-Prozument, M. Y. Choi and A. F. Vilesov, J. Chem. Phys., 2010, 132, 014304 CrossRef PubMed.
- B. J. Miller, L. Du, T. J. Steel, A. J. Paul, A. H. Södergren, J. R. Lane, B. R. Henry and H. G. Kjaergaard, J. Phys. Chem. A, 2012, 116, 290–296 CrossRef CAS PubMed.
- J. R. Lane, J. Contreras-García, J. P. Piquemal, B. J. Miller and H. G. Kjaergaard, J. Chem. Theory Comput., 2013, 9, 3263–3266 CrossRef CAS.
- W. Nakanishi, S. Hayashi and K. Narahara, J. Phys. Chem. A, 2008, 112, 13593–13599 CrossRef CAS PubMed.
- E. P. L. Hunter and S. G. Lias, J. Phys. Chem. Ref. Data, 1998, 27, 413–656 CrossRef CAS PubMed.
- L. H. Mukherjee and E. Grunwald, J. Phys. Chem., 1958, 62, 1311–1314 CrossRef CAS.
Footnote |
| † Electronic supplementary information (ESI) available: DFT calculated energies and geometric parameters; illustrations of peak fitting; observed NHf-stretching vibrations; observed ΔvOH = 1–3 OH-stretching vibrations in EtOH; spectra of the fundamental OH-stretching vibration in the EtOH–amine complexes at different monomer pressures; plots indicating binary complexes for EtOH·TMA and EtOH·DMA; spectra before spectral subtraction; calculated local mode parameters; local and normal mode calculated OH- and NH-stretching frequencies; plot illustrating determination of the fundamental OH-stretching intensity in EtOH; plots for determining Keq for the complexes EtOH·TMA and EtOH·DMA. See DOI: 10.1039/c4cp02500h |
| This journal is © the Owner Societies 2014 |