 Open Access Article
Creative Commons Attribution 3.0 Unported Licence
Convective dynamics of traveling autocatalytic fronts in a modulated gravity field
Dezső
Horváth
*ab,
Marcello A.
Budroni
*cd,
Péter
Bába
a,
Laurence
Rongy
c,
Anne
De Wit
c,
Kerstin
Eckert
e,
Marcus J. B.
Hauser
f and
Ágota
Tóth
a
aDepartment of Physical Chemistry and Materials Science, University of Szeged, Rerrich Béla tér 1., Szeged, H-6720, Hungary. E-mail: horvathd@chem.u-szeged.hu; Fax: +36-62-546-482; Tel: +36-62-544-614
bDepartment of Applied and Environmental Chemistry, University of Szeged, Rerrich Béla tér 1., Szeged, H-6720, Hungary
cNonlinear Physical Chemistry Unit, CP 231, Faculté des Sciences, Université libre de Bruxelles (ULB), 1050 Brussels, Belgium
dDepartment of Chemistry and Pharmacy, University of Sassari, 07100, Sassari, Italy
eInstitute of Fluid Mechanics, Technische Universität Dresden, D-01062 Dresden, Germany
fBiophysics Group, Otto-von-Guericke-Universität Magdeburg, D-39106 Magdeburg, Germany
First published on 21st October 2014
Abstract
When traveling in thin solution layers, autocatalytic chemical fronts may be deformed and accelerated by convective currents that develop because of density and surface tension gradients related to concentration and thermal gradients across the front. On earth, both buoyancy and Marangoni related flows can act in solution layers open to the air while only buoyancy effects operate in covered liquid layers. The respective effects of density and surface tension induced convective motions are analysed here by studying experimentally the propagation of autocatalytic fronts in uncovered and covered liquid layers during parabolic flights in which the gravity field is modulated periodically. We find that the velocity and deformation of the front are increased during hyper-gravity phases and reduced in the micro-gravity phase. The experimental results compare well with numerical simulations of the evolution of the concentration of the autocatalytic product coupled to the flow field dynamics described by Navier–Stokes equations.
1 Introduction
Autocatalytic fronts resulting from the interplay between diffusion and an autocatalytic reaction are well-known examples of out-of-equilibrium self-organization. They usually propagate with a constant shape and at a constant speed in gels.1–3 However, if the reaction takes place in a solution, the gradients of concentrations and temperature across the front can result in a modification of the physical parameters of the fluid, such as density or surface tension. These changes can trigger natural convection, which has long been experimentally evidenced to, in turn, deform autocatalytic fronts and accelerate their propagation.4–20In vertically-oriented closed systems where the reactor is entirely filled with the reacting solution and the front travels parallel to the gravity field, convective flows can be induced by density differences only. The resulting density fingering of the front has been well characterized both experimentally and theoretically.21–29 If the front propagates in a horizontal solution layer open to the air, the situation is, however, more complex since both Marangoni (surface tension-driven) and buoyancy (density-driven) effects can come into play. To try to clarify this situation, numerous theoretical works have been devoted to the study of chemically-driven flows around horizontally propagating fronts and to the effect the flow has on the shape and speed of these fronts. These theoretical studies can be classified depending on the type of flow considered: buoyancy-driven,12,30–39 Marangoni-driven,40–47 or a combination of both flows.12,19,48,49
In the case of pure buoyancy-driven flows, a good agreement exists between numerical simulations and experiments in closed reactors, both for isothermal31,35,38,39 and exothermic fronts.37,38,50 On the other hand, such a comparison is not available yet in the case of pure surface tension-driven flows because of the difficulty to isolate Marangoni effects from gravity effects on earth. In this context, studies under micro-gravity conditions are crucial to understand the role of both types of convective flows in the front dynamics. They have already proven very helpful in explaining the dynamics of A + B → C reactions in immiscible two-layer systems.51,52 A combination of parabolic flight experiments and numerical simulations of modulated gravitational acceleration has recently allowed to highlight the role of buoyancy-driven vortices in the behavior of A + B → C fronts.53 In the case of chemical waves, the effect of density gradients across fronts of the Belousov–Zhabotinsky reaction were shown to die out under micro-gravity conditions in drop towers.54,55
In the present paper, we study the dynamics of autocatalytic fronts of the iodate–arsenous acid (IAA) reaction in horizontal solution layers with a combination of experiments in parabolic flights and numerical simulations. The IAA reaction possesses rich dynamic behaviors and can give rise to traveling conversion fronts when coupled to diffusion in spatially extended systems.1,2 This autocatalytic reaction can be described quantitatively by a one-variable cubic kinetics in some concentration ranges of the reactants. The reaction can be treated as isothermal as Martin et al.50 could not detect any heat pulse around traveling IAA fronts using a quantitative IR measurement technique with a 10 mK resolution. They have further computed density variations due to either solutal or thermal effects and concluded that the latter ones are negligible so that the dynamics of IAA fronts are unaffected by temperature effects.
In a recent paper, we have theoretically investigated the combined effect of solutal Marangoni and buoyancy-driven flows on the horizontal propagation of such an isothermal front.49 Aiming at a general classification, we have considered both the cases when surface and bulk forces act cooperatively to deform a chemical front and when they have an antagonistic contribution to the flow direction. In the cooperative case, asymptotic regimes are found where the deformed front propagates at a constant speed and with a steady shape, whereas in the antagonistic case, both steady and oscillatory regimes can be observed. Here, our goal is to provide a detailed comparison between experiments and simulations in the specific case of IAA fronts (cooperative regime) propagating in modulated gravity. By comparing measurements in closed cells with the ones obtained in open cells, we aim to discriminate between surface tension-driven and density-driven flows.
We first describe the chemical system and introduce the experimental setup and the theoretical Reaction–Diffusion–Convection (RDC) model we have used. Next, we present the results of the parabolic flights in both cases of a closed reactor and of a reactor open to air. A comparison between the front behavior observed in both systems confirms the relative importance of buoyancy and Marangoni effects on the dynamics. The numerical simulations are in excellent agreement with the experimental behavior and make clear the underlying changes in the structure of the flow field. We conclude the article by a comparison between the different cases and between the experiments and numerical simulations.
2 Chemical system and experimental setup
The iodate–arsenous acid reaction is a model reaction of cubic autocatalysis with iodide and hydrogen ions being the autocatalysts. Two main reactions describe the mechanism.4,5 The first step is the Dushman reaction, where iodate and iodide ions react under acidic condition:| IO3−+5I− + 6H+ → 3I2 + 3H2O. | (1) |
The second step is the Roebuck reaction, in which arsenous acid is oxidized by iodine:
| H3AsO3 + I2 + H2O ⇌ 2I− + H2AsO4− + 3H+. | (2) |
The net reaction depends on the ratio of the initial reactant concentrations R = [H3AsO3]0/[KIO3]0.
For R > 3, iodide ion is the product, according to
| IO3− + 3H3AsO3 → I− + 3H2AsO4− + 3H+ | (3) |
| 2IO3− + 5H3AsO3 → I2 + 5H2AsO4− + H2O + 3H+. | (4) |
At R = 8/3, the formation of triiodide ion is at maximum considering the I2 + I− ⇌ I3− equilibrium, leading to
| 3IO3− + 8H3AsO3 → I3− + 8H2AsO4− + H2O + 6H+. | (5) |
In the reaction, iodine is surface active and decreases the surface tension of the solution behind the reaction front. Since iodine is also a volatile species, its evaporation might affect the distortion of the front at the liquid–gas interface. The ratio between the initial concentrations of arsenous acid and potassium iodate (R = 2.8) has been selected to avoid interference from the evaporation of iodine into the gas phase.16,20 For these initial concentrations, the product solution is a mixture of iodine and iodide, which has a lower surface tension and density than the reactant solution.
Reagent-grade chemicals (Sigma-Aldrich, Spektrum-3D, Reanal) were used throughout the work. Potassium iodate was dissolved in deionized water to obtain a 25.8 mM solution. Arsenous acid solution of 72.2 mM was prepared by dissolving sodium arsenite and adding sulfuric acid dropwise to set the pH of the final solution to 7.
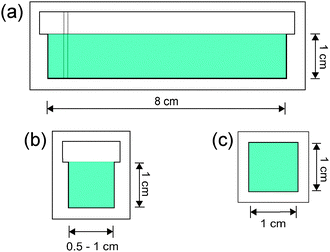
Two different reaction chambers made of quartz were used in the experiments. In one, termed open cell, the liquid was only filled up to an inner rim creating a horizontal flat liquid–air interface as shown in Fig. 1(a) and (b). In the other, termed closed cell, the liquid entirely filled the space creating a square block (see Fig. 1(c)). The reactants were premixed in 1![[thin space (1/6-em)]](https://www.rsc.org/images/entities/char_2009.gif) :
:![[thin space (1/6-em)]](https://www.rsc.org/images/entities/char_2009.gif) 1 ratio as they were injected into the cells from below through four equally spaced bores by means of a double syringe pump (Harvard apparatus) so the concentration of potassium iodate was 12.9 mM and that of arsenous acid was 36.1 mM.
1 ratio as they were injected into the cells from below through four equally spaced bores by means of a double syringe pump (Harvard apparatus) so the concentration of potassium iodate was 12.9 mM and that of arsenous acid was 36.1 mM.
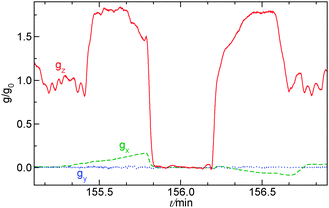
During the parabolic flight campaign there were six parabola sequences, each containing five parabolas. Within a single parabola two hyper-g phases sandwiched the micro-gravity phase, where the gravitational acceleration was 1% of its normal value on ground, as shown in Fig. 2. For open cells the filling was generally performed during the 0-g phase of the first parabola within each sequence, while for closed cells it was carried out before the parabolas. The reaction was initiated in the subsequent 0-g phase by a short electrolysis at a pair of horizontally or vertically oriented platinum wires with a 2.5–7.0 V electrical potential difference between them. The reaction fronts were followed thanks to the color change in the solution when the species I3− forms and were monitored with a CCD camera attached to a computer. The stored images were later analyzed with in-house software, where the velocity of propagation was determined for the tip of the reaction during the various phases of gravity. For closed cells the modulation of the front shape upon the variation of gravity was observed, since the upper solid–liquid interface was unaffected by the transverse x- and y-components of the gravitational acceleration present in each parabola (see Fig. 2).
3 Theoretical model and parameters
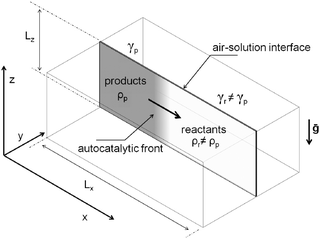
To model the propagation of the chemical front in the presence of convection, we consider a two-dimensional slab of length Lx and height Lz in a (x, z) reference frame. As sketched in Fig. 3, this represents a vertical cut in a 3-dimensional rectangular reactor, where the z axis is oriented against the gravitational acceleration g = (0, −g) and the chemical front propagates horizontally in the x direction.In a previous paper,38 we discussed that a reduction of the 3-dimensional problem to its 2-dimensional section can be applied without any loss of information. We consider the system as isothermal since the reaction is only slightly exothermic21 and heat dissipates much faster than mass, and can thus be neglected.31,56 In our simulations, as in the parabolic flight experiments, we consider both the case of a closed reactor and the case where the vertical slab is open to the air on the top boundary (see analogous experimental setup in ref. 18). The solution of the autocatalytic product, characterized by a density ρp and a surface tension γp, propagates towards positive x (from left to right here) invading the fresh reactant solution with density ρr and surface tension γr.
The dynamics of the traveling front obey a set of partial differential equations obtained by coupling the incompressible Navier–Stokes equations for the flow velocity v to a Reaction–Diffusion–Convection (RDC) equation for c, the concentration of the autocatalytic species:
| ∂tc + (v·∇)c = D∇2c + f(c), | (6) |
 | (7) |
| ∇·v = 0, | (8) |
We apply no-flux boundary conditions for the concentration at the four boundaries and no-slip conditions for the velocity field at solid boundaries. To include the shear force at the free surface caused by surface tension gradients when the reactor is open, we use a Marangoni boundary condition for the horizontal component of the fluid velocity:
 | (9) |
The equation system can be written in a dimensionless form by using the time scale of the chemical process t0 = 1/(ka02) and the reaction–diffusion characteristic length  . Typically, for the IAA reaction,1,5 the kinetic rate constant k = 2 × 10⁴ M−2 s−1 and D ∼ 2 × 10⁻⁵ cm2 s−1.2,21 Here the initial concentration of iodate is a0 = 12.9 mM, leading to t0 ∼ 0.3 s and L0 ∼ 0.002 cm. Velocity, pressure and concentration scales are
  ,
,  and a0, respectively. By introducing the vorticity as ω = ∇ × v and the streamfunction, ψ, through the relations u = ∂zψ and v = − ∂xψ, the dimensionless form of our equations reads
 | (10) |
 | (11) |
 | (12) |
We set the Schmidt number, Sc = ν/D = 445 since we refer to dynamics in aqueous solutions with the water kinematic viscosity ν = 0.0089 cm2 s−1. The solutal Rayleigh number Ra is defined as
 | (13) |
 is the solutal expansion coefficient of the density that we assume to depend linearly on the concentration of the autocatalytic product.
  (Ra > 0) if products are less dense than the non-reacted medium, such as in the IAA reaction. According to the experimental data reported in the literature,21 we set Ra = 0.2.
In (ω-ψ) form, the Marangoni boundary condition reads
 | (14) |
 | (15) |
When, like in our case,  (Ma > 0), the product solution has a lower surface tension than the reactants and the front experiences a surface force along the propagation direction. According to this definition, the order of magnitude of Ma for our system should be 104. Although, due to numerical instabilities, we cannot achieve this order of magnitude, in Section 4.3 we show how a numerical study with lower values of this parameter (we use Ma = 10) can be instructive to infer reliable characteristics of the experimental system and to extrapolate dynamical properties of the front in the domain of high Ma.
The system of eqn (10)–(12) is solved by using the Alternating Direction Implicit Method (ADI) proposed by Peaceman and Rachford.58 We consider a spatial domain of dimensionless length Lx = 500 and height Lz = 100 discretized over a grid of 1000 × 400 points. RDC-equations are integrated by using the space step hx = 0.5. A logistic-type function c(x, z, t) = 1/(1 + exp(x − x0)), with the front tip located at x0 = 60 space units along the horizontal dimension x, is set as the starting spatial distribution of the autocatalytic species c(x, z, t) to initiate the front propagation. This is the general solution to the pure reaction–diffusion problem associated with a cubic autocatalysis, characterized by a constant shape and a front width wRD = 13.1,5 Calculations are run for 55 time units (110 s), using the integration time step ht = 1 × 10⁻³. In order to simulate the time-dependent gravity changes during the parabolic flight, the gravitational term embedded in Ra (see eqn (13)) is modulated in analogy to the profile gz/g0 shown in Fig. 2. This step function features the normalized magnitude of the gravitational acceleration g/g0 (where g0 = 9.81 m s−2) and approximates one parabola of the real parabolic flight traced in gray: two 22-seconds-phases of hyper-gravity (where g/g0 = 2) separated by a 22-seconds low-gravity phase (with g/g0 → 0).
4 Results and discussion
4.1 Experimental results
In the iodate–arsenous acid reaction the product solution is less dense than fresh reactants, i.e. the net density change is negative. Therefore in the presence of gravity for a reaction front propagating horizontally in a closed cell, the product solution tends to advance on the top of the denser reactant solution giving rise to a single convection roll. With a forward fluid flow on the top and a reverse fluid flow on the bottom, the originally vertical reaction front becomes tilted as shown in Fig. 4. As a result of the local mixing, the front takes on a velocity of propagation greater than that for a pure reaction–diffusion system.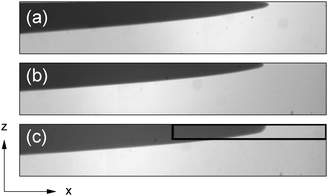 | ||
| Fig. 4 Images of the reaction front in a closed reactor at gz/g0 = 1.0 (a), 1.7 (b) and 0.01 (c). The black rectangle in (c) is the window where the front evolution of the tip was monitored to construct Fig. 5. Field of view: 5.8 cm × 1.0 cm. | ||
The effect of the variation in the gravitational acceleration is visible in the deformation of the tip of the reaction front. The front positions determined for a sequence of images are shown in Fig. 5 for a closed cell during a single parabola. The advance in the upper layer abruptly stops as the airplane enters the micro-g phase, where convection ceases to exist. Diffusion remains the sole transport process leading to the decrease in the velocity of propagation. For a thin reaction–diffusion front the velocity of propagation v depends on the curvature2 according to
| v = v0 + Dκ, | (16) |
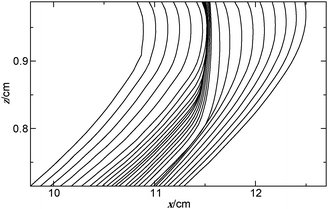 | ||
| Fig. 5 Spatio-temporal evolution of front profiles with Δt = 2 s for a reaction front propagating from left to right in a closed cell within the black window shown in Fig. 4(c) as the plane enters the micro-g phase from the hyper-g phase and back again. | ||
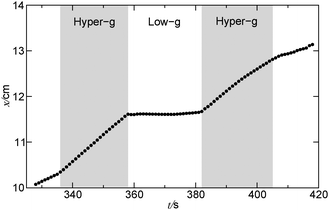 | ||
| Fig. 6 Position of the tip of the reaction front in a single parabola in a closed reactor. The relative gravity is shown in the acceleration profile in Fig. 2. | ||
For an open cell similar convective patterns arise in the normal-g and hyper-g phases of the flight, the less dense reactant solution tends to advance on the top tilting the reaction front. Entering the micro-g phase however, the convective motion does not stop entirely. The propagation at the top is faster than that for the pure reaction–diffusion fronts of the closed cell. At the reaction front a concentration gradient of the surface active iodine builds up which leads to a surface force resulting in a forward fluid flow invariant to the changes in the gravitational acceleration. It acts in the same direction as the tilting due to the gravity, therefore its effect is only apparent in the micro-g phase as shown by the velocity of propagation as a function of g in Fig. 7.
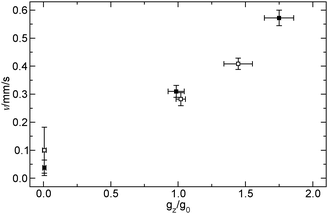 | ||
| Fig. 7 Velocity of the front propagation as a function of the acceleration of gravity for closed cells (filled squares) and for open cells (open squares). | ||
4.2 Numerical simulations
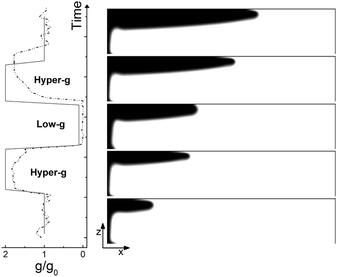
The typical numerical spatio-temporal patterns driven by the RDC-coupling under modulated gravitational field are shown in Fig. 8–10. Here we illustrate snapshots of the concentration map of the autocatalytic species during successive phases of the parabolic flight: pure buoyancy (Fig. 8, analogous of experiments in closed cells), pure Marangoni (Fig. 9, analogous of experiments carried out in the absence of gravity in open cells) and combined buoyancy and Marangoni (Fig. 10, which are comparable with experiments performed in open cells on earth) contributions to the hydrodynamic motions which modify the RD-travelling interface between the reacted solution on the left (in black) and the non-reacted substrate on the right (in white).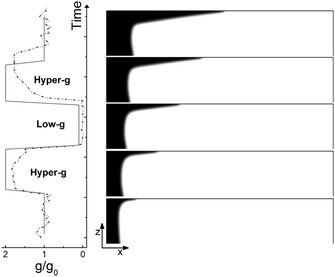 | ||
| Fig. 9 Same as in Fig. 8 but when only Marangoni effects are operative (Ra = 0, Ma = 10). The front propagates at a constant speed and is unaffected by changes in the amplitude of gravity. No return flow is observed at the surface. | ||
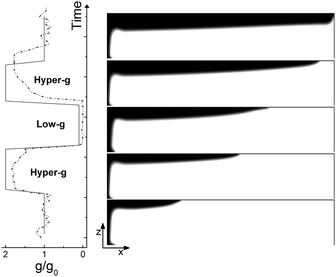 | ||
| Fig. 10 Same as in Fig. 8 but when the hydrodynamic flows are driven by the cooperative contribution of buoyancy and Marangoni effects (Ra = 0.2, Ma = 10). The dynamics are a combination of those of Fig. 8 and 9, i.e. a slowing down of the buoyancy effect is obtained in the micro-gravity phase but no return flow is obtained as in the Marangoni-driven flow field. | ||
We also quantitatively characterized the response of the front dynamics to the modulated gravity by following the front mixing length Lm as a function of time (Fig. 11(b)),
| Lm = xtip − xback | (17) |
 | (18) |
The tip localizes the position along x in front of which the depth-averaged concentration is less than 0.01, while the back corresponds to the position behind which the depth-averaged concentration is larger than 0.99. To better understand changes in the mixing length evolution, xtip and xback as a function of time are also reported in Fig. 11(c) and (d).
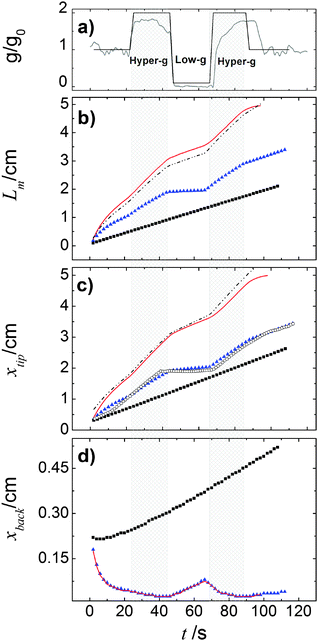 | ||
| Fig. 11 Characterization of the front response to the modulated gravitational term g/g0. In (a) we report in gray the parabolic profile followed during the real flight while its step function approximation used in our simulations is shown in black; in (b) we plot the mixing length Lm as a function of the time; in (c) and (d) the two contributions to mixing length, xtip and xback are reported versus time. In each panel blue triangles, black squares and red solid curves follow the system dynamics for the pure buoyancy-driven, the pure Marangoni-driven and buoyancy-Marangoni-driven convection, respectively. The black dashed curves in panels (b) and (c) trace a linear combination of the pure buoyancy and pure Marangoni characteristics. Empty circles in panel (c) represent the experimental trend of Fig. 6 suitably shifted to the same position range as in the simulations. | ||
When the reaction is carried out in a closed reactor, the hydrodynamic flow is induced by the propagation of the less dense autocatalytic species over the denser fresh reactants, which determines a clockwise vortex localized around the reactive interface and co-moving with it.35 The resulting RDC-structure is elongated towards the top and the intensity of this deformation follows the magnitude of the gravitational term g/g0 as depicted in Fig. 8. In the first part of the dynamics where g/g0 equals 1, the chemical front starts tilting in the upper layer of the reactor and the lower part of the interface moves back until the side wall of the reactor is reached. A short induction period in which xtip(t) slowly grows and xback(t) decays to zero is described by the blue triangles of Fig. 11(c) and (d). Accordingly, during this initial phase the front mixing length exhibits a monotonically increasing transient scaling with the square root of time (see the initial trend traced by blue triangles in Fig. 11(b)), as characterized in previous studies.35,49 However, differently from what was found in these earlier studies, here the profile of the autocatalytic front cannot stabilize over a constant shape since the boundary conditions at the left lateral border hinder the formation of the asymptotically stable symmetrical shape.
The increasing buoyancy forcing in the first hyper-g phase further sustains the front deformation at the top of the reactor with a parallel increment of the front speed. The time interval of the hyper-g step is large enough to let the front speed stabilize over a new regime as demonstrated by the almost constant slope of Lm(t) and xtip(t) within this region.
The dynamics during the low-g phase tend to recover the peculiarities of a RD-structure2 and this is reflected in the increased extent of the reacted region around the front tip where no preferential growth direction dominates. Also note that within this interval, the back front experiences a temporary increment along the horizontal axis (see Fig. 11). In agreement with experimental data, this flight phase is characterized by a sharp drop of the front speed as shown by the reduced slope of the mixing length and the front tip curves in Fig. 11(b) and (c).
During the transition to the new hyper-g phase, the autocatalytic front is again pushed forward along the top part of the slab and backward at the bottom. In parallel, we can appreciate an increase in the mixing length with the slope of the curve Lm(t) and xtip(t) that match the same values as in the first hyper-g episode in the parabola.
We compared the trends observed in the closed reactor with those obtained with the analogous system where only surface effects are at play (see Fig. 9). When the reaction is performed in an open vessel, one of the main products of the autocatalytic process, I2, lowers the surface tension at the interface between the reacted and the non-reacted solution so promoting the conditions for Marangoni-driven convection. The net force at the air–liquid interface enhances the preferential growth of the front at the contact line between solution and air towards the right side of the slab and determines a morphological change in the front shape. While in the presence of pure buoyancy-driven convective motions the front profile along the z-axis shows a non monotonic contour with an evident maximum at the slab top, in the same region, when only surface effects rule the spatio-temporal dynamics of the front, a monotonously-shaped interface separates the reacted solution from fresh reactants. This is clear when comparing the spatio-temporal patterns in Fig. 8 with those in Fig. 9 and is due to the different topology of the flow field related to the two separate sources of convection. These aspects are extensively discussed in ref. 37, 45 and 49. As expected, the system controlled by pure Marangoni-driven convection is not affected by the modulated gravitational field and follows the same qualitative behavior illustrated in ref. 45 where no dynamical changes in the gravitational term are considered. All the topological observables of the front (see black squares in Fig. 11(b) and (c)) show a monotonic increase in time. The front moves with a constant speed which can be extrapolated from the slope of the linear trend described by the black squares of Fig. 11(c).
On the other hand, a similar dependence of the chemical field on the gravitational parabolas as in the pure buoyancy case is preserved and becomes even more evident when the onset of hydrodynamic motions are promoted by the buoyancy-Marangoni coupling (see Fig. 10). Here, the emergent convective instability is the result of a cooperative interplay between buoyancy- and Marangoni-induced flows, which are both oriented along the front propagation direction. In turn, the front shape merges the properties of the pure buoyancy and the pure Marangoni cases (compare Fig. 10 with Fig. 8 and 9): the front profile is dominantly pulled to the right of the cell at the air–solution interface but also experiences a deformation against the gravitational field. The extent of this deformation depends upon the intensity of the term gz/g0 and the response of Lm(t), xtip(t) and xback(t) to its variations is quantitatively followed by the red curves in Fig. 11(b)–(d), respectively. Both Lm(t) and xtip(t) are shifted to higher values with respect to the limiting pure buoyancy- and pure Marangoni-controlled systems. It is worth noticing that the direct sum of xtip(t) of the pure buoyancy and pure Marangoni cases (see dashed curve in Fig. 11(c)) closely follows the trend of the coupled Marangoni-buoyancy system drawn in red in the same graph. This feature is instructive to get reliable insights into the front properties for large values of Ma, prohibitive for a direct simulation. As described in a previous study,46 when the sole Marangoni contribution is controlling the onset of convection in the system, xtip preserves a linear temporal evolution even for large Ma (∼ 103), with a propagation speed (the slope of the line xtip(t)) scaling with Ma as  in dimensionless units (corresponding to
  ). Since buoyancy and Marangoni contributions are likely to be still additive in the domain of high Ma, we can extrapolate xtip dynamics for Ma ∼ 104 as a linear combination of the blue trends in Fig. 11(b) and (c), and a line with slope 0.35 cm s−1. This is also true for Lm trajectories, since these are mainly determined by the xtip dynamics. By contrast, the xback dynamics are pretty much the same when both contributions are at play and for the pure buoyancy case (compare blue and red curves in Fig. 11(d)).
4.3 Discussion
A comparison between Fig. 4 and 8 as well as Fig. 6 and 11 (with the data of Fig. 6 inserted as empty circles in Fig. 11(c) after a suitable shift to the same position range as in the simulations) shows that modulated buoyancy effects are clearly operational in the experiments. Indeed the front deformation is reduced and the front velocity slows down when the system enters the micro-gravity phase. As simulations (see Fig. 9) suggest that the density and surface-tension effects can be considered in a good approximation to be additive in the deformation of the front, the measurement of the difference in velocity at gz/g0 ∼ 0 is a way to extrapolate the magnitude of the Marangoni effects.The deformation of the front tip observed in the experiments for closed cells has been successfully reproduced in the calculations. Note how both in the experiments (Fig. 4) and numerical simulations (Fig. 8) the convex region around the front tip shrinks when the system enters the hyper-gravity and swells in the low-gravity phases, where the dynamics recall the features of a pure autocatalytic RD-front. The variation in the velocity of the tip propagation during the various phases also reveals the good agreement between experiments and calculations. In order to achieve a similar comparison for open cells, the analysis requires a longer time span of micro-gravity uninterrupted by hyper-gravity phases, as is available in a suborbital sounding rocket flight.
5 Conclusions
By measuring the periodic changes from an accelerated front propagation under hyper-gravity towards a slowed down propagation under low-gravity we have shown that gravity markedly influences the motion of autocatalytic reaction fronts even in thin fluid layers. This behavior is caused by the amplification or decay of a buoyancy-driven vortex surrounding the front when increasing or decreasing the g-level.Numerical simulations of the problem are in good quantitative agreement with experimental measurements of closed cells made on board of a parabolic flight in which the gravity field is modulated periodically. They further show that density and surface tension driven effects are in a good approximation additive so our method can be used to infer dynamics at larger Marangoni numbers and it is appropriate for future predictions in open cells. This is also useful to extrapolate more quantitative information on the magnitude of each effect alone in the evolution of the front on earth.
Acknowledgements
We thank Ulrike Strachauer, Eszter Orosz, and Armin Heinze for their support before and during the parabolic flight campaign. Financial support by ESA, WBI, TÉT, ESTEC, Prodex, DLR (50WM1144), Regione Sardegna (POR 2007–2013) and DFG is gratefully acknowledged.References
- Oscillations and Traveling Waves in Chemical Systems, ed. R. J. Field and M. Burger, Wiley, New York, 1985 Search PubMed.
- I. R. Epstein and J. A. Pojman, An introduction to nonlinear chemical dynamics, Oxford University Press, Oxford, 1998 Search PubMed.
- W. van Saarloos, Phys. Rep., 2003, 386, 29 CrossRef PubMed.
- T. A. Gribschaw, K. Showalter, D. L. Banville and I. R. Epstein, J. Phys. Chem., 1981, 85, 2152 CrossRef CAS.
- A. Hanna, A. Saul and K. Showalter, J. Am. Chem. Soc., 1982, 104, 3838 CrossRef CAS.
- G. Bazsa and I. R. Epstein, J. Phys. Chem., 1985, 89, 3050 CrossRef CAS.
- I. Nagypál, G. Bazsa and I. R. Epstein, J. Am. Chem. Soc., 1986, 108, 3635 CrossRef.
- J. A. Pojman and I. R. Epstein, J. Phys. Chem., 1990, 94, 4966 CrossRef CAS.
- H. Miike, H. Yamamoto, S. Kai and S. C. Müller, Phys. Rev. E: Stat. Phys., Plasmas, Fluids, Relat. Interdiscip. Top., 1993, 48, 1627 CrossRef.
- M. J. B. Hauser and R. H. Simoyi, Chem. Phys. Lett., 1994, 227, 593 CrossRef CAS.
- O. Inomoto, T. Ariyoshi, S. Inanaga and S. Kai, J. Phys. Soc. Jpn., 1995, 64, 3602 CrossRef CAS.
- K. Matthiessen, H. Wilke and S. C. Müller, Phys. Rev. E: Stat. Phys., Plasmas, Fluids, Relat. Interdiscip. Top., 1996, 53, 6056 CrossRef CAS.
- G. Schuszter, T. Tóth, D. Horváth and Á. Tóth, Phys. Rev. E, 2009, 79, 016216 CrossRef.
- I. Bou Malham, N. Jarrige, J. Martin, N. Rakotomalala, L. Talon and D. Salin, J. Chem. Phys., 2010, 133, 244505 CrossRef CAS PubMed.
- T. Rica, E. Pópity-Tóth, D. Horváth and Á. Tóth, Phys. D, 2010, 239, 831 CrossRef CAS PubMed.
- E. Pópity-Tóth, D. Horváth and Á. Tóth, J. Chem. Phys., 2011, 135, 074506 CrossRef PubMed.
- O. Miholics, T. Rica, E. Pópity-Tóth, D. Horváth and Á. Tóth, J. Chem. Phys., 2011, 135, 204501 CrossRef PubMed.
- L. Sebestíková and M. J. B. Hauser, Phys. Rev. E, 2012, 85, 036303 CrossRef.
- F. Rossi, M. A. Budroni, N. Marchettini and J. Carballido-Landeira, Chaos, 2012, 22, 037109 CrossRef PubMed.
- E. Pópity-Tóth, V. Pimienta, D. Horváth and Á. Tóth, J. Chem. Phys., 2013, 139, 164707 CrossRef PubMed.
- J. A. Pojman, I. R. Epstein, T. J. McManus and K. Showalter, J. Phys. Chem., 1991, 95, 1299 CrossRef CAS.
- J. Masere, D. A. Vasquez, B. F. Edwards, J. W. Wilder and K. Showalter, J. Phys. Chem., 1994, 98, 6505 CrossRef CAS.
- M. Böckmann and S. C. Müller, Phys. Rev. Lett., 2000, 85, 2506 CrossRef.
- A. De Wit, Phys. Rev. Lett., 2001, 87, 054502 CrossRef CAS.
- D. Horváth, T. Bánsági Jr. and Á. Tóth, J. Chem. Phys., 2002, 117, 4399 CrossRef PubMed.
- T. Bánsági Jr., D. Horváth, Á. Tóth, J. Yang, S. Kalliadasis and A. De Wit, Phys. Rev. E, 2003, 68, 055301 CrossRef.
- M. C. Rogers and S. W. Morris, Phys. Rev. Lett., 2005, 95, 024505 CrossRef.
- T. Tóth, D. Horváth and Á. Tóth, Chem. Phys. Lett., 2007, 442, 289 CrossRef PubMed.
- L. Šebestíková, J. D'Hernoncourt, M. J. B. Hauser, S. C. Müller and A. De Wit, Phys. Rev. E, 2007, 75, 026309 CrossRef.
- T. Plesser, H. Wilke and K. H. Winters, Chem. Phys. Lett., 1992, 200, 158 CrossRef CAS.
- D. A. Vasquez, J. M. Littley, J. W. Wilder and B. F. Edwards, Phys. Rev. E: Stat. Phys., Plasmas, Fluids, Relat. Interdiscip. Top., 1994, 50, 280 CrossRef.
- H. Wilke, Phys. D, 1995, 86, 508 CrossRef CAS.
- Y. Wu, D. A. Vasquez, B. F. Edwards and J. W. Wilder, Phys. Rev. E: Stat. Phys., Plasmas, Fluids, Relat. Interdiscip. Top., 1995, 51, 1119 CrossRef CAS.
- V. Pérez-Villar, A. P. Muñuzuri and V. Pérez-Muñuzuri, Phys. Rev. E: Stat. Phys., Plasmas, Fluids, Relat. Interdiscip. Top., 2000, 61, 3771 CrossRef.
- L. Rongy, N. Goyal, E. Meiburg and A. De Wit, J. Chem. Phys., 2007, 127, 114710 CrossRef CAS PubMed.
- M. A. Budroni, M. Masia, M. Rustici, N. Marchettini and V. Volpert, J. Chem. Phys., 2009, 130, 024902 CrossRef PubMed.
- L. Rongy and A. De Wit, J. Chem. Phys., 2009, 131, 184701 CrossRef CAS PubMed.
- L. Rongy, G. Schuszter, Z. Sinkó, T. Tóth, D. Horváth, Á. Tóth and A. De Wit, Chaos, 2009, 19, 023110 CrossRef CAS PubMed.
- N. Jarrige, I. Bou Malham, J. Martin, N. Rakotomalala, D. Salin and L. Talon, Phys. Rev. E, 2010, 81, 066311 CrossRef CAS.
- Z. Dagan and L. M. Pismen, J. Colloid Interface Sci., 1984, 99, 215 CrossRef CAS.
- L. M. Pismen, J. Colloid Interface Sci., 1984, 102, 237 CrossRef CAS.
- Z. Dagan and C. Maldarelli, Chem. Eng. Sci., 1987, 42, 1259 CrossRef CAS.
- L. M. Pismen, Phys. Rev. Lett., 1997, 78, 382 CrossRef CAS.
- A. Pereira, P. M. J. Trevelyan, U. Thiele and S. Kalliadasis, Phys. Fluids, 2007, 19, 112102 CrossRef PubMed.
- L. Rongy and A. De Wit, J. Chem. Phys., 2006, 124, 164705 CrossRef CAS PubMed.
- L. Rongy, A. De Wit and G. M. Homsy, Phys. Fluids, 2008, 20, 072103 CrossRef PubMed.
- L. Rongy, P. Assemat and A. De Wit, Chaos, 2012, 22, 037106 CrossRef CAS PubMed.
- M. Diewald, K. Matthiessen, S. C. Müller and H. R. Brand, Phys. Rev. Lett., 1996, 77, 4466 CrossRef CAS.
- M. A. Budroni, L. Rongy and A. De Wit, Phys. Chem. Chem. Phys., 2012, 14, 14619 RSC.
- J. Martin, N. Rakotomalala, L. Talon and D. Salin, Phys. Rev. E, 2009, 80, 055101 CrossRef CAS.
- Y. Shi, K. Eckert, A. Heinze and M. Acker, 17th ESA Symposium on European Rocket and Balloon Programmes and Related Research, 30 May–2 June 2005, Sandefjord, Norway, 2005, pp. 545–550 Search PubMed.
- Y. Shi and K. Eckert, Chin. J. Chem. Eng., 2007, 15, 748–753 CrossRef CAS.
- K. Eckert, L. Rongy and A. De Wit, Phys. Chem. Chem. Phys., 2012, 14, 7337 RSC.
- S. Fujieda, Y. Mogamia, A. Furuya, W. Zhang and T. Araiso, J. Phys. Chem. A, 1997, 101, 7926 CrossRef CAS.
- S. Fujieda, Y. Mori, A. Nakazawa and Y. Mogami, Adv. Space Res., 2001, 28, 537 CrossRef CAS.
- C. Almarcha, P. M. J. Trevelyan, P. Grosfils and A. De Wit, Phys. Rev. E, 2013, 88, 033009 CrossRef CAS.
- J. Boussinesq, Théorie Analytique de la Chaleur, Gauthier-Villars, Paris, 1903, vol. 2 Search PubMed.
- D. W. Peaceman and H. H. Rachford, J. Soc. Ind. Appl. Math., 1955, 3, 28 CrossRef.
| This journal is © the Owner Societies 2014 |

