 Open Access Article
Creative Commons Attribution 3.0 Unported Licence
Biomolecular structure manipulation using tailored electromagnetic radiation: a proof of concept on a simplified model of the active site of bacterial DNA topoisomerase†
Daungruthai
Jarukanont
a,
João T. S.
Coimbra
b,
Bernd
Bauerhenne
a,
Pedro A.
Fernandes
b,
Shekhar
Patel
*c,
Maria J.
Ramos
*b and
Martin E.
Garcia
*a
aInstitute of Physics, FB 10, University of Kassel, Heinrich-Plett-Str. 40, 34132 Kassel, Germany. E-mail: garcia@physik.uni-kassel.de
bRequimte, Departamento de Química e Bioquímica, Faculdade de Ciências, Universidade do Porto, Rua do Campo Alegre s/n, 4169-007 Porto, Portugal. E-mail: mjramos@fc.up.pt
cPepsiCo Advanced Research, 3 Skyline Dr, Hawthorne, NY 10532, USA. E-mail: Shekhar.Patel@pepsico.com
First published on 8th September 2014
Abstract
We report on the viability of breaking selected bonds in biological systems using tailored electromagnetic radiation. We first demonstrate, by performing large-scale simulations, that pulsed electric fields cannot produce selective bond breaking. Then, we present a theoretical framework for describing selective energy concentration on particular bonds of biomolecules upon application of tailored electromagnetic radiation. The theory is based on the mapping of biomolecules to a set of coupled harmonic oscillators and on optimal control schemes to describe optimization of temporal shape, the phase and polarization of the external radiation. We have applied this theory to demonstrate the possibility of selective bond breaking in the active site of bacterial DNA topoisomerase. For this purpose, we have focused on a model that was built based on a case study. Results are given as a proof of concept.
I. Introduction
The possibility of using external fields to break particular bonds while preserving others has been explored in small molecules in the gas-phase and molecules adsorbed on surfaces.1–4 Similar methods, however, cannot be directly applied to biomolecules due to their complex structure. Moreover, the same biomolecule can contain a number of bonds like C–C or C–N, making it difficult to break them only on particular sites and not on others.Particularly interesting biomolecules are enzymes like DNA topoisomerases, which solve the topological problems associated with DNA replication, transcription, recombination, and chromatin remodeling. Topoisomerases can be classified as type I and type II classes. This classification depends on whether they transiently break, respectively, one or two strands of DNA. Both type I and type II topoisomerases can be further subdivided into 5 subtypes: IA, IB, IC, IIA, and IIB.5 One of the essential roles of topoisomerases is the strand-breakage reaction of DNA.6 Much interest has covered these enzymes, since they are currently important therapeutic targets involving numerous antimicrobial and anticancer treatments, and are also among the most effective targets.7
The building blocks of enzymes are amino acids, which exhibit large permanent dipole moments.8 When an external electric field is applied to a biomolecule, the dipoles tend to align parallel to the field. Since this cannot occur without substantial structural changes, an interesting interplay between electrostatic and conformational energies takes place.9 For this reason pulsed electric fields are used to modify the structures of proteins for industrial purposes. Depending on the intensity of the applied electric field, changes in the structure of the protein may occur which lead to malfunction. Therefore, pulsed electric fields (PEFs) acting on enzymes or proteins in general may produce structural transformation and affect their function. However, the field intensities needed for irreversible conformal changes might be too high and the applied fields might also destroy other structures. A possible way to avoid such collateral damage is to address and break particular bonds of proteins, leaving the rest of the system almost unchanged.
In this paper, we demonstrate that pulsed electric fields are not able to induce selective bond breaking and rather produce global conformational changes and damage. Therefore, a completely different approach is needed to address specific bonds. As mentioned above, many decades of intensive research on the field of “selective light induced bond breaking” have led to the possibility of breaking particular chemical bonds in small systems using electromagnetic radiation, but direct application to biomolecules is not possible. Different problems make selective bond breaking in biomolecules tremendously difficult. The most important one is the lack of specificity of simple energy inputs. Breaking C–C or C–N bonds in only one unit of a particular biomolecule not changing either the rest of the molecule or other molecules in the cell is an ambitious and challenging task, which cannot be achieved by merely applying light pulses with frequencies resonant to those of such bonds. The only promising approach is to “prepare” the electromagnetic pulses in such a way that they also contain information on the environment of the bonds.
Here, we present a theory for selective energy concentration and subsequent breaking of particular bonds of DNA topoisomerase. Our approach is based on electromagnetic-pulse shaping using optimal control (OC) schemes.10 The idea behind OC is the optimization of electromagnetic radiation (pulse shape, phase and polarization) in order to achieve a particular target state. For small molecules, optimal control of mode-selective femtochemistry has been described using quantum chemical molecular dynamics11 We have applied our theory to simulate excitation of a model molecule consisting of 16 atoms, which represents the active site of topoisomerase. As a complementary result we performed an extensive analysis of the vibrational frequencies of the active site of DNA topoisomerase. Our results demonstrate the viability of selective bond breaking in biological systems using tailored electromagnetic radiation and constitute a proof of concept.
II. Modelling of topoisomerase
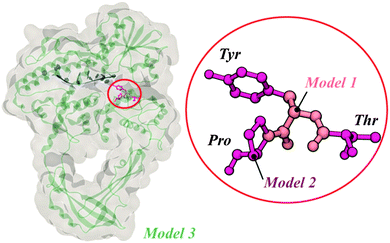
Three different models, each one including the catalytic tyrosine residue of topoisomerase III from Escherichia coli, were employed throughout the work: Model 1, which represented our base model for frequency determination (see Fig. 1); Model 2, a second model composed of 3 residues – the catalytically relevant tyrosine and the two immediate residues (see Fig. 1), and Model 3, obtained by adding the enzyme's environment and a single-stranded DNA (ssDNA) chain around Models 1 and 2 (i.e. the whole crystallographic enzyme).The 3 models represent a growing sequence of the E. coli's topoisomerase III active site (Fig. 1); they were chosen to assess the influence of this growing complexity on relevant vibrational modes of the peptide structure (Model 1 and Model 2); to determine the eigenfrequencies and eigenvectors to be used as input for the optimization of electromagnetic radiation in order to achieve selective bond breaking (Model 1), and to assess the effects of external electric fields on protein conformation (Model 3). The models were built based on the crystallographic structure deposited in the protein data bank with code 1I7D.12 The phenylalanine residue (granting no enzymatic activity) was mutated back to a tyrosine (catalytically active).
III. Impossibility of selective bond breaking using constant electric fields
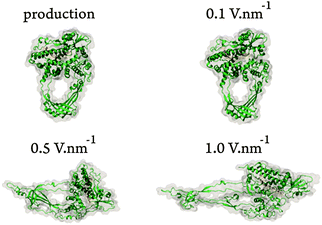
To demonstrate that pulsed electric fields are not able to break particular bonds avoiding other structural changes in biomolecules, we performed molecular dynamics (MD) simulations based on the GROMACS package.13 A total of 10 ns production dynamics were performed and additional 10 ns with an electric field dynamics were conducted. Details of the simulations are provided in the ESI† of this article. A detailed analysis was performed, regarding the effects of an external electric field on the protein structure of topoisomerase III. Three electric field settings were employed: 0.1, 0.5, and 1.0 V nm−1. Notice that the magnitude of the external fields in our simulations should not be mistaken with the electric fields used at the industrial scale,14 obtained by dividing the potential difference on a pair of electrodes by the distance between them. The electric field used at the industrial scale represents, in homogeneous systems, the net electric field that results from summing the external field arising from charging the electrodes with the counteracting field arising from the dielectric polarization of the medium. The actual effective electric field in the simulation medium can be determined by reducing the applied field by a factor equal to the relative permittivity of the medium.15 For example, given that the relative permittivity of TIP3P water is ca. 9016 applying an external field of 1.0 V nm−1 in our simulations produces an effective (net) field in the aqueous medium of ca. 0.01 V nm−1 (100 kV cm−1), which is the same as the one used in, for instance, the food processing industry.For electric field strengths of 0.5 and 1.0 V nm−1 relevant distortion of the enzyme's secondary structure was detected (see Fig. 2). We also observed significant changes in the root-mean-square deviation and radius of gyration, as well as in secondary structure elements for both field strengths, and in particularly for 1.0 V nm−1 (see ESI†).
These results provide us with the electric field ranges to be applied to all-atom simulations involving the full topoisomerase enzymes. What we observed is that the threshold value lies between 0.1 and 0.5 V nm−1. What is also apparent is that with higher field strengths, the systems change their topology and assembly, faster. However, the field intensities needed for irreversible conformal changes might be too high and the applied fields might destroy other structures (collateral damage).
Additionally, to validate our protocol, a different protein from E. coli was selected: reduced thioredoxin (with the PDB code 1XOB).17 We applied the same protocol of the electric field dynamics to it. This was intended to evaluate the influence of the same electric fields on a totally different protein and to find out whether the same field strengths exerted the same influence on different proteins. We obtained for thioredoxin similar results to that for topoisomerase (see ESI†). From our simulations it is clear that application of pulsed electric fields near damage threshold can only destroy topoisomerase's active center and cause the unfolding of thioredoxin. This confirms the non-specific character of a possible application of an external electric field to a certain medium and the possible effects of collateral damage. Therefore we conclude that pulsed electric fields cannot induce selective bond breaking in biomolecules.
IV. Our approach for selective bond breaking in biomolecules
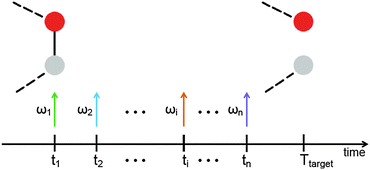
When a molecule is irradiated with the help of an electromagnetic pulse, usually many vibrational eigenmodes are excited. This leads to oscillatory motion of all atoms. If the pulse is very intense, damage of the molecule through destruction of one or several chemical bonds occurs. The damage process is, in principle, uncontrollable if a single pulse is used. The goal of this paper is to show that it is possible to design a sequence of pulses able to induce selective bond breaking. The idea is sketched in Fig. 3. If the molecule is excited by a series of pulses, each one targeting a different eigenstate or groups of eigenstates, it might be possible to vary intensities, phases and eventually polarizations of the pulses in order to achieve breaking of a desired bond.In order to investigate whether a shaped train of light pulses (as schematically shown in Fig. 3) is able to manipulate the bonds of a molecule, we need to start by achieving a proof of concept on a simplified model. In this paper we focus on the active site of topoisomerase and treat it as a gas-phase molecule. We then treat the molecule in the harmonic approximation in order to obtain its eigenstates. The interaction of electromagnetic radiation with the biomolecule is also modelled. Finally, we use an optimization scheme to obtain the proper parameters of the electromagnetic radiation able to concentrate such an amount of energy on particular bonds, so that they break.
IV.1 Mapping a biomolecule to a system of coupled harmonic oscillators
We consider a biomolecule consisting of N units (which could be atoms in an atomistic model or groups of atoms in the case of a coarse grained force field). The mass of each atom is Ml (l = 1, N). In the harmonic approximation (see ESI†), the potential energy of the system is given as a function of the displacements![[u with combining right harpoon above (vector)]](https://www.rsc.org/images/entities/b_i_char_0075_20d1.gif) l of the atoms by
l of the atoms by | (1) |
![[u with combining right harpoon above (vector)]](https://www.rsc.org/images/entities/b_i_char_0075_20d1.gif) 1,…,
1,…,![[u with combining right harpoon above (vector)]](https://www.rsc.org/images/entities/b_i_char_0075_20d1.gif) N) can be a complicated function of the displacements and is formally obtained after solving the electronic problem according to the Born–Oppenheimer approximation.18 It includes covalent, ionic and hydrogen bonds as well as van der Waals forces. In the limit of large relative displacement between two atoms the real Veff(
N) can be a complicated function of the displacements and is formally obtained after solving the electronic problem according to the Born–Oppenheimer approximation.18 It includes covalent, ionic and hydrogen bonds as well as van der Waals forces. In the limit of large relative displacement between two atoms the real Veff(![[u with combining right harpoon above (vector)]](https://www.rsc.org/images/entities/b_i_char_0075_20d1.gif) 1,…,
1,…,![[u with combining right harpoon above (vector)]](https://www.rsc.org/images/entities/b_i_char_0075_20d1.gif) N) goes to zero. This indicates the dissociation limit. In the harmonic approximation [eqn (1)], however, Vharmeff(
N) goes to zero. This indicates the dissociation limit. In the harmonic approximation [eqn (1)], however, Vharmeff(![[u with combining right harpoon above (vector)]](https://www.rsc.org/images/entities/b_i_char_0075_20d1.gif) 1,…,
1,…,![[u with combining right harpoon above (vector)]](https://www.rsc.org/images/entities/b_i_char_0075_20d1.gif) N) increases parabolically for increasing relative displacements. If the biomolecule is in its native state (global minimum) or in a local minimum of Veff the displacements of the atoms (units) acquire their equilibrium values equal to zero.
N) increases parabolically for increasing relative displacements. If the biomolecule is in its native state (global minimum) or in a local minimum of Veff the displacements of the atoms (units) acquire their equilibrium values equal to zero.
From eqn (1) one can easily derive the equations of motion for the displacements (see ESI†). By projecting the displacements into the directions of the eigenmodes of the molecule, which are determined from the diagonalization of the mass weighted Hessian (dynamical) matrix (see ESI†), one obtains
 | (2) |
 (t) = (a1(t),a2(t),…,a3N−6(t)) contains the displacements written on the basis of the eigenvectors
 ![[G with combining right harpoon above (vector)]](https://www.rsc.org/images/entities/b_i_char_0047_20d1.gif) j of the dynamical matrix. Ω is the diagonal form of the dynamical matrix and contains the squared eigenfrequencies {ω12,…,ω3N−62} of the molecule.
j of the dynamical matrix. Ω is the diagonal form of the dynamical matrix and contains the squared eigenfrequencies {ω12,…,ω3N−62} of the molecule.
IV.2 Modeling the interaction of the molecule with electromagnetic pulses
Since an external electromagnetic field oscillating with frequency ω will essentially excite the eigenstates of the molecule having the same frequency, we describe the displacements of the atom projected in the directions of the eigenvectors: | (3) |
 | (4) |
 j(tj) = 0, since the molecule is at rest before excitation with electromagnetic radiation.
IV.3 Optimization of the electromagnetic radiation
The problem of pulse shaping consists of designing the best electromagnetic pulse in order to induce (favor) a particular reaction and at the same time to prevent other outcomes. This is a typical global search problem which relies on the maximization of a so called “fitness functional”, which is in general a measure of the overlap between the actual molecular conformation at the control time and the target conformation. Different pulse shapes lead to different outcomes. The pulse shape maximizing the fitness functional is the optimal one.Now, we design a sequence of pulses in such a way that the frequencies ωi of the electromagnetic waves are resonant with the vibrational eigenfrequencies ωj. The optimization of the electromagnetic pulses will be based on the integration of eqn (4). We describe below an analytical and a numerical approach to optimize external radiation in order to achieve bond breaking.
 | (5) |
With this approximation, which assumes that the molecule vibrates in its eigenstates and only resonant radiation can excite them efficiently, all equations of motion under the action of the electromagnetic radiation become fully decoupled and can be easily solved through direct analytical integration. Taking into account the initial conditions mentioned below (molecules at rest) the solution for t > tj; is given by
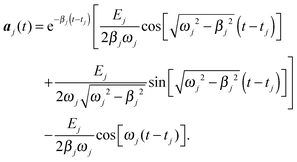 | (6) |
This solution holds when all vibrational eigenfrequencies are larger than the damping constant, which is valid for biomolecules. From eqn (6) we notice that the smaller the damping constant βj, the larger the desired final amplitude of aj(t) which is given by  . Note also that the smaller the damping constant, the longer it takes for the system to reach the final amplitude, since the first two terms are only diminished when
  .
.
Now we proceed to optimize the light pulse by using physical arguments. Our experience in optimal control theory19,20 tells us that the best way of performing light control of atomic motion is to drive the system to the final target state as fast as possible. Therefore, we propose a fitness function of the form
 | (7) |
 target are reached. In order to achieve concentration and eventually bond breaking, we have to choose
  target correspondingly. The phases of the pulses are determined by our choice of smallest possible tfinal we choose the switch-on time tj of each pulse in such a way that the desired amplitude aj(tfinal) = aj,target is reached exactly after one oscillation period. This means that the last term of eqn (6),
  , must perform only one oscillation between t = tj (switch-on time for pulse j) and t = tfinal. This leads to the condition ωj(tfinal − tj) = 2π, or
 | (8) |
Eqn (8) reflects the fact that the pulse to drive the eigenmode j to the desired target amplitude aj,target must be switched on a time 2π/ωj before the time tfinal at which the overall target displacements should be achieved. In order to simplify the expressions we initialize the time by setting tfinal = 0. Then, for each j it must hold aj(0) = aj,target. Replacing this condition into eqn (6) allows us to univocally determine the values of Ej, which are given by
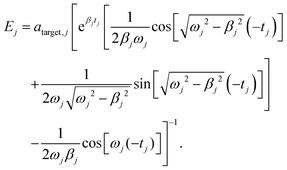 | (9) |
Eqn (9) is valid for all j = 1, 3N − 6. In eqn (9),  .
.
Eqn (8) and (9) determine the optimized (designed) parameters Ej and tj for the electromagnetic pulses, so that the target displacements are reached at t = 0.
Thus, we were able to minimize analytically the fitness function of eqn (7) without using numerical approaches. Note that this is only possible in the resonant approximation for the coupling between the molecule and electromagnetic radiation, and within the harmonic approximation we used. Of course, if we go beyond the harmonic approximation and consider the full interaction of the molecule with electromagnetic radiation, the solution cannot be found any more analytically. However, the theoretical scheme presented in this work remains unchanged.
![[scr F, script letter F]](https://www.rsc.org/images/entities/char_e141.gif) ({Ej}) of eqn (7) is that it only depends on the displacements at the final time tfinal and not on the whole time evolution of the bonds. This means that, even if the target displacements at the final time
({Ej}) of eqn (7) is that it only depends on the displacements at the final time tfinal and not on the whole time evolution of the bonds. This means that, even if the target displacements at the final time  target are constructed in such a way that only one bond is significantly elongated while the others remain intact,
 ![[scr F, script letter F]](https://www.rsc.org/images/entities/char_e141.gif) ({Ej}) cannot “control” whether the other bond elongate considerably on times smaller than tfinal. We correct now this problem and pay the price of a numerical optimization.
({Ej}) cannot “control” whether the other bond elongate considerably on times smaller than tfinal. We correct now this problem and pay the price of a numerical optimization.
Note that we can integrate eqn (4) analytically without making the resonant approximation of eqn (5). Moreover, we can generalize eqn (4) to the case of the arbitrary phase of the electromagnetic radiation
 | (10) |
We can now construct a more complex and reliable fitness function, as follows. First, we define the relative time-dependent elongation of the bond k between atoms j and l as δbond(k,t) = |![[R with combining right harpoon above (vector)]](https://www.rsc.org/images/entities/b_i_char_0052_20d1.gif) l(t) −
l(t) − ![[R with combining right harpoon above (vector)]](https://www.rsc.org/images/entities/b_i_char_0052_20d1.gif) j(t)|/|
j(t)|/|![[R with combining right harpoon above (vector)]](https://www.rsc.org/images/entities/b_i_char_0052_20d1.gif) 0l −
0l − ![[R with combining right harpoon above (vector)]](https://www.rsc.org/images/entities/b_i_char_0052_20d1.gif) 0j|, where
0j|, where ![[R with combining right harpoon above (vector)]](https://www.rsc.org/images/entities/b_i_char_0052_20d1.gif) j(t) refers to the time-dependent position of atom l and
j(t) refers to the time-dependent position of atom l and ![[R with combining right harpoon above (vector)]](https://www.rsc.org/images/entities/b_i_char_0052_20d1.gif) 0l to its equilibrium position in the native structure. The index k labels the bonds. We relate δbond(k,t) to its value in the target by defining Δk = δbond(k,t)/δbond(k,target). Δk = 1 in the ideal case of perfect match of bond k with its length in the target structure. Now, the fitness function must be such that a particular bond becomes dramatically stretched at the target time, while all others remain only slightly elongated at all times. Only in this way selective energy concentration on one bond can be guaranteed. This requirement is much more difficult to fulfil than that imposed by the previous fitness function of eqn (7). Therefore, we define the new fitness function
0l to its equilibrium position in the native structure. The index k labels the bonds. We relate δbond(k,t) to its value in the target by defining Δk = δbond(k,t)/δbond(k,target). Δk = 1 in the ideal case of perfect match of bond k with its length in the target structure. Now, the fitness function must be such that a particular bond becomes dramatically stretched at the target time, while all others remain only slightly elongated at all times. Only in this way selective energy concentration on one bond can be guaranteed. This requirement is much more difficult to fulfil than that imposed by the previous fitness function of eqn (7). Therefore, we define the new fitness function ![[scr J, script letter J]](https://www.rsc.org/images/entities/char_e529.gif) as
as
 | (11) |
θ(x) refers to the step function, and the factor ε tells us how much the rest of the bonds may be elongated with respect to a particular target situation. Note that in this way all bonds different from the target bond will have at most an elongation equal to 100ε% of the target bond. We choose ε = 0.55.
IV.4 Frequency analysis protocol
In order to find out the optimized electromagnetic radiation through application of the theory presented in the previous subsections, we had first to determine the vibrational eigenfrequencies and eigenvectors of the biomolecule. For this purpose we used the harmonic approximation described in the ESI.†Our study was directed to finding out the vibrational frequencies of a system with few amino acids. This is important since the vibrational frequencies are highly influenced by the environment, namely for proteins due to the strong polar topology that they display. In addition, their intermolecular interactions dramatically influence the vibrational dynamics and structural properties of vibrational frequencies.21 However, one cannot easily determine the vibrational frequencies of an entire protein, since it requires a tremendous computational cost. Due to this aspect, we have started from the simplified Models 1 and 2 described above. The frequencies of selected vibrational stretching modes were determined for each of the above models, in which we focus our analysis towards the backbone atoms, including the Cα and Cβ carbon atoms, as well as the atoms of the trans peptide group. They represent important bonds on the peptide structure. Both gas-phase and a water solvation model were used for frequency calculations. For the solvation model we have used the Self Consistent Reaction Field (SCRF) theory, implemented through a Polarized Continuum Model (namely the Conductor-like Polarizable Continuum Model, i.e. CPCM).22 The B3LYP functional,23 within the Density Functional Theory (DFT), coupled to a 6-31G(d) basis set24 was employed since good results are reported for this combination when considering frequency calculations, and also due to the small computational cost.25
The frequencies were multiplied by a scaling factor of 0.9614 as is customary in frequency calculations with this functional and basis set.26 This is necessary since ab initio harmonic vibrational frequencies are typically larger than experimental fundamentals. This scaling can also be applied due to the uniformity of this variation between theory and experiment.
The same chemical bond vibrational frequencies were compared in both models, in order to assess the biomolecule-specificity of a radiation-induced bond breaking event in the protein backbone. In addition, the influence of an external electric field (1.0 V nm−1) was accessed for the variation in vibrational frequencies, in Model 1 and Model 2. All calculations were performed using Gaussian 09.27
V. Results and discussion
In this section we demonstrate that it is possible to induce energy concentration on a particular predetermined bond of Model 1 for the active site of topoisomerase by applying an optimized train of light pulses. We first show results corresponding to the frequency analysis protocol for Model 1 and Model 2, obtained from the computation of the mass weighted Hessian matrix and its diagonalization. The so obtained eigenvectors and eigenvalues for Model 1 are then used as input for the pulse tailoring.V.1 Frequency analyses
We have calculated the vibrational frequencies in Models 1 and 2 to later study selective bond breaking in biomolecules. It is important to study both models because vibrational frequencies should be sensitive to the environment. It has been described that vibrational modes of proteins are affected by the protein's structure and sequence, the exposure of the surface residues to the solvent (mediated through hydrogen bonding), and by bulk effects.21 Other factors can influence the vibrational modes of proteins as for instance the protonation states of amino acid residues or the interaction with ions. This sensitivity to the chemical composition and the architecture of molecules renders infrared spectroscopy as one of the classical methods for investigating protein structure, protein-mediated reactions, and protein folding.In the ESI† we present a detailed summary of all the results; here we present only the relevant conclusions to avoid a lengthy, repetitive description of the same kind of results.
We have focused our analysis in the backbone atoms represented in our models, specifically the trans peptide group and the Cα and Cβ atoms. The results are discussed relatively to the gas-phase frequencies; however the water dielectric determined frequencies are also compared, since a relevant deviation between the two was observed for specific vibrational modes. The trans peptide group vibrations include amide A, and amide I, II, and III vibrations.
The relevant vibrations will be further discussed, compared between both models, and also with what is expected experimentally. Considering Model 1, the results show a relevant difference between the gas-phase and the water dielectric calculations, specifically for those vibrations within the range 1709–1741 cm−1 and for low frequency modes. The frequencies between 1709–1741 cm−1 can be related to amide I vibrations of the simplified peptidic model. This difference can reach ca. 30 cm−1. For Model 2 (zwitterion) the results are similar. We also observe high deviation within the 1658–1708 cm−1 range, which also corresponds to the amide I vibration. This difference for the amide I vibration has been previously characterized in the literature.24 This supports the influence of the environment on the vibrational frequencies of amino acids. Obviously, more thorough characterization by representation of the protein environment would be necessary to attain a more thorough description of the influence of the specific environment on the studied frequencies, but this is out of the scope of this paper.
When comparing the same vibrations on both Model 1 and Model 2, we observe relevant shifts in the analyzed frequencies. Some relevant observations of these shifts, focusing on amide A, I, II, and III vibrations, are depicted in Table 1. Additionally, vibrations involving the bonds of interest are depicted also in Table 1 (Cα–Cβ, Cα–Cbb, and Cα–Nbb stretching modes).
| Model 1 | Model 2 | Δ frequencies/cm−1 | Characterizationa |
|---|---|---|---|
| Frequency/cm−1 | |||
| a These modes are often coupled to other vibrational modes. ν – bond stretching. | |||
| 3466 | 3437 | −9 | Amide A |
| 1709–1741 | 1625–1700 | −[84–41] | Amide I |
| 1481 | 1501 | +20 | Amide II |
| 1355 | 1416 | +61 | ν Cα–Cbb |
| 1386 | 1349 | −37 | ν Cα–Cβ |
| 1074 | 1007 | −67 | ν Cα–Cβ |
| 1186 | 1040 | −146 | ν Cα–Nbb |
Amide A vibrations correspond to the NH stretching vibrations, normally found between 3270–3310 cm−1.
For Model 1 we see this stretching event at 3466 cm−1, whereas for Model 2 this is found at 3437 cm−1. Amide I vibrations (near 1650 cm−1), in general, have a high C![[double bond, length as m-dash]](https://www.rsc.org/images/entities/char_e001.gif) O stretching component and minor contributions from the out-of-phase CN stretching, the CCN deformation and the NH in-plane bending. In Model 1 this mode is found at 1709 cm−1 and in Model 2 at 1700 cm−1. A second amide I contribution is found at 1741 cm−1 and 1625 cm−1, for Model 1 and Model 2, respectively. The discrepancy between both models must be related to the to the change of the immediate environment. In Model 2, this second amide atom is attached to two carbon atoms (proline residue). The amide II stretching (normally found at ca. 1550 cm−1) is the out-of-phase combination of the NH in plane bending and the CN stretching vibration with smaller contributions from the CO in plane bending and the CC and NC stretching vibrations. For Model 1 this is found at 1481 cm−1 and for Model 2 at 1501 cm−1. N-deuteration converts the amide II mode largely to a CN stretching vibration at 1460–1490cm−1 (amide II′). For Model 2, this CN vibration is in the range 1416–1426 cm−1, and it is probably related to the N atoms belonging to a proline residue.
O stretching component and minor contributions from the out-of-phase CN stretching, the CCN deformation and the NH in-plane bending. In Model 1 this mode is found at 1709 cm−1 and in Model 2 at 1700 cm−1. A second amide I contribution is found at 1741 cm−1 and 1625 cm−1, for Model 1 and Model 2, respectively. The discrepancy between both models must be related to the to the change of the immediate environment. In Model 2, this second amide atom is attached to two carbon atoms (proline residue). The amide II stretching (normally found at ca. 1550 cm−1) is the out-of-phase combination of the NH in plane bending and the CN stretching vibration with smaller contributions from the CO in plane bending and the CC and NC stretching vibrations. For Model 1 this is found at 1481 cm−1 and for Model 2 at 1501 cm−1. N-deuteration converts the amide II mode largely to a CN stretching vibration at 1460–1490cm−1 (amide II′). For Model 2, this CN vibration is in the range 1416–1426 cm−1, and it is probably related to the N atoms belonging to a proline residue.
Other interesting modes are related to the Cα–Cβ stretching: at 1386 and 1074 cm−1 for Model 1, and at 1349 and 1007 cm−1 for Model 2. The presence of Cα–Nbb stretching, at 1186 and 1040 cm−1 (Model 1 and Model 2, respectively), is also relevant. Finally, the Cα–Cbb vibration is also found for Model 1 at 1355 cm−1, and for Model 2 at 1416 cm−1.
Our results confirm that the vibrational frequency of a given bond changes upon changing the immediate environment (here represented by the increase of the molecular model). This corroborates the fact that vibrational frequencies are highly influenced by the environment due to the strong anisotropic polar topology that proteins display. Also intermolecular interactions influence the vibrational dynamics of the chemical bonds.
V.2 Proof of concept: selective bond breaking using tailored electromagnetic radiation
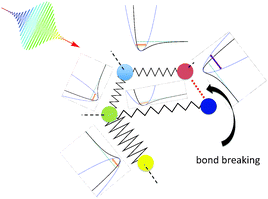
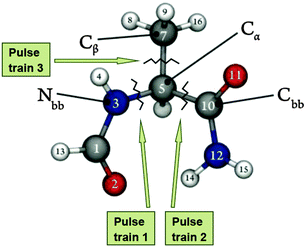
We show in the following that it is possible to optimize the shape and the phase of electromagnetic pulses in order to induce selective breaking of one bond in Model 1 of topoisomerase, while preserving all other bonds.The goal of this work was to tailor pulse trains able to break three bonds of the molecule, as shown in Fig. 5.
As an example we show in this section the analytical optimization of the pulse train 3 which must be able to break only the bond between Cα and Cβ (Fig. 5) in Model 1 of topoisomerase. Analytical results for the optimization of pulses 1 and 2 are included in the ESI.† Moreover, we show here also results of the more accurate numerical optimization for pulses 1 and 3. Pulse 1 is designed to be able to break the bond between Nbb and Cα (Fig. 5).
![[G with combining right harpoon above (vector)]](https://www.rsc.org/images/entities/b_i_char_0047_20d1.gif) j (j = 1, 3N − 6). With this information, the unitary transformation matrix C was constructed (see ESI†). Also the matrices M, M½ and M−½ were computed from the knowledge of the masses of the atoms composing the Model 1 segment.
j (j = 1, 3N − 6). With this information, the unitary transformation matrix C was constructed (see ESI†). Also the matrices M, M½ and M−½ were computed from the knowledge of the masses of the atoms composing the Model 1 segment.
As a first output, the switch-on times tj of the 42 pulses were determined using eqn (S5) of the ESI† and taking into account of that we set tfinal = 0. Since we apply resonant electromagnetic pulses, in principle 3N − 6 pulses are needed. Since Model 1 of topoisomerase consists of 16 atoms, the designed trains contain, at most, 42 pulses.
In order to obtain the values Ej of the electromagnetic pulses using eqn (9), we constructed first the target-displacement vectors  target in real for the three different final states (energy concentration in each of the three mentioned bonds). Finally, we project them into the eigenvectors to obtain
  target using the relationship
  (t) = C·M½·
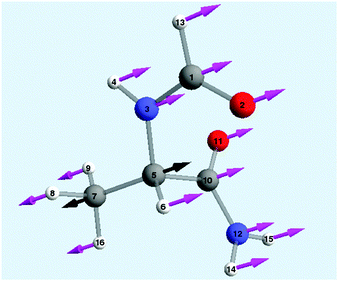
 (t) (see ESI†). In Fig. 6 we show the form of the target-displacement vectors to which pulse train 3 was designed to drive (see Fig. 5). Notice that we constructed the target vector in such a way that the bond to be broken acquires the largest possible stress while the other bonds perform at most small oscillations at the final time t = 0.
Once the vectors  target are obtained from the real-space target displacements constructed in Fig. 6 and 7, they are inserted in eqn (9) to determine the amplitude of the pulses in the trains. This is the solution of the problem. To demonstrate that this solution works we put those amplitudes and the previously determined switch-on times in eqn (6) and obtained the time behavior of the eigenvector-displacements. Then we converted them to real displacements and calculated the time evolution of all 15 bonds of the molecule. The performed determination of the tailored pulse trains has
 ![[R with combining right harpoon above (vector)]](https://www.rsc.org/images/entities/b_i_char_0052_20d1.gif) i (i = 1, N), ωj (j = 1, 3N − 6),
i (i = 1, N), ωj (j = 1, 3N − 6), ![[G with combining right harpoon above (vector)]](https://www.rsc.org/images/entities/b_i_char_0047_20d1.gif) j (j = 1, 3N − 6),
j (j = 1, 3N − 6),  target, and the masses as input. As output we obtain tj (j = 1, 3N − 6), Ej (j = 1, 3N − 6) aj(t), and the bond lengths vs. time.
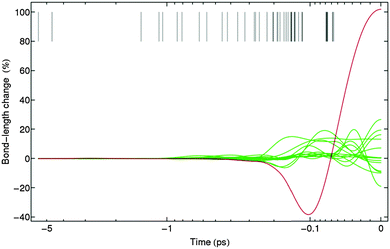
Fig. 7 shows the effect of the designed pulse train 3 on Model 1 for topoisomerase. Note that the bond between Cα and Cβ performs strong oscillations, while other bonds remain with fluctions under 25%. It has to be mentioned that a bond fluctuation of 20% is very likely to be enough to break the bond. However, we can scale down all bond fluctuations by requiring the maximum bond length at the target time to be 50%, for example. Taking into account that the optimization has been performed fully analytically and using a very simple fitness function (eqn (7)), this is a very good starting point and shows that the concept works. We show below that the improved fitness function together with its numerical treatment successfully avoids large fluctuations in the bonds that are not selected to be broken.
![[scr J, script letter J]](https://www.rsc.org/images/entities/char_e529.gif) ({Ej,φj}) eqn (11) using the SLSQP optimizer,28 which is a sequential least squares programming algorithm based on the Han–Powell quasi-Newton method. We used a friction parameter β = 47 cm−1 obtained from the Literature.29 In order to rule out a bias in the optimization algorithm we have also numerically optimized the fitness function
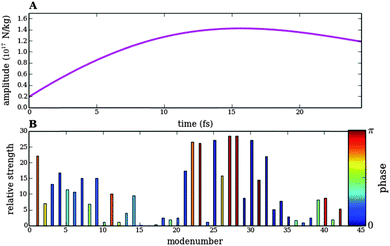
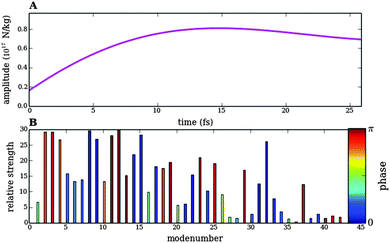
({Ej,φj}) eqn (11) using the SLSQP optimizer,28 which is a sequential least squares programming algorithm based on the Han–Powell quasi-Newton method. We used a friction parameter β = 47 cm−1 obtained from the Literature.29 In order to rule out a bias in the optimization algorithm we have also numerically optimized the fitness function ![[scr J, script letter J]](https://www.rsc.org/images/entities/char_e529.gif) ({Ej,φj}) using the L-BFGS-B algorithm,30 which basically gave the same results. Results of the relative bond elongations vs. time upon optimized pulse trains 1 and 3 as well as the shape, spectral density and phase of the optimized pulse trains are shown in Fig. 8–11.
({Ej,φj}) using the L-BFGS-B algorithm,30 which basically gave the same results. Results of the relative bond elongations vs. time upon optimized pulse trains 1 and 3 as well as the shape, spectral density and phase of the optimized pulse trains are shown in Fig. 8–11.
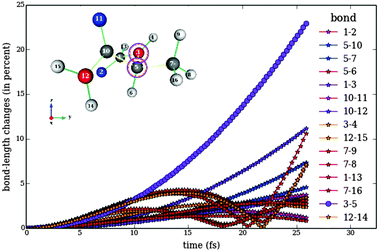 | ||
| Fig. 10 Analogous to Fig. 8 for the response of bond lengths to the numerically optimized pulse train 1. The violet line shows the bond length between atoms 3 and 5. This bond is elongated by almost 25% at the final time, whereas all other bonds are at most elongated by 12%. | ||
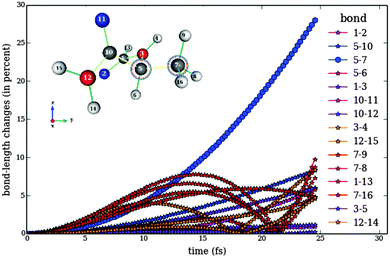
Fig. 8 shows the behaviour of the bonds in Model 1 of topoisomerase as a function of time upon application of the pulse train 3, designed to break the bond between Cα and Cβ (Fig. 5). Fig. 8 has to be compared to Fig. 7, since both show the response of Model 1 to differently optimize pulse trains designed to break the same bond. It is clear that the fitness function ![[scr J, script letter J]](https://www.rsc.org/images/entities/char_e529.gif) ({Ej,φj}) works much better than
({Ej,φj}) works much better than ![[scr F, script letter F]](https://www.rsc.org/images/entities/char_e141.gif) ({Ej}), since it forces all not selected bonds to perform small oscillations during the whole time. Another important difference between the analytical and the numerical optimizations is given by the time-scale. Whereas the pulse trains designed analytically have a total width of several picoseconds, the numerical optimization is able to produce selective bond breaking on the femtosecond scale. However, the numerical optimization is not restricted to ultrashort time scales. The width of the pulse train can be varied in eqn (11).
({Ej}), since it forces all not selected bonds to perform small oscillations during the whole time. Another important difference between the analytical and the numerical optimizations is given by the time-scale. Whereas the pulse trains designed analytically have a total width of several picoseconds, the numerical optimization is able to produce selective bond breaking on the femtosecond scale. However, the numerical optimization is not restricted to ultrashort time scales. The width of the pulse train can be varied in eqn (11).
Fig. 9 shows the numerically optimized pulse train 3. The pulse envelope has a smooth shape, while the spectral density indicates that frequencies resonant with certain vibrational modes of Model 1 have a large contribution.
Finally, in Fig. 10 and 11 we show results for the numerical optimization of pulse train 1 designed to break the bond between Nbb and Cα (Fig. 5). Again, all other bonds only perform small oscillations upon excitation by the optimized pulse train. The time scale of the pulse lies also on the femtosecond scale, and the spectral density of the tailored pulse train 1 shows remarkable differences with respect to optimized pulse 3.
Conclusions and outlook
In this paper we have presented a proof of concept on the viability of breaking bonds in biological systems using tailored electromagnetic radiation. We have focused on a few atom model for the active site of bacterial DNA topoisomerase.We have also shown the influence of the structure and environment on vibrational frequencies of specified bonds of the peptide structure and demonstrated that pulsed electric fields cannot achieve selective bond breaking.
We believe that this concept can be applied to larger systems, including anharmonicities. Note that in this work we have implicitly used the dipole approximation for the coupling between the vibrational modes and the electromagnetic pulses (since the quantities Ei are assumed to be not dependent on the spatial coordinates). For treating larger systems, the spatial dependence of the electromagnetic fields has to be taken into account.
Another important issue to be mentioned here is the fact that the density of vibrational states in real anharmonic systems grows tremendously as the dissociation limit is reached, leading to more energy exchange between different modes. This can reduce the control efficiency. For this reason we required in our calculations energy concentration on the target bond to occur within the shortest possible time (Fig. 8 and 10).
When applying our scheme to force fields containing anharmonicities, this requirement will be of fundamental importance, since many processes, which are difficult to control, like damping, inter-mode energy exchange and internal vibrational relaxation (IVR), take place on longer time scales.
Author contributions
The manuscript was written through contributions of all authors. D.J. and J.T.S.C. contributed equally to the present work. Calculations were mainly performed by D.J., J.T.S.C., B.B. and P.A.F. under the supervision of M.E.G. and M.J.R. Results were discussed and interpreted by M.E.G., M.J.R. and S.P. M.E.G. and M.J.R. and S.P. wrote the paper. All authors have given approval to the final version of the manuscript.Disclaimer
Shekhar Patel is an employee of PepsiCo Inc. The views expressed in this manuscript are those of the authors and do not necessarily reflect the position or policy of PepsiCo Inc.Acknowledgements
JTSC would like to thank the FCT. All authors wish to acknowledge financial support by PepsiCo®. MEG thanks Stella Pede for improving the layout of figures and the text.Notes and references
- D. Voss, Phys. Rev. Focus, 5, 1 Search PubMed.
- S. Wada, H. Kizaki, Y. Matsumoto, R. Sumii and K. Tanaka, J. Phys.: Condens. Matter, 2006, 18, S1629 CrossRef CAS.
- B. Amstrup and N. E. Henriksen, J. Chem. Phys., 1996, 105, 9115 CrossRef CAS PubMed.
- B. K. Shandilya, S. Sen, T. Sahoo, S. Talukder, P. Chaudhury and S. Adhikari, J. Chem. Phys., 2013, 139(3), 034310 CrossRef PubMed.
- (a) J. C. Wang, Nat. Rev. Mol. Cell Biol., 2002, 3(6), 430–440 CrossRef CAS PubMed; (b) J. J. Champoux, Annu. Rev. Biochem., 2001, 70, 369–413 CrossRef CAS PubMed; (c) S. M. Vos, E. M. Tretter, B. H. Schmidt and J. M. Berger, Nat. Rev. Mol. Cell Biol., 2011, 12(12), 827–841 CrossRef CAS PubMed.
- (a) Y. Pommier, E. Leo, H. Zhang and C. Marchand, Chem. Biol., 2010, 17(5), 421–433 CrossRef CAS PubMed; (b) P. Forterre, S. Gribaldo, D. Gadelle and M.-C. Serre, Biochimie, 2007, 89(4), 427–446 CrossRef CAS PubMed.
- Y. Pommier, ACS Chem. Biol., 2012, 8(1), 82–95 CrossRef PubMed.
- A. Wada, Adv. Biophys., 1976, 9, 1–63 CAS.
- P. Ojeda-May and M. E. Garcia, Biophys. J., 2010, 99, 595–599 CrossRef CAS PubMed.
- R. S. Judson and H. Rabitz, Phys. Rev. Lett., 1992, 68, 1500–1504 CrossRef CAS; K. Moore and H. Rabitz, Nat. Chem., 2012, 4, 72–73 CrossRef PubMed.
- R. Mitrić and V. Bonačić-Koutecký, Phys. Rev. A: At., Mol., Opt. Phys., 2007, 76, 031405 CrossRef.
- A. Changela, R. J. DiGate and A. Mondragon, Nature, 2001, 411(6841), 1077–1081 CrossRef CAS PubMed.
- (a) H. J. C. Berendsen, D. van der Spoel and R. van Drunen, Comput. Phys. Commun., 1995, 91(1–3), 43–56 CrossRef CAS; (b) D. Van der Spoel, E. Lindahl and B. Hess, et al., GROMACS User Manual version 4.6.1 2013, http://www.gromacs.org Search PubMed; (c) D. Van Der Spoel, E. Lindahl, B. Hess, G. Groenhof, A. E. Mark and H. J. C. Berendsen, J. Comput. Chem., 2005, 26(16), 1701–1718 CrossRef CAS PubMed.
- W. Zhao, Y. Tang, L. Lu, X. Chen and C. Li, Food Bioprocess Technol., 2014, 7(1), 114–125 Search PubMed.
- M. J. Ziegler and P. T. Vernier, J. Phys. Chem. B, 2008, 112(43), 13588–13596 Search PubMed.
- G. Lamoureux, J. A. D. MacKerell and B. Roux, J. Chem. Phys., 2003, 119(10), 5185–5197 Search PubMed.
- M.-F. Jeng, A. P. Campbell, T. Begley, A. Holmgren, D. A. Case, P. E. Wright and H. J. Dyson, Structure, 1994, 2(9), 853–868 Search PubMed.
- M. Born, in Dynamical Theory of Crystal Lattices, ed. K. Huang, Oxford University Press, New York, 1994 Search PubMed.
- I. Grigorenko, M. E. Garcia and K. H. Bennemann, Phys. Rev. Lett., 2002, 89, 233003 Search PubMed.
- I. Grigorenko, O. Speer and M. E. Garcia, Phys. Rev. B: Condens. Matter Mater. Phys., 2002, 202(65), 235309 Search PubMed.
- (a) T. M. Watson and J. D. Hirst, J. Phys. Chem. A, 2003, 107(35), 6843–6849 Search PubMed; (b) A. Barth and C. Zscherp, Rev. Biophys., 2002, 35(4), 369–430 Search PubMed.
- (a) V. Barone and M. Cossi, J. Phys. Chem. A, 1998, 102(11), 1995–2001 Search PubMed; (b) M. Cossi, N. Rega, G. Scalmani and V. Barone, J. Comput. Chem., 2003, 24(6), 669–681 Search PubMed.
- (a) A. D. Becke, J. Chem. Phys., 1993, 98(7), 5648–5652 Search PubMed; (b) C. Lee, W. Yang and R. G. Parr, Phys. Rev. B: Condens. Matter Mater. Phys., 1998, 37, 785–789 Search PubMed; (c) S. H. Vosko, L. Wilk and M. Nusair, Can. J. Phys., 1980, 58(8), 1200–1211 Search PubMed; (d) P. J. Stephens, F. J. Devlin, C. F. Chabalowski and M. J. Frisch, J. Phys. Chem., 1994, 98(45), 11623–11627 Search PubMed.
- (a) R. Ditchfie, W. J. Hehre and J. A. Pople, J. Chem. Phys., 1971, 54(2), 724 Search PubMed; (b) P. C. Hariharan and J. A. Pople, Theor. Chim. Acta, 1973, 28(3), 213–222 Search PubMed; (c) P. C. Hariharan and J. A. Pople, Mol. Phys., 1974, 27(1), 209–214 Search PubMed.
- A. L. Magalhães, S. R. R. S. Madaíl and M. J. Ramos, Theor. Chem. Acc., 2000, 105(1), 68–76 Search PubMed.
- A. P. Scott and L. Radom, J. Phys. Chem., 1996, 100(41), 16502–16513 Search PubMed.
- M. J. Frisch, G. W. Trucks, H. B. Schlegel, G. E. Scuseria and M. A. Robb, et al., Gaussian 09, Revision A.02., 2009 Search PubMed.
- E. Jones, T. Oliphant and P. Peterson, et al., SciPy: Open source scientific tools for Python, 2001, http://www.scipy.org Search PubMed.
- S. Hayward and N. Go, Annu. Rev. Phys. Chem., 1995, 46(1), 223–250 Search PubMed.
- R. H. Byrd, P. Lu and J. Nocedal, SIAM J. Sci. Stat. Comput., 1995, 16(5), 1190–1208 Search PubMed.
Footnote |
| † Electronic supplementary information (ESI) available: Extended description of the protocol and equations employed for this study. Additional results considering the MD simulations with electric fields and vibrational frequency analysis. See DOI: 10.1039/c4cp02289k |
| This journal is © the Owner Societies 2014 |

