 Open Access Article
Creative Commons Attribution 3.0 Unported Licence
Structure prediction of nanoclusters; a direct or a pre-screened search on the DFT energy landscape?
M. R.
Farrow
,
Y.
Chow
and
S. M.
Woodley
*
Department of Chemistry, Kathleen Lonsdale Materials Chemistry, University College London, 20 Gordon Street, London WC1H 0AJ, UK. E-mail: scott.woodley@ucl.ac.uk
First published on 3rd July 2014
Abstract
The atomic structure of inorganic nanoclusters obtained via a search for low lying minima on energy landscapes, or hypersurfaces, is reported for inorganic binary compounds: zinc oxide (ZnO)n, magnesium oxide (MgO)n, cadmium selenide (CdSe)n, and potassium fluoride (KF)n, where n = 1–12 formula units. The computational cost of each search is dominated by the effort to evaluate each sample point on the energy landscape and the number of required sample points. The effect of changing the balance between these two factors on the success of the search is investigated. The choice of sample points will also affect the number of required data points and therefore the efficiency of the search. Monte Carlo based global optimisation routines (evolutionary and stochastic quenching algorithms) within a new software package, viz. Knowledge Led Master Code (KLMC), are employed to search both directly and after pre-screening on the DFT energy landscape. Pre-screening includes structural relaxation to minimise a cheaper energy function – based on interatomic potentials – and is found to improve significantly the search efficiency, and typically reduces the number of DFT calculations required to locate the local minima by more than an order of magnitude. Although the choice of functional form is important, the approach is robust to small changes to the interatomic potential parameters. The computational cost of initial DFT calculations of each structure is reduced by employing Gaussian smearing to the electronic energy levels. Larger (KF)n nanoclusters are predicted to form cuboid cuts from the rock-salt phase, but also share many structural motifs with (MgO)n for smaller clusters. The transition from 2D rings to 3D (bubble, or fullerene-like) structures occur at a larger cluster size for (ZnO)n and (CdSe)n. Differences between the HOMO and LUMO energies, for all the compounds apart from KF, are in the visible region of the optical spectrum (2–3 eV); KF lies deep in the UV region at 5 eV and shows little variation. Extrapolating the electron affinities found for the clusters with respect to size results in the qualitatively correct work functions for the respective bulk materials.
1 Introduction
The prediction of the atomic structure of materials is of fundamental importance. This is particularly true for nanoclusters as they can exhibit substantially different chemical and physical properties compared to bulk phases. An understanding of the possible structural changes that arise as a function of the nanocluster size can lead to the discovery of new materials with desirable properties.1 For example, it is known that the optical properties of nanoclusters vary with size, providing an alternative “tuning” parameter over conventional methods such as using dopants in the bulk structures.2 Obtaining the structural information for small nanosized particles from experiment is, however, extremely difficult. Therefore, computer simulations are often used as a complementary predictive tool or an aid in the analysis of experimental observations. The goals of this study are to (1) optimise the use of computationally demanding ab initio calculations that are employed to assess the quality of trial structures during the search for atomic structures of nanoclusters, and (2) report and compare the structure and properties of these nanoclusters.Global optimisation techniques have been adapted to explore energy landscapes and tuned to locate efficiently the lowest energy structures. The most common structure prediction methods include: Monte-Carlo basin hopping,3–5 random (or stochastic) quenching,6–8 simulated annealing,9–12 evolutionary algorithms (also called genetic algorithms),13–15 and particle swarm algorithms.16–18 Evolutionary algorithms (EA), which are employed in the work reported here, have been used for structure prediction with much success using both interatomic potentials19–22 and ab initio13,23–28 levels of theory to describe the energy landscape. Informative reviews of structure prediction techniques have been reported by Woodley,1 Johnston29,30 and more recently by Catlow et al.31 Previous studies have focussed on the method of exploring a fixed energy landscape, i.e. one or more methods applied to a particular system, whereas few studies have focused on the effect of changing the quality of the energy function. Mainstream global optimisation in the field of structure prediction is typically applied to searching the energy landscapes defined by interatomic potentials, and subsequently the better structures are refined at a higher level of theory, such as DFT.32 With greater availability of structural data for bulk rather than nanoclusters, interatomic potential parameters are generally fitted to reproduce bulk properties. When the atomic structure of nanoclusters is predicted to be different to the local structure found within the bulk phase, then it may be beneficial to refine the interatomic potential parameters to reproduce DFT energy minima nanoclusters.33–35
In this paper, switching the definition of the cost function (e.g. energy of formation) used to assess the quality of a particular atomic configuration during the global optimisation stage is investigated. Two different approaches to searching energy landscapes are compared for a range of binary compounds. In each approach both stochastic quenching and a Lamarckian evolutionary algorithm, as implemented within the Knowledge Led Master Code (KLMC),36 are tested. Both approaches sample many candidate structures and both utilise standard local optimisation routines to relax the atomic configuration of each sample point to an energy minimum.
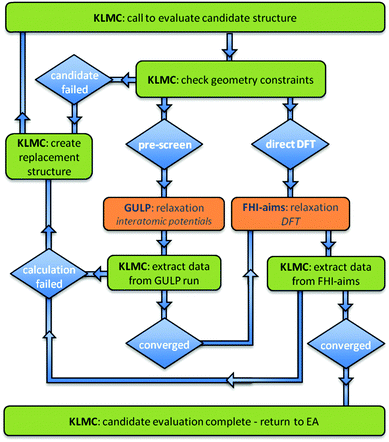
In the first approach, an initial structural relaxation is performed at an interatomic potential level, and if the resulting energy is below a certain threshold then that candidate structure is further refined at the DFT level, i.e. the sample points are pre-screened. This approach of searching a hybrid landscape is applied here to configurations of ZnO and MgO. A similar approach is employed by others (see e.g.ref. 37). As these two compounds have been studied extensively, they provide a suitable set of test structures for the structure prediction module of KLMC. This type of pre-screening is one of a broad family of techniques to assess the quality of candidate structures, which include geometrical, simple-potential, tight-binding, and semi-empirical methods.
The second approach is to perform a direct search on the DFT energy landscape, although simple geometrical constraints – atoms must be at least a typical bond distance apart – are applied. This approach is employed for four binary compounds: ZnO, MgO, KF, and CdSe. These compounds are used in a wide range of industrial processes: zinc and magnesium oxides are basic components in catalysts,38,39 potassium fluoride is used in the manufacturing industry for brazing aluminium,40 and cadmium selenide is used as a principle component in solar cells.41 These materials differ in their polarisability – from strongly polarisable CdSe to weakly polarisable KF – and thus offer contrasting energy landscapes, and, at the nanoscale, may have a broad range of structural motifs. For the computational cost of assessing each sample point on a DFT landscape many more can be assessed on the semi-empirical landscape. In contrast to CdSe, suitable empirical potentials are already available for MgO and ZnO and their landscapes have already been explored.20,30 Thus, MgO and ZnO were chosen as our initial test systems.
2 Method
2.1 KLMC program – combining global and local optimisations
All of the nanoclusters presented in this work were obtained using the Knowledge Led Master Code (KLMC).36 KLMC has been written in FORTRAN90 as one program, which uses MPI and SYSTEM calls. In common with other similar software for global optimisation,21 in order to (a) compute energies and (b) compute and minimise (using standard local optimisation routines) forces on the atoms, KLMC can call a range of state-of-the-art third party software (TPS) packages.As well as containing routines for global optimisation, KLMC, in the first instance, is a computational tool for the automation of many tasks that traditionally have had to be done by hand. Basic examples include: creation of input files for TPS; submission of calculations using TPS on either local or external computer platforms; monitoring progress of calculations performed by TPS; extraction of data from TPS output files for use in other KLMC routines or TPS; and, if required, the resubmission of uncompleted jobs (in an appropriate way so as to balance the workload over all available nodes). The evaluation of a set of structures stored as xyz file(s) – creation of input files, feeding through the chosen TPS, and collection of energies – is, perhaps, the simplest application of KLMC.
Routines within KLMC can also be employed to automate multistage optimisations (as used in this study), wherein the energy and atomic forces are computed at different levels of theory during the relaxation of each candidate structure, i.e. after a set number of line minimisations (iterations) or once a particular tolerance is achieved, the level, and therefore the computational load, is increased, and the relaxation of the structure is continued at this higher level. KLMC can therefore be seen as a tool to chain optimisation iterations together at differing levels of theory. Moreover, with the range of available global optimisation routines, KLMC has been developed to enable the flexibility of searching either on the interatomic potential energy landscape, on DFT energy landscape, or on DFT energy landscape after initial refinement at the interatomic potential energy level, i.e. pre-screening candidate structures prior to refining at the DFT level. The first application, of chaining two energy functions within the Monte Carlo basin hopping routines of KLMC, enabled the successful prediction of low energy atomic structures of LiF3 nanoclusters.36 During the evaluation of each candidate structure, standard local optimisation techniques were used to minimise the energy as defined by a rigid ion model in the initial iterations and a shell model in the final iterations.
In this work, KLMC is used to search the DFT landscape or the hybrid landscape resulting from chaining a rigid ion mode with DFT. Calculations at the interatomic potential level of theory are performed by the General Utility Lattice Program (GULP),42,43 whereas for the DFT level of theory, a bespoke library version of the numeric basis set computer program FHI-aims (version 071711_6) is employed.44 Parallel versions of both these TPS are available; for GULP, however, the less computationally demanding of the two, the serial version was used in this work.
As the chosen search algorithms are amenable to simultaneous evaluations of multiple sample points (configurations), a Message Passing Interface (MPI) parallelism strategy has been employed within KLMC in order to exploit many processors on high performance computing (HPC) platforms (large-scale supercomputers). Thus, KLMC makes simultaneous calls to GULP. The bespoke FHI-AIMS library enables a more efficient approach than having KLMC employ a “system call” to start each run of FHI-AIMS. Although there is an added risk that the TPS can crash KLMC (the TPS must pass back control to KLMC and not make a call to “STOP”), the library approach avoids a potential problem caused by HPC platforms, namely, that MPI system calls are not allowed unless made on the head node(s), i.e. from the originally submitted script and not from KLMC. We note that KLMC also has a client-server capability such that KLMC can run on a local desktop machine whilst the computationally expensive DFT calculations can be sent to and retrieved automatically from a remote supercomputer for processing (which also avoids non-head node MPI calls).
In this work, a Lamarckian evolutionary algorithm (EA), as implemented within KLMC, is employed to search the energy landscapes. Within an EA, the natural selection processes of “survival and procreation of the fittest” is simulated, where the metric of fitness for our application is the energy of the nanocluster. Ideas of Lamarck rather than Darwin are adopted; genetic information – in the form of structural coordinates – that has matured (aged) is used to create new offspring. Here, the aging process of a child becoming an adult is simulated by the application of standard local optimisation routines to relax the atomic structure. While this method of evaluating each candidate structure is computationally more expensive, cf. single energy calculations in Darwinian global optimisation, fewer candidate structures need to be evaluated, and all matured candidates (adults) are at least stationary points on the energy landscape. Typically, the overall efficiency of locating the lower energy minima is greatly improved.45–47
The starting point for an EA – see Fig. 1 – is the generation of an initial set of representative structures, or initial population, which should ideally span the full potential energy surface. There is no unique way to generate the initial coordinates; one could use previously known structures out of a database or extract candidate structures from a high temperature molecular dynamics simulation at sufficiently spaced points of time. For the work presented in this manuscript, initial candidate structures were created, at minimal computation cost, by randomly placing the appropriate number and type of atoms in a cube with length between 4 Å, for the smallest clusters, and 10 Å, for the largest. During this process, a constraint was imposed that a distance of at least 80% of a typical bond length must separate all atoms to prevent unfeasibly dense structures being created, which could cause problems with the DFT optimisations. Expanded structures benefit from the initial increased mobility of atoms as they have more room to move during geometry optimisation. This restriction also prevents randomly placing two metal cations next to each other, which would result in the DFT predicting an unwanted formation of a metal–metal bond.
During each cycle of the EA, the current population of m members (labelled as the “Nth population” in the flow chart) is replaced by the unique lowest energy structures recruited both from the current and the “New adult population”. Note that duplicates (based on comparing energies and moments of inertia) are actively removed to help to maintain structural diversity in the population. In each EA cycle, before Action 5 (“Tournaments for survival”) can be performed, KLMC generates m candidate structures that form the “Child population”, which subsequently matures to become the “New adult population”. Details of how each candidate matures or how each candidate is evaluated, are given below and shown as a flow chart in Fig. 2. From the current population, tournaments are simulated within sets of three candidates chosen at random. The best structure in each set, one with the lowest minimised energy, is recruited in the “Population of winners”. Action 1 of each EA cycle is repeated m times; the resulting population of winners may include the same structure more than once. Each member of the “Population of winners” is paired with one randomly selected member of the current population and passed to Action 2 (the application of a crossover moveclass, which combines structural information from both parent members to create a new child candidate structure) and Action 3 (a mutation moveclass, which perturbs the resulting child structure to help to introduce new structural features).14 In particular, the crossover moveclass, used in this work, fuses a fragment from each parent structure to form a new structure – subject to forming a child structure with the same composition and total number of atoms as each parent. The mutation moveclass implemented in this study is a random displacement of each atom by up to a maximum of 1.0 Å from its original location.
The maximum number of EA cycles is set by the user, but can be reduced by either the time limit on runs on the chosen computer platform or the convergence of the Nth population (i.e. no improvements in the quality of the structures within consecutive populations). The population size, m, was typically set to either 10 or 16.
2.2 Assessment of candidate structures
ZnO nanoclusters have been investigated in previous work using interatomic potentials, where the atomic structures were predicted using EA routines within the GULP code.20,48,49 These configurations were also found using DFT methods,50 although for larger sized clusters the ranking (with respect to energy) of the nanoclusters differed slightly. In the current work, interatomic potentials are employed for ZnO and MgO during a pre-screening stage before evaluating the DFT energy. The chosen interatomic potentials include a number of superimposed terms: a Coulomb potential: | (1) |
 | (2) |
 | (3) |
| UPoly(rij) = a + brij + cr2ij + dr3ij + er4ij + fr5ij, | (4) |
| Lennard-Jones potentials (eqn (2)) | Range (Å) | A (eV Å12) | B (eV Å6) |
|---|---|---|---|
| Zn–Zn | 0.0–12.0 | 20000.0 | 30.0 |
| Zn–O | 0.0–2.20 | 316.435 | 0.0 |
| Mg–Mg | 0.0–12.0 | 1.0 | 0.0 |
| Mg–O | 0.0–12.0 | 10.0 | 0.0 |
| OZn–OZn | 0.0–12.0 | 0.0 | 0.0 |
| OMg–OMg | 0.0–12.0 | 1.0 | 0.0 |
| Buckingham potentials (eqn (3)) | Range (Å) | C (eV) | ρ (Å) | D (eV Å6) |
|---|---|---|---|---|
| Zn–O | 0.0–2.2 | 592.343 | 0.352 | 12.897 |
| Zn–O | 3.1–3.3 | 157.297 | 0.430 | 5.816 |
| Zn–O | 3.6–12.0 | 912.518 | 0.008 | 11.723 |
| Mg–O | 0.0–12.0 | 1428.50 | 0.295 | 0.0 |
| OZn–OZn | 0.0–12.0 | 23674.698 | 0.226 | 33.477 |
| OMg–OMg | 0.0–12.0 | 22764.0 | 0.149 | 27.88 |
| Polynomial (eqn (4)) | Range (Å) | a (eV) | b (eV Å−1) | c (eV Å−2) |
|---|---|---|---|---|
| Zn–O | 2.2–3.1 | 111.902 | −158.727 | 89.657 |
| Zn–O | 3.3–3.6 | 64102.354 | −93216.170 | 54188.807 |
| Polynomial (eqn (4)) | Range (Å) | d (eV Å−3) | e (eV Å−4) | f (eV Å−5) |
|---|---|---|---|---|
| Zn–O | 2.2–3.1 | −29.986 | 4.0 | −0.178 |
| Zn–O | 3.3–3.6 | −15741.071 | 2284.837 | −132.581 |
Structural relaxation during the pre-screening stage was achieved using the method of conjugate gradients until the resultant atomic forces were less than 10−2 eV Å−1, which typically results in an energy point near a stationary point, thereafter the more advanced rational function optimisation algorithm was used to ensure that the stationary point is either stable or metastable and forces are less than 10−7 eV Å−1.
After the population of candidates have been pre-screened, the structures are further refined at the DFT level; KLMC calls FHI-aims, rather than GULP. All of the calculations were performed with the FHI-aims default “light” settings for species specific basis sets (analogous with split valence and double zeta basis sets used in conventional Gaussian codes) and grids combined with a scalar ZORA relativistic treatment.54 During relaxations, the restricted wavefunction description was employed to discourage fragmentation of clusters, and energies were converged to within 1 meV per atom. Typically, the solids-corrected Perdew–Burke–Ernzerhof (PBEsol) Generalised Gradient Approximation (GGA) exchange–correlation functional was employed.55 PBEsol was chosen as it is unbiased and is not too computationally expensive. The aim is to develop a method that is generically applicable rather than tuned to a particular system or property. A quasi-Newtonian relaxation algorithm was used with a convergence criterion of 10−3 eV Å−1.
3 Results
3.1 Atomic structures and properties of (AB)n nanoclusters
Four binary compounds are investigated: KF, MgO, ZnO and CdSe. The atomic structures of their nanoclusters may depend on the relative size of the cation and anion, the degree of ionic character of the bonding, as well as the oxidation state and polarisability of the ions. Table 2 contains the differences in the electronegativity56 of the atoms in each binary, ΔX, which gives a measure of the ionic character of a bond between them. Data in Table 2 is arranged with respect to increasing ΔX, and not surprisingly the greatest ionic character is expected for K–F bonds. The dissociation energy of a dimer and the refractive index of the binary compound also increase, from CdSe, ZnO, MgO to KF. The refractive index gives a measure of how polarisable the atoms are in the bulk phase, and therefore how polarisable we expect the atoms will also be when part of a nanocluster. Comparing cationic and anionic radii, K+ is larger than F−, whereas it is the reverse for CdSe; Cd2+ is smaller than Se2−. If the ratio of ionic radii is the dominant factor determining the atomic structure, then we may expect similar nanoclusters for MgO and ZnO, and that the ordering of cations and anions in a particular structural motif for KF and CdSe to be reversed.| Compound | X B –X A | R B /R A | D (kJ mol−1) | n r |
|---|---|---|---|---|
| CdSe | 0.86 | 2.08 | 123.9 | 65.67 |
| ZnO | 1.79 | 1.89 | ≤246.3 | 75.40 |
| MgO | 2.13 | 1.94 | 354.5 | 80.04 |
| KF | 3.16 | 0.96 | 485.5 | 94.66 |
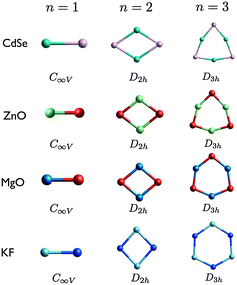
The lowest DFT energy nanoclusters of four compounds – ZnO, MgO, KF and CdSe – obtained using KLMC, with either the direct or pre-screening approach, are shown in Fig. 3 to 8.59 As well as ordering by size and rank, the images of the clusters are also arranged such that the least polarisable compound (KF) are shown at the bottom, and the most polarisable (CdSe) at the top, of each figure. The structural motifs for ZnO and MgO nanocluster agree with previous work.19,20,37,60–62 Likewise for CdSe nanoclusters.63 KF nanoclusters have received much less attention in the literature, and therefore comparison is made with those reported for (LiF)n, (NaCl)n, (NaCl)nCl− and (MgO)n when constituents are modelled as Mg+ and O−.19,28,64,65 A more detail comparison of the LM with those reported elsewhere is given below. For each size and compound, the lowest energy, local minimum (LM), nanocluster is referred to as the GM (putative global minimum), the second lowest energy structure is referred to as LM2, and the third lowest energy structure is referred to as LM3.
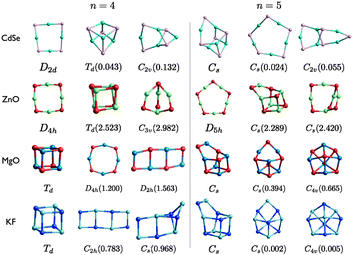 | ||
| Fig. 4 (CdSe)n, (ZnO)n, (MgO)n, and (KF)n lowest PBEsol energy nanoclusters, for n = 4–5. Energy differences from the GM (in eV) are given in brackets, and notations and colours are as in Fig. 3. | ||
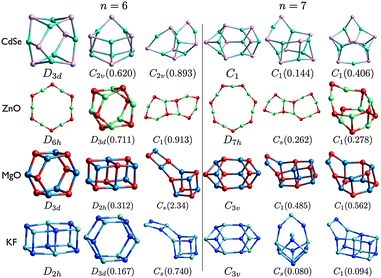 | ||
| Fig. 5 (CdSe)n, (ZnO)n, (MgO)n, and (KF)n lowest PBEsol energy nanoclusters, for n = 6–7. Energy differences from the GM (in eV) are given in brackets, and notations and colours are as in Fig. 3. | ||
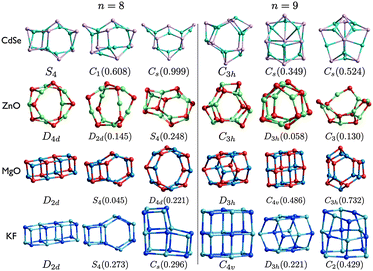 | ||
| Fig. 6 (CdSe)n, (ZnO)n, (MgO)n, and (KF)n lowest PBEsol energy nanoclusters, for n = 8–9. Energy differences from the GM (in eV) are given in brackets, and notations and colours are as in Fig. 3. | ||
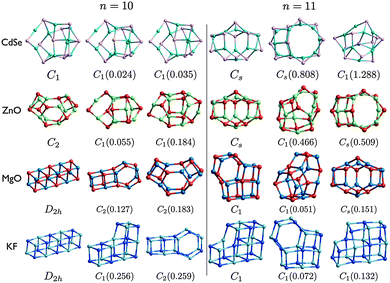 | ||
| Fig. 7 (CdSe)n, (ZnO)n, (MgO)n, and (KF)n lowest PBEsol energy nanoclusters, for n = 10–11. Energy differences from the GM (in eV) are given in brackets, and notations and colours are as in Fig. 3. | ||
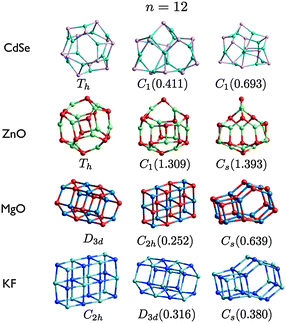 | ||
| Fig. 8 (CdSe)n, (ZnO)n, (MgO)n, and (KF)n lowest PBEsol energy nanoclusters, for n = 12. Energy differences from the GM (in eV) are given in brackets, and notations and colours are as in Fig. 3. | ||
| Compound | L 1 (Å) | E b (eV) | L 2 (Å) | θ (°) |
|---|---|---|---|---|
| CdSe | 2.35 | 2.04 | 2.46 | 65.67 |
| ZnO | 1.68 | 3.80 | 1.87 | 75.40 |
| MgO | 1.73 | 4.39 | 1.90 | 80.04 |
| KF | 2.17 | 6.37 | 2.36 | 94.66 |
The first three smallest GM nanoclusters are shown in Fig. 3. For each size, the same structural motif is found for all four compounds. The shape of the n = 3 ring for KF is comparable to the rigid ion model of (ZnO)3, i.e. a model that does not include polarization effects. When a shell model is used anions are displaced further out from the centre than the cations, resulting in the structure generated for (ZnO)3 using FHI-aims.20
The DFT binding energy of an n = 1 cluster is presented in Table 2, which gives a measure of the strength of the dimer bond, calculated here with a restricted Kohn–Sham orbital ansatz. The same rank of the dimers with respect to this calculated bond strength and the dissociation energies reported in Table 2 is found, i.e. CdSe has the weakest bond, ZnO and MgO the second and third weakest, whereas KF has the strongest bond. The lowering of the bond strength in oxide dimers from the fluoride, as well as the increased polarisation (more acute cation–anion–cation bond angles) can be readily understood as an effect of the negative second electron affinity of oxygen, which counteracts the Coulomb energy gain due to a transfer of an additional electron from the cation to the anion and bond shortening between the smaller sized ions. Continuing the trend, the bond strength of CdSe is weakened significantly while it is more easily polarised due to the much larger ionic sizes of both the cation and anion even though they retain the formal oxidation states of the respective metal oxides.
For n = 5, MgO and KF have the same structural motifs and corresponding ranks for the three lowest energy nanoclusters. The two lowest energy n = 5 clusters for ZnO and CdSe also have the same structural motif, but differ in their ranking.
The degree of polarisation is reflected in the appearance of the rings resembling more like a square (for n = 4) or a regular pentagon (for n = 5) than a regular octagon or regular decagon, respectively. Curiously, however, even though ZnO adopts the ring motif as its GM, CdSe has the same GM as MgO and KF. The balance between the destabilisation of strain and non-bonded repulsive interactions and the stabilisation of the attractive Cd–Se interactions for (CdSe)4 and (CdSe)5 reverses resulting in an increase in the average coordination with an increase in n. This structural transition of the GM from a 2D to a 3D motif occurs earlier for MgO and KF, between n = 3 and 4. ZnO GM nanoclusters remain 2D, as the lowest energy 3D structures are 2.5 eV and 2.4 eV higher in energy for n = 4 and n = 5, respectively. The LM2 for the other compounds are close in energy to the GM (within 1 eV). Note that the n = 4 ring structure for KF is actually ranked fourth lowest in energy, being 1.019 eV higher in energy than the GM.
The change in relative stability between tetragonal and the larger sized rings manifests in the appearance of ladders; the LM3 structure of MgO and LM2 structure for KF. The average coordination of the atoms within the ladders is also higher than that in the 2D-rings, but less than that in the cuboids. Thus, preferred coordination is also related to the stability and ranking of the clusters; Mg is less likely than Zn to be stable in a low coordinated site.60 For example, the different ranking in the lowest two n = 4 clusters and the structural motif of ZnO LM3, which has three two-coordinated cation sites, is unstable for MgO.
The structural motifs of all the low energy MgO clusters, shown in Fig. 5 and 6, can be found in clusters shown for one or more of the other compounds. The n = 7 LM3 motif is LM3 for ZnO and LM2 for CdSe; the n = 8 LM3 drum motif is the GM for ZnO; and n = 9 LM3 is the GM for both ZnO and CdSe. The other MgO motifs, including tubes and rock-salt cuts, are all found for KF. The n = 6 drum (double ring) is well known and appears in all the compounds (either GM or LM2), and has recently been shown to be important for hydrogen storage.66
For each size, at least one motif of the metastable low energy configurations shown for CdSe is not found elsewhere. In particular, even though the rock salt motif is not seen in the figures for CdSe, clusters with an average coordination number greater than three are competitive for (CdSe)9; there is a highly coordinated central Se in both LM2 and LM3.
The LM of (CdSe)10 are very similar (and probably contained within the same energy super-basin). LM2 has the same structural motif as LM2 for (ZnO), the right hand side of which (as viewed in Fig. 7) is the same as that in the n = 9 GM for ZnO and CdSe. The left hand side is composed of a tetragonal and a squashed hexagonal ring. If the central Se atom (highlighted by a yellow circle) is displaced to the centre of the cluster (changing the Cd–Se–Cd bond angle from convex to concave) and its coordination is increased by one then the motif of LM3 for CdSe is generated; increase the coordination of the Cd to the right of this Se to obtain the GM motif. Note that relaxation of initial (ZnO)10 geometries that are data-mined, without rescaling, from any of the three (CdSe)10 LM will generate same LM.
The ashtray motif for n = 10 ZnO GM is also the motif for MgO LM3. For CdSe and ZnO, the same n = 11 bubble motif is predicted as the GM, which is also the LM3 for MgO, and (CdSe)11 LM2 matches (ZnO)11 LM3. In general, low energy ZnO and CdSe nanoclusters adopt a bubble motif.
With the lowest dimensional and simplest landscapes (cf. larger sized clusters), it is not surprising the n = 1–3 GM found agree with that already reported.20,21,59–63
For our predicted atomic structures for (CdSe)n, there is a reasonable agreement with structures suggested by Sanville et al.63 Their CdSe configurations were data-mined from ZnS GM50,68 that correspond to our 1a, 2a, 3a, 4a, 5b, 6a, 7a, 8a, 9a, 11a and 12a for CdSe. Our 5a, which is also the GM for (ZnO)5, (MgO)5 and (KF)5, is only 0.024 eV lower in energy than our 5b for (CdSe)5. The largest discrepancy occurs for n = 10; no match is found between their (CdSe)10 bubble cluster (which has C3 symmetry) and any of our top three PBEsol (CdSe)10 LM. As discussed above, the three PBEsol LM are very similar and therefore have similar energies. The non-perfect – has two two-coordinated atoms – bubble motif is, however, LM2 for (ZnO)10 on the energy landscape of the rigid ion (parameters in Table 1) and shell model (SM),20 PBEsol LM3 for (ZnO)10, and found to be 0.07 eV less stable than our PBEsol (CdSe)10 GM.
The (ZnO)n atomic configurations are now compared to energy minima structures from a shell model (SM)20 that are obtained using an evolutionary algorithm implemented within GULP48,69 and PBE energy minima structures37 (optimised using the DMol code70,71), the initial configurations of which were either constructed (handmade) or local minima from a rigid ion model (potential parameters fitted to bulk ZnO). We expect optimised PBE and PBEsol structures to be very similar, and changes in energy ranking only possible when there is a small energy difference between LM. In fact there is a better agreement between our PBEsol results and the PBE than between PBEsol and SM. Starting from the smallest cluster size, the discrepancies between the latter are found for 5c, 6, 7, 8, 9c, 10b, 10c, 11b, 11c, 12b and 12c; whereas for the former we were not able to match 4c, 5b, 5c, 7c, 8a, 8b, 9c, 10b, 10c, 11b, 11c, 12b and 12c. The lowest energy SM metastable LM have higher symmetry than that predicted for PBEsol LM. Many of the mismatches for the smaller clusters are caused by the SM employed erroneously containing additional LM.60 Removing these LM, the match improves; for example, the motifs for the three lowest energy n = 6 and 8 clusters are now the same although the rank of the n = 6 ring and drum are reversed and the n = 8 SM GM is our PBEsol LM3. Allowing for polarization on the oxygen anions, the rank of 2D configurations deteriorate, which curiously leads to a better match of our n = 7 PBEsol LM with that of a rigid ion model. Typically, Wang et al. reports more than three PBE LM per cluster size.37 Many of the mismatches between our top three PBEsol LM and that of PBE is probably due to missing PBE LM, which would result in a larger PBE (smaller PBEsol) energy difference between LM when there is a mismatch. For example, the PBE (PBEsol) energy difference, in eV, between 4b and 4c, 5a and 5b, 9a and 9c, 10a and 10b, 11a and 11b, 12a and 12c is 1.1 (0.5), 2.4 (0.4), 0.5 (0.1), 0.2 (0.1), 0.9 (0.5), 1.8 (1.4), respectively. A change in rank is also caused by the change in the cost function, for example, 7c and 7d, which have very similar energies, are reversed. A larger change in ranking is found for metastable n = 10 LM; PBE and SM have a C3 and a C2k bubble for 10b and 10c, whereas these are 0.245 eV and 0.406 eV higher in energy than the PBEsol GM. Finally, the reported PBE 8a structure, 2D patchwork of two n = 4 rings connected via the formation of a n = 2 ring, is 0.466 eV higher in PBEsol energy than our GM. Wang et al. do comment37 that previous B3LYP calculations50,72 suggest that the tube-like motif is more stable. Using PBE, we find that the 2D patchwork is still less stable than the drum, although only by 0.017 eV, so suspect that the default cutoffs used for basis functions (double numerical including d-polarization functions, DND70,71) in their PBE calculations may have been too small.
The (MgO)n atomic configurations are now compared to: rigid ion (RI) LM (that were proposed alongside mass spectra of (MgO)n+ clusters);73 Hartree–Fock (HF) and, with correlation corrections, Coulomb Hartree–Fock (CHF)74 LM (optimised from initial geometries created by cutting from bulk phases or data-mining from alkali–halide clusters after initial pair potential calculations);75 PBE energy minima structures (optimised using DMol from initial geometries constructed using a topological method based on predefined range of coordination numbers); and B3LYP LM61 (optimised using TURBOMOL, where initial geometries were generated using a genetic algorithm76). There is a 42% match between our 12 PBEsol GM and the reported RI LM; the low match is caused by both the change in the model employed and perhaps key motifs missing from their dataset. There were fewer mismatches between the HF and CHF GM: HF 5a is a 2D ring; CHF (MgO)7 GM matches our 7b; a D4d drum and S4 bubble motifs are the (MgO)8 GM for HF and CHF, whereas the rock salt PBEsol GM is their LM3; and the Th sodalite cage is the HF and CHF (MgO)12 GM. As expected, an also perfect match is found between our PBEsol LM (shown earlier in Fig. 1–5) and the PBE reported LM; our 5b is the only missing cluster from their set, and 7b and 7c are reversed. We have also used PBE for MgO clusters and found a small number of changes in their ranking; 7b with 7c, 8a and 8b, 11a and 11c, and PBE 12b is the sodalite cage. Clusters with the same structural motifs are reported for both PBEsol and B3LYP LM, only the ranking differs such that the GM do not match for n = 8, 10, 11, and 12. What is more important here is the match between experimental and simulated infra-red (IR) spectra that Haertelt et al. have achieved in order to validate their predicted (MgO)n atomic structures. As we obtain clusters with the same structural motif, we are able to gain confidence in our predicted PBEsol structures resembling those synthesized. As expected, contributions to each spectrum may be from more than one of the lowest LM, and the dominate contribution is typically from the B3LYP GM. The B3LYP 8a matches our 8b (in fact there is a very small PBEsol energy difference between 8a and 8b); B3LYP 10a matches our 10c; B3LYP 11a matches our 11c (however the structural match with our 11a is also used in their simulated IR); and B3LYP 12a is again the sodalite cage. Interestingly, it appears that the dominate contributions to the n = 12 IR spectrum comes from the cluster that matches our PBEsol GM.
A rock-salt (ring) structural motif is found for the larger (smallest) PBEsol (KF)n GM, which is in line with that reported for clusters of other alkali halides.65,77 This trend is consistent with the findings of Roberts and Johnston,19 where the relative stability of bubble and rock-salt motifs are reversed when the magnitude of the charges on the atoms is reduced from 2 to 1. Our GM also match that reported by Fernandez-Lima et al.28 who employed a genetic algorithm to search for B3LYP LM for n = 1 to 4. They also reported a number of other LM for larger sizes; their lowest energy LM match our 5a, 6b, and 9a. Their n = 8 drum cluster was slightly more stable than their 3 × 1 × 1 cuboid (LiF)8 cluster, and degenerate after correcting for zero point energy.
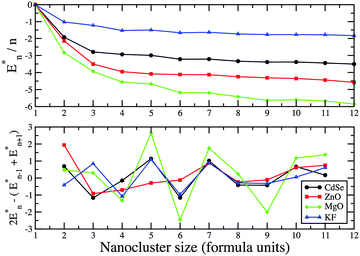 | ||
| Fig. 9 PBEsol energy difference, En* = En − nE1, and the second energy difference of (AB)n GM nanoclusters. | ||
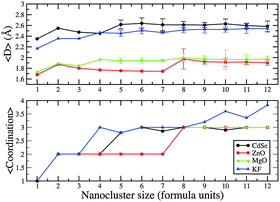
From n = 1 to n = 12, the average coordination number of the constituent atoms in the (AB)n GM form a set of plateaux and gradually increases for larger KF clusters (which have a rock-salt rather than a bubble or tube motif); see Fig. 10. The plateaux correspond to the dimensionality of the cluster (1D, 2D then 3D); hence the longer plateau for 2D (ZnO)n. The average bond distance, 〈D〉, also increases when the dimensionality of the cluster increases, but gradually decreases with increasing n otherwise. When clusters have the same dimensionality, 〈D〉 for MgO is slightly longer than for ZnO (which has the smallest value), KF is slightly smaller than those for CdSe (which has the longest value).
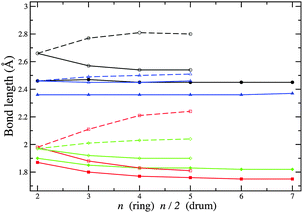
Any subtle differences between compounds can be masked by a change in structural motif. In Fig. 11 and 12, the change in bond lengths and bond angles for rings and double rings (drums) are shown as a function of size for each compound. The bond lengths within rings or the larger rings of the drums decrease with increasing ring size. However, bonds connecting two such rings in the formation of a drum lengthen with increasing n. The rate of change of the latter is greater for ZnO drums and then for CdSe, which suggests a greater destabilisation of drums compared to rings (note that there are one more ring GM for CdSe and four for ZnO). The differences in relaxed and ideal bond angles of the rings, which increase along the series KF, MgO, ZnO and CdSe, reflect the strength of the polarisation. Note that the bond angles centred on anions are more acute than those centred on cations. The same trend is found for angles within the large rings of the drums, but the opposite trend is found for the tetragonal faces; these become more regular (square) with cluster size.
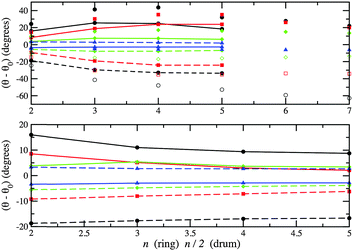 | ||
| Fig. 12 Differences between PBEsol relaxed and ideal bond angles. Upper graph: within a ring (unconnected symbols) and within one of the two larger rings of a drum centred on anions (broken line) and on cations (solid line). Lower graph: angles between one bond within a larger ring and one bond connecting the two larger rings. Note ideal implies 90° in the lower graph, and internal angles for regular 2n (n) sided polygons for rings (drums) in the upper graph. For colours see Fig. 11. | ||
In the previous subsection, our GM were compared to atomic structures already reported in the literature. Given that the nanoclusters of KF and CdSe are less extensively reported, we have also performed frequency calculations for all GM of these – see Fig. 13, where the corresponding simulated infra-red spectra are also shown. As no imaginary frequencies were found, the GM are indeed LM and not stationary points.
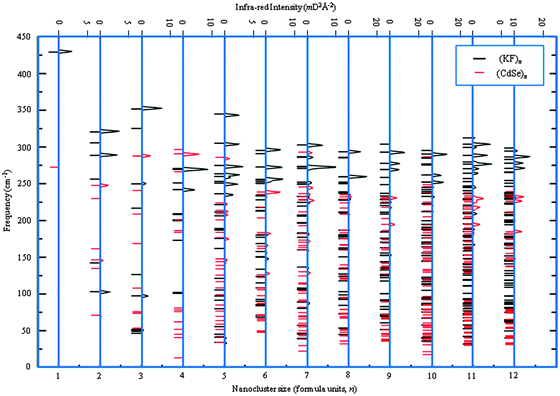 | ||
| Fig. 13 Frequencies (left) and simulated infra-red spectra (right) for the (KF)n and (CdSe)n GM nanoclusters. For clarity, (CdSe)n intensities have been doubled. | ||
The highest occupied molecular orbital (HOMO), the lowest unoccupied molecular orbital (LUMO), and the difference between them, ΔE, are given in Table 4 for ZnO and MgO, and Table 5 for KF and CdSe. Having employed the GGA approximation in the DFT calculations, it is expected that ΔE, which is also plotted in Fig. 14, is smaller than observed optical absorption transitions by a factor of 1.5–3 for the heteropolar compounds studied.78,79 Therefore only qualitative trends will be of interest here. In common to all four compounds, there is an increase in the ΔE with n increasing from two to three, with the smallest change observed for KF. This behaviour can be attributed to the difference in the n = 3 structures, where the KF ring is hexagonal in shape, and the other compounds adopt a more triangular shape. Moreover, as the size of the nanocluster is increased, the valence electrons localised on the anions are further apart and thus are more stable. The next transition should be expected and, indeed, occurs as the structures transform from 2D to 3D morphologies.
| n | ZnO | MgO | ||||
|---|---|---|---|---|---|---|
| E HOMO | E LUMO | ΔE | E HOMO | E LUMO | ΔE | |
| a As given in ref. 39. b Experimental value reported in ref. 80. | ||||||
| 2 | −5.65 | −4.35 | 1.30 | −4.57 | −3.13 | 1.45 |
| 3 | −6.46 | −3.03 | 3.03 | −5.44 | −2.61 | 2.83 |
| 4 | −6.32 | −3.25 | 3.06 | −4.97 | −2.51 | 2.45 |
| 5 | −6.46 | −3.35 | 3.12 | −4.88 | −2.79 | 2.10 |
| 6 | −6.28 | −3.06 | 3.06 | −5.29 | −2.28 | 3.01 |
| 7 | −6.37 | −3.28 | 3.28 | −5.10 | −2.48 | 2.61 |
| 8 | −6.20 | −3.63 | 2.57 | −4.98 | −2.30 | 2.68 |
| 9 | −6.02 | −3.88 | 2.15 | −5.39 | −2.20 | 3.18 |
| 10 | −6.05 | −2.21 | 2.21 | −4.97 | −2.25 | 2.72 |
| 11 | −6.01 | −2.11 | 2.11 | −5.15 | −2.33 | 2.81 |
| 12 | −6.33 | −2.52 | 2.52 | −5.45 | −2.17 | 3.28 |
| Bulk | — | — | 3.44a | — | — | 7.77b |
| n | KF | CdSe | ||||
|---|---|---|---|---|---|---|
| E HOMO | E LUMO | ΔE | E HOMO | E LUMO | ΔE | |
| a Experimental value on CdSe nanoparticles reported in ref. 82. b Experimental value reported in ref. 83. c Nanorod bulk-limit value reported in ref. 84. d Nanoparticle bulk limit value reported in ref. 85. | ||||||
| 2 | −5.32 | −0.35 | 4.97 | −5.17 | −3.92 | 1.26 |
| 3 | −5.47 | −0.25 | 5.22 | −5.64 | −3.09 | 2.55 |
| 4 | −5.67 | −0.12 | 5.55 | −5.63 | −3.02 | 2.61 |
| 5 | −5.32 | −0.44 | 4.89 | −5.27 | −3.64 | 1.63 |
| 6 | −5.58 | −0.17 | 5.41 | −5.64 | −3.47 | 2.17 |
| 7 | −5.67 | −0.28 | 5.40 | −5.46 | −3.43 | 2.03 |
| 8 | −5.61 | −0.17 | 5.44 | −5.69 | −3.42 | 2.27 |
| 9 | −5.50 | −0.23 | 5.28 | −5.75 | −3.43 | 2.31 |
| 10 | −5.58 | −0.31 | 5.27 | −5.19 | −3.38 | 1.81 |
| 11 | −5.47 | −0.41 | 5.06 | −5.71 | −3.45 | 2.26 |
| 12 | −5.52 | −0.21 | 5.31 | −5.92 | −3.40 | 2.52 |
| ∼10 Å | — | — | — | — | — | 3.00a |
| Bulk | — | — | 10.9b | — | — | 1.86c |
| 1.74d | ||||||
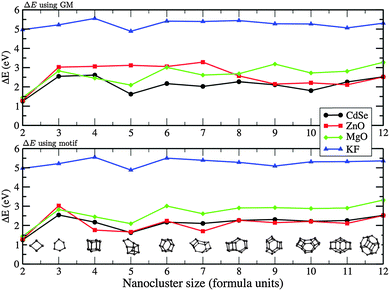 | ||
| Fig. 14 The energy difference between HOMO and LUMO, ΔE, for ZnO, MgO, KF, and CdSe GM (upper) and LM with a matching motif (lower) as a function of nanocluster size n (formula units). | ||
For ZnO, ΔE shows a transition between n = 7 and 8, which directly correlates with the 2D to 3D structural transition discussed earlier and which also agrees with early reports of Matxain et al.72 For 2 < n < 7, ΔE of ZnO was found to be around 3 eV, then dropped to 2 eV from n = 8. This is also similar to what has been reported in PBE exchange–correlation results by Wang et al.,37 although they found that ΔE, for this same range, monotonically increased from 3 to 4 eV. Similarly, the 2D–3D transitions occurs at n = 3–4 for MgO and can be seen as a drop in ΔE. The smaller 3D structures of MgO are observed to have a smaller ΔE, a trend previously reported from experiment on larger nanoparticles.81
The calculated ΔE for KF is nearly constant around 5 eV for the range of n considered, which is about half the reported bulk value.86 Considering all 3D GM structures of KF, only n = 5 includes lower coordinated ions in a “handle” feature, which corresponds to an observed drop in ΔE.
The calculated ΔE for CdSe for the larger nanoclusters is comparable with the absorption edge experimentally observed for the smallest nanoparticles of about 3 eV.84 Extensive measurements on larger CdSe nanoparticles of different morphologies show an inverse trend compared to MgO, as the particle size increases the gap decreases,84,85 with data extrapolated to bulk values of 1.74 eV and 1.86 eV for nanoparticles and nanorods, respectively.
Based on the calculated ΔE values and their known under-estimation using the exchange–correlation functional adopted, the general absorption in the UV region by the nanoclusters is predicted.
The first ionisation potential (I) and electron affinities (A) for the GM clusters are shown in Fig. 15. Only KF clusters do not accept an additional electron. The electron affinity for MgO decreases with size, whereas it increases and plateaux for ZnO and CdSe. Continuing this trend would result in the qualitatively correct work function of the bulk material for these compounds. All trends also conform to our reported structural phase transition, in particular, from 2D to 3D. Comparing ZnO, CdSe and MgO, the ionisation potential of the bulk materials is highest for ZnO, a trend in the ionisation potential that is also seen for the nanoclusters.
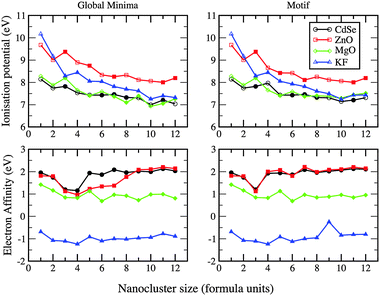 | ||
| Fig. 15 Ionisation potential and electron affinity for ZnO, MgO, KF, and CdSe as a function of nanocluster size n (formula units) for GM and LM with the chosen motif (see Fig. 14). | ||
If the same structural motif is used for each cluster size, then, comparing data from different compounds, the trends seen in ΔE, I and A with respect to cluster size should be more similar. This is certainly true for ΔE; LM in the curves now align and there are fewer crossovers and ΔE is only smaller for MgO compared to ZnO when n = 3 (see earlier discussions). For the electron affinity curves, ZnO and CdSe now follow the same pattern. However, there is a peak, not seen previously for any GM, at n = 9 for KF, the LM of which is 0.72 eV less stable than its GM.
3.2 Global optimisation of atomic structures of (AB)n nanoclusters
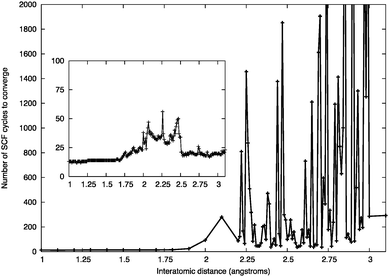 | ||
| Fig. 16 Number of SCF cycles to convergence for a ZnO dimer at a given inter-atomic separation using the Gaussian smearing of 0.01 eV. Inset: the effect of increasing the Gaussian smearing to 0.1 eV. | ||
Typically, for larger sized clusters, geometry optimisations using this 0.1 eV Gaussian smearing width did not affect the resulting atomic configurations of the GM and low-lying LM. This value of the Gaussian smearing width was employed in the initial iterations of the DFT refinements, before a final structural relaxation with zero smearing.
Tables 6 and 7 give the averages for the number of EA iterations and number of DFT calculations required to find the lowest energy nanoclusters for ZnO with and without the use of pre-screening, respectively. The corresponding tables for MgO are Tables 8 and 9. For ZnO and MgO the lowest energy minima were found within the first three EA iterations for all n considered, except for LM2 of (ZnO)12, which required five EA iterations. Without pre-screening, many more EA cycles were typically required; hundreds rather than tens of DFT calculations were performed. Comparing the tables of ZnO and MgO, it is clear that fewer EA cycles are needed to locate the MgO low-energy minima.
| n | m | GM | LM2 | LM3 | |||
|---|---|---|---|---|---|---|---|
| N EAi | N DFT | N EAi | N DFT | N EAi | N DFT | ||
| 4 | 10 | 0 | 2 | 0 | 2 | 1 | 6 |
| 5 | 10 | 0 | 5 | 0 | 5 | 2 | 12 |
| 6 | 10 | 0 | 4 | 1 | 8 | 0 | 4 |
| 7 | 10 | 0 | 6 | 0 | 6 | 1 | 11 |
| 8 | 16 | 0 | 12 | 1 | 25 | 1 | 25 |
| 9 | 16 | 0 | 14 | 1 | 28 | 0 | 14 |
| 10 | 16 | 3 | 60 | 1 | 29 | 2 | 45 |
| 11 | 16 | 1 | 29 | 2 | 44 | 1 | 29 |
| 12 | 16 | 1 | 31 | 5 | 90 | 1 | 31 |
| n | m | GM | LM2 | LM3 | |||
|---|---|---|---|---|---|---|---|
| N EAi | N DFT | N EAi | N DFT | N EAi | N DFT | ||
| 4 | 10 | 0 | 10 | 3 | 36 | 4 | 45 |
| 5 | 10 | 2 | 28 | 14 | 132 | 3 | 46 |
| 6 | 10 | 3 | 27 | 7 | 46 | 9 | 64 |
| 7 | 10 | 5 | 54 | 3 | 46 | 3 | 40 |
| 8 | 16 | 3 | 57 | 3 | 67 | 6 | 108 |
| 9 | 16 | 8 | 136 | 17 | 278 | 15 | 231 |
| 10 | 16 | 11 | 171 | 3 | 57 | 4 | 70 |
| 11 | 16 | 6 | 82 | 9 | 84 | 9 | 84 |
| 12 | 16 | 2 | 52 | 5 | 94 | 5 | 101 |
| n | m | GM | LM2 | LM3 | |||
|---|---|---|---|---|---|---|---|
| N EAi | N DFT | N EAi | N DFT | N EAi | N DFT | ||
| 4 | 10 | 0 | 3 | 0 | 3 | 0 | 3 |
| 5 | 10 | 0 | 4 | 1 | 9 | 0 | 4 |
| 6 | 10 | 1 | 7 | 2 | 13 | 3 | 18 |
| 7 | 10 | 2 | 22 | 0 | 7 | 0 | 7 |
| 8 | 16 | 0 | 12 | 0 | 12 | 0 | 12 |
| 9 | 16 | 0 | 13 | 0 | 13 | 2 | 41 |
| 10 | 16 | 2 | 43 | 2 | 43 | 0 | 16 |
| 11 | 16 | 1 | 30 | 0 | 15 | 2 | 30 |
| 12 | 16 | 2 | 45 | 2 | 45 | 0 | 16 |
| n | m | GM | LM2 | LM3 | |||
|---|---|---|---|---|---|---|---|
| N EAi | N DFT | N EAi | N DFT | N EAi | N DFT | ||
| 4 | 10 | 1 | 11 | 1 | 11 | 0 | 6 |
| 5 | 10 | 1 | 13 | 3 | 32 | 21 | 135 |
| 6 | 10 | 1 | 15 | 1 | 17 | 4 | 46 |
| 7 | 10 | 2 | 22 | 1 | 13 | 0 | 8 |
| 8 | 16 | 3 | 59 | 1 | 21 | 1 | 31 |
| 9 | 16 | 1 | 31 | 1 | 29 | 3 | 55 |
| 10 | 16 | 7 | 70 | 6 | 56 | 5 | 64 |
| 11 | 16 | 3 | 50 | 2 | 43 | 7 | 106 |
| 12 | 16 | 2 | 34 | 5 | 74 | 5 | 74 |
Without prescreening, a smaller average number of EA iterations was required to locate the GM for (MgO)12 than expected; the same number of iterations as required with prescreening, just two. As the prescreening typically coalesce fragmented clusters, a greater number of DFT calculations are performed per iteration with prescreening and therefore suggests a direct search is more efficient for this particular example. This in fact is misleading as the average time for each DFT run is much longer when prescreening is not applied. The time required for each DFT calculation depends on the number of SCF steps and the number of times the analytical derivatives are calculated (Geometry Optimisation steps). For the (MgO)12 example, the GM was found after an average of 20![[thin space (1/6-em)]](https://www.rsc.org/images/entities/char_2009.gif) 593 SCF and 1782 GO steps when prescreening employed, and a staggering 158
593 SCF and 1782 GO steps when prescreening employed, and a staggering 158![[thin space (1/6-em)]](https://www.rsc.org/images/entities/char_2009.gif) 463 SCF and 7478 GO steps without. Clearly the comparison of the average required DFT calls underestimates the performance difference between the two approaches.
463 SCF and 7478 GO steps without. Clearly the comparison of the average required DFT calls underestimates the performance difference between the two approaches.
The tabulated data provide direct evidence that using a pre-screener is an effective way of reducing the computational load and increasing the efficiency of the EA. This efficiency is attributed to passing atomic configurations that are typically near stable (or metastable) local minima on the DFT energy landscape for DFT refinement. Moreover, this procedure removes the unphysical structures that take much computational effort to optimize using DFT. This conclusion of course relies on the suitability of the chosen interatomic potentials, which is considered below.
Another advantage the pre-screener has over a direct search on the DFT energy landscape is that pre-screening will coalesce fragmented nanoclusters more readily. Fragmented nanoclusters are high on the energy landscape and therefore computing them is a waste of computational resources from the point of view of the result. The charge on atoms in the model using interatomic potentials is fixed (set by the user) and so oppositely charged fragments will be attracted to each other. However, using DFT the electrons can redistribute to ensure charge neutrality of each fragment, and therefore a fragmented cluster will often remain fragmented. Furthermore, dispersion interactions between fragments are poorly described by standard DFT.
Searches on the PBE landscape were also conducted for (MgO)n, which produced matching LM to those reported above for PBEsol as well as similar statistics in the success and efficiency of the searches.
| n | GM | LM2 | LM3 | LM | Fail |
|---|---|---|---|---|---|
| 2 | 0.10 | 0.38 | 0.00 | 0.52 | 0.00 |
| 3 | 0.11 | 0.00 | 0.00 | 0.89 | 0.00 |
| 4 | 0.06 | 0.00 | 0.01 | 0.92 | 0.01 |
| 5 | 0.05 | 0.00 | 0.00 | 0.94 | 0.01 |
| 6 | 0.08 | 0.00 | 0.02 | 0.89 | 0.01 |
| 7 | 0.00 | 0.00 | 0.00 | 1.00 | 0.00 |
| 8 | 0.00 | 0.00 | 0.00 | 0.99 | 0.01 |
| 9 | 0.01 | 0.00 | 0.00 | 0.99 | 0.00 |
| 10 | 0.00 | 0.00 | 0.00 | 1.00 | 0.00 |
| 11 | 0.00 | 0.00 | 0.00 | 0.99 | 0.01 |
| 12 | 0.00 | 0.00 | 0.00 | 1.00 | 0.00 |
| n | GM | LM2 | LM3 | LM | Fail |
|---|---|---|---|---|---|
| 2 | 0.34 | 0.10 | 0.00 | 0.56 | 0.00 |
| 3 | 0.52 | 0.00 | 0.00 | 0.48 | 0.00 |
| 4 | 0.11 | 0.05 | 0.06 | 0.78 | 0.00 |
| 5 | 0.20 | 0.01 | 0.01 | 0.78 | 0.00 |
| 6 | 0.17 | 0.09 | 0.01 | 0.73 | 0.00 |
| 7 | 0.02 | 0.02 | 0.03 | 0.91 | 0.02 |
| 8 | 0.02 | 0.09 | 0.00 | 0.85 | 0.04 |
| 9 | 0.00 | 0.00 | 0.02 | 0.94 | 0.00 |
| 10 | 0.00 | 0.00 | 0.01 | 0.99 | 0.00 |
| 11 | 0.02 | 0.00 | 0.00 | 0.96 | 0.02 |
| 12 | 0.04 | 0.04 | 0.02 | 0.88 | 0.02 |
The probability of locating the three lowest energy minima for both systems rapidly drops to a few percent for cluster sizes n > 6. In fact, the number of sample points were generally not enough for generating the lowest energy ZnO structures for n > 6; although the GM for n = 9 was found. This highlights the advantages of using a more advanced methodology (such as an EA) for structure prediction, as most minima were located with fewer than a hundred calculations using EA for the direct search on the DFT energy landscape.
Better results were found for MgO; the random quench data suggests that the catchment areas for LM are larger than their corresponding ZnO LM, although the percentage of finding the lowest three energy structures for MgO is rather small (<10%) for n > 6.
Tables 10 and 11 also show a high probability of locating higher energy structures for both ZnO and MgO – the majority of these structures contained peroxide units, i.e. have at least one oxygen–oxygen bond. These minima cannot form when using the pre-screener, as the charges on the oxygen anion is fixed to −2.0. As these higher energy structures are not wanted their removal during the pre-screening stage is extremely beneficial to the efficiency of the search.
4 Summary and conclusions
The study here was performed using KLMC, a new computational tool for the automation of many tasks that traditionally a user had to do by hand. A Lamarckian evolutionary algorithm incorporated into the global optimisation module of KLMC successfully located the DFT energy minima of ZnO, MgO, KF, and CdSe nanoclusters. Calculated frequencies, and in particular the simulated infra red spectra, for the (KF)n and (CdSe)n GM (n = 1 to 12) are provided for future comparison with experimental data. After taking into account the affects of using different exchange–correlation functionals, the predicted atomic structures agree with previous studies.20,21,37,59–63 Importantly, LM found for (MgO)n match LM found from a previous search for B3LYP LM, from which a good match between simulated and experimental infra-red spectra was reported.61 KF nanoclusters were found to prefer cuboid cuts from the rock-salt phase and shared many structural motifs with MgO. As drum nanoclusters increased in size (number of atoms), a more rapid change and a greater difference between bond lengths within and connecting the larger rings was also found for ZnO and CdSe. Within rings the bond lengths decreased (as typically found for the average bond lengths for LM) and between they increased with cluster size. These changes were more pronounced for ZnO and correlates with a greater number of GM rings. For larger n, nanoclusters of ZnO and CdSe adopt similar bubble-like structures, and a number of the structural motifs of (CdSe)n LM were not found for (ZnO)n nor found on the interatomic potential energy (IP) landscapes. The second energy differences contained significant minima at n = 4, 6 and 9, which correlates to stronger peaks found for these sizes in mass spectra of (MgO)n clusters.73 We do not expect as strong a correlation for the other compounds as the minima in their second energy differences were either smaller or nonexistence.The differences between the HOMO and LUMO energies, ΔE, for all the materials lie within the visible part of the UV spectrum region (at around 2–3 eV) apart from KF, which lies deep in the UV region. It was observed that ΔE does not uniformly follow the conventionally assumed trend of increasing with decreasing system size, as predicted by models of quantum confinement.60,87 Only KF clusters do not accept an additional electron. The electron affinity for MgO decreases with size, whereas it increases and plateaux for ZnO and CdSe. Continuing this trend would result in the qualitatively correct work function of the bulk material for these compounds.
Both IP based pre-screening and Gaussian smearing of electronic energy levels were investigated as methods for optimising the use of computationally demanding ab initio calculations that are employed to assess the quality of trial structures during the search for atomic structures of nanoclusters. Gaussian smearing of 0.1 eV in the initial geometry refinement steps significantly reduced the number of SCF cycles and, when used in geometry optimisation, this value allowed for hundreds of DFT calculations to be performed on a routine basis. Pre-screening was shown to be dramatically more efficient, reducing the number of DFT calculations needed to find the local minima by more than an order of magnitude. Using a suitable functional form of the interatomic potentials, this approach is robust to small changes to the potential parameters.
Comparing the probabilities of finding the lower energy local minima for MgO and ZnO, the energy basins containing each of these minima are predicted to be larger for MgO. A comparison of the performance of the random quench and a Lamarckian evolutionary algorithm showed, as expected, that the latter required fewer DFT calculations to locate the local minima, and thus highlights the efficiency of global optimisation techniques such as an evolutionary algorithm. Further analysis showed that the majority of structures located with a random quench on the DFT energy landscape were peroxide structures. The formation of these structures is impossible with the pre-screening potentials used here, and therefore these structures are automatically avoided in any DFT refinements.
Traditionally, DFT energy minima were obtained by refining IP energy minima structures found from global optimisation. With the increase in the available computer power, there is a drive towards direct searches on DFT energy landscapes. This study has shown that a careful application of interatomic potential based pre-screening will lead to a successful and, in fact, a more efficient algorithm for searching the DFT energy landscape. Pre-screening is therefore recommended for future applications of structure prediction techniques.
Acknowledgements
The authors thank A. A. Sokol, C. R. A. Catlow, S. C. Parker, B. Slater, J. D. Gale and I. Bethune for their useful comments during the course of this project, which was funded by EPSRC (grant number EP/I03014X), and V. Blum for support relating to FHI-Aims calculations. Through our membership of the UK's HEC Materials Chemistry Consortium, which is funded by EPSRC (EP/L000202), this work made use of the facilities of HECToR and ARCHER, the UK's national high-performance computing service, and also the UCL Legion High Performance Computing Facility (Legion@UCL), and associated support services.Notes and references
- S. M. Woodley and R. Catlow, Nat. Mater., 2008, 7, 937–946 CrossRef CAS PubMed.
- D. O. Scanlon, Phys. Rev. B: Condens. Matter Mater. Phys., 2013, 87, 161201 CrossRef.
- D. J. Wales and J. P. K. Doye, J. Phys. Chem. A, 1997, 101, 5111–5116 CrossRef CAS.
- D. J. Wales and H. A. Scheraga, Science, 1999, 285, 1368–1372 CrossRef CAS.
- M. A. Zwijnenburg and S. T. Bromley, Phys. Rev. B: Condens. Matter Mater. Phys., 2011, 83, 024104 CrossRef.
- C. J. Pickard and R. J. Needs, J. Phys.: Condens. Matter, 2011, 23, 053201 CrossRef PubMed.
- C. J. Pickard and R. J. Needs, J. Chem. Phys., 2007, 127, 244503 CrossRef PubMed.
- J. M. McMahon, Phys. Rev. B: Condens. Matter Mater. Phys., 2011, 84, 220104 CrossRef.
- S. Kirkpatrick, C. D. Gelatt and M. P. Vecchi, Science, 1983, 220, 671–680 CAS.
- J. C. Schon and M. Jansen, Z. Kristallogr., 2001, 216, 307–325 CrossRef CAS.
- J. C. Schon and M. Jansen, Z. Kristallogr., 2001, 216, 361–383 CrossRef CAS.
- D. Zagorac, K. Doll, J. C. Schon and M. Jansen, Phys. Rev. B: Condens. Matter Mater. Phys., 2011, 84, 045206 CrossRef.
- A. R. Oganov and C. W. Glass, J. Chem. Phys., 2006, 124, 244704 CrossRef PubMed.
- D. M. Deaven and K. M. Ho, Phys. Rev. Lett., 1995, 75, 288–291 CrossRef CAS.
- Y. Zeiri, Phys. Rev. E: Stat. Phys., Plasmas, Fluids, Relat. Interdiscip. Top., 1995, 51, R2769–R2772 CrossRef CAS.
- R. C. Eberhart and Y. H. Shi, IEEE Trans. Evol. Comput., 2004, 8, 201–203 CrossRef.
- R. Poli, D. Bratton, T. Blackwell and J. Kennedy, Theoretical derivation, analysis and empirical evaluation of a simpler particle swarm optimiser, IEEE, New York, 2007 Search PubMed.
- Y. C. Wang, J. A. Lv, L. Zhu and Y. M. Ma, Phys. Rev. B: Condens. Matter Mater. Phys., 2010, 82, 094116 CrossRef.
- C. Roberts and R. L. Johnston, Phys. Chem. Chem. Phys., 2001, 3, 5024–5034 RSC.
- A. A. Al-Sunaidi, A. A. Sokol, C. R. A. Catlow and S. M. Woodley, J. Phys. Chem. C, 2008, 112, 18860–18875 CAS.
- C. W. Glass, A. R. Oganov and N. Hansen, Comput. Phys. Commun., 2006, 175, 713–720 CrossRef CAS PubMed.
- S. Darby, T. V. Mortimer-Jones, R. L. Johnston and C. Roberts, J. Chem. Phys., 2002, 116, 1536–1550 CrossRef CAS PubMed.
- K. Doll, J. C. Schön and M. Jansen, J. Chem. Phys., 2010, 133, 024107 CrossRef CAS PubMed.
- S. Heiles, A. J. Logsdail, R. Schafer and R. L. Johnston, Nanoscale, 2012, 4, 1109–1115 RSC.
- G. Santambrogio, E. Janssens, S. H. Li, T. Siebert, G. Meijer, K. R. Asmis, J. Dobler, M. Sierka and J. Sauer, J. Am. Chem. Soc., 2008, 130, 15143–15149 CrossRef CAS PubMed.
- G. Santambrogio, M. Bruemmer, L. Woeste, J. Doebler, M. Sierka, J. Sauer, G. Meijer and K. R. Asmis, Phys. Chem. Chem. Phys., 2008, 10, 3992–4005 RSC.
- S. Heiles, R. L. Johnston and R. Schäfer, J. Phys. Chem. A, 2012, 116, 7756–7764 CrossRef CAS PubMed.
- F. A. Fernandez-Lima, O. P. VilelaNeto, A. S. Pimentel, C. R. Ponciano, M. A. C. Pacheco, M. A. C. Nascimento and E. F. d. Silveira, J. Phys. Chem. A, 2009, 113, 1813–1821 CrossRef CAS PubMed.
- S. Heiles and R. L. Johnston, Int. J. Quantum Chem., 2013, 113, 2091–2109 CrossRef CAS.
- R. L. Johnston, Dalton Trans., 2003, 4193–4207 RSC.
- C. R. A. Catlow, S. T. Bromley, S. Hamad, M. Mora-Fonz, A. A. Sokol and S. M. Woodley, Phys. Chem. Chem. Phys., 2010, 12, 786–811 RSC.
- S. M. Woodley, Proc. R. Soc. A, 2011, 467, 2020–2042 CrossRef CAS.
- E. Flikkema and S. T. Bromley, Chem. Phys. Lett., 2003, 378, 622–629 CrossRef CAS PubMed.
- S. Hamad, S. Cristol and C. R. A. Catlow, J. Am. Chem. Soc., 2005, 127, 2580–2590 CrossRef CAS PubMed.
- B. Hartke, Chem. Phys. Lett., 1996, 258, 144–148 CrossRef CAS.
- S. M. Woodley, J. Phys. Chem. C, 2013, 117, 24003–24014 CAS.
- B. Wang, S. Nagase, J. Zhao and G. Wang, J. Phys. Chem. C, 2007, 111, 4956–4963 CAS.
- V. A. Coleman and C. Jagadish, in Zinc Oxide Bulk, Thin Films and Nanostructures: Processing, Properties, and Applications, ed. C. Jagadish and S. J. Pearton, Elsevier Science Ltd, 2006, pp. 1–21 Search PubMed.
- Ü. Özgür, Y. I. Alivov, C. Liu, A. Teke, M. A. Reshchikov, S. Dogan, V. Avrutin, S. J. Cho and H. Morkoc, J. Appl. Phys., 2005, 98, 103 CrossRef PubMed.
- G. Villalba, R. U. Ayres and H. Schroder, J. Ind. Ecol., 2007, 11, 85–101 CrossRef CAS.
- H. Lee, M. Wang, P. Chen, D. R. Gamelin, S. M. Zakeeruddin, M. Grätzel and M. K. Nazeeruddin, Nano Lett., 2009, 9, 4221–4227 CrossRef CAS PubMed.
- J. D. Gale and A. L. Rohl, Mol. Simul., 2003, 29, 291–341 CrossRef CAS.
- J. D. Gale, J. Chem. Soc., Faraday Trans., 1997, 93, 629–637 RSC.
- V. Blum, R. Gehrke, F. Hanke, P. Havu, V. Havu, X. G. Ren, K. Reuter and M. Scheffler, Comput. Phys. Commun., 2009, 180, 2175–2196 CrossRef CAS PubMed.
- M. d'Avezac and A. Zunger, Phys. Rev. B: Condens. Matter Mater. Phys., 2008, 78, 064102 CrossRef.
- G. W. Turner, E. Tedesco, K. D. M. Harris, R. L. Johnston and B. M. Kariuki, Chem. Phys. Lett., 2000, 321, 183–190 CrossRef CAS.
- S. M. Woodley and C. R. A. Catlow, Comput. Mater. Sci., 2009, 45, 84 CrossRef CAS PubMed.
- S. M. Woodley, P. D. Battle, J. D. Gale and C. R. A. Catlow, Phys. Chem. Chem. Phys., 1999, 1, 2535–2542 RSC.
- S. M. Woodley, A. A. Sokol and C. R. A. Catlow, Z. Anorg. Allg. Chem., 2004, 630, 2343–2353 CrossRef CAS.
- J. M. Matxain, J. E. Fowler and J. M. Ugalde, Phys. Rev. A: At., Mol., Opt. Phys., 2000, 61, 053201 CrossRef.
- L. Whitmore, A. A. Sokol and C. R. A. Catlow, Surf. Sci., 2002, 498, 135–146 CrossRef CAS.
- C. R. A. Catlow, S. A. French, A. A. Sokol, A. A. Al-Sunaidi and S. M. Woodley, J. Comput. Chem., 2008, 29, 2234–2249 CrossRef CAS PubMed.
- G. V. Lewis and C. R. A. Catlow, J. Phys. C: Solid State Phys., 1985, 18, 1149–1161 CrossRef CAS.
- E. Vanlenthe, E. J. Baerends and J. G. Snijders, J. Chem. Phys., 1994, 101, 9783–9792 CrossRef CAS PubMed.
- J. P. Perdew, A. Ruzsinszky, G. I. Csonka, O. A. Vydrov, G. E. Scuseria, L. A. Constantin, X. Zhou and K. Burke, Phys. Rev. Lett., 2008, 100, 136406 CrossRef.
- L. Pauling, The Nature of the Chemical Bond, Cornell University Press, Ithaca, New York, 3rd edn, 1960 Search PubMed.
- R. D. Shannon, Acta Crystallogr., Sect. A: Cryst. Phys., Diffr., Theor. Gen. Crystallogr., 1976, 32, 751–767 CrossRef.
- D. R. Lide, CRC handbook of chemistry and physics, CRC Press, 89th edn, 2009 Search PubMed.
- S. M. Woodley, Database of published atomic structures of nanoclusters, 2014, http://www.ucl.ac.uk/klmc/Hive Search PubMed.
- S. B. Woodley, A. A. Sokol, C. R. A. Catlow, A. A. Al-Sunaidi and S. M. Woodley, J. Phys. Chem. C, 2013, 117, 27127–27145 CAS.
- M. Haertelt, A. Fielicke, G. Meijer, K. Kwapien, M. Sierka and J. Sauer, Phys. Chem. Chem. Phys., 2012, 14, 2849–2856 RSC.
- L. Hong, H. L. Wang, J. X. Cheng, L. L. Tang and J. J. Zhao, Comput. Theor. Chem., 2012, 980, 62–67 CrossRef CAS PubMed.
- E. Sanville, A. Burnin and J. J. BelBruno, J. Phys. Chem. A, 2006, 110, 2378–2386 CrossRef CAS PubMed.
- A. Ayuela, J. M. López, J. A. Alonso and V. Luaña, Z. Phys. D: At., Mol. Clusters, 1993, 26, 213–215 CrossRef CAS.
- J. P. K. Doye and D. J. Wales, Phys. Rev. B: Condens. Matter Mater. Phys., 1999, 59, 2292–2300 CrossRef CAS.
- J. Gebhardt, F. Vines, P. Bleiziffer, W. Hieringer and A. Gorling, Phys. Chem. Chem. Phys., 2014, 16, 5382–5392 RSC.
- J. Carrasco, F. Illas and S. T. Bromley, Phys. Rev. Lett., 2007, 99, 235502 CrossRef.
- A. Burnin, E. Sanville and J. J. BelBruno, J. Phys. Chem. A, 2005, 109, 5026–5034 CrossRef CAS PubMed.
- S. M. Woodley, Phys. Chem. Chem. Phys., 2007, 9, 1070–1077 RSC.
- B. Delley, J. Chem. Phys., 1990, 92, 508–517 CrossRef CAS PubMed.
- B. Delley, J. Chem. Phys., 2000, 113, 7756–7764 CrossRef CAS PubMed.
- J. M. Matxain, J. M. Mercero, J. E. Fowler and J. M. Ugalde, J. Am. Chem. Soc., 2003, 125, 9494–9499 CrossRef CAS PubMed.
- P. J. Ziemann and A. W. Castleman, J. Chem. Phys., 1991, 94, 718–728 CrossRef CAS PubMed.
- E. Clementi, IBM J. Res. Dev., 1965, 9, 2–19 CrossRef CAS.
- E. de la Puente, A. Aguado, A. Ayuela and J. M. Lopez, Phys. Rev. B: Condens. Matter Mater. Phys., 1997, 56, 7607–7614 CrossRef CAS.
- M. Sierka, Prog. Surf. Sci., 2010, 85, 398–434 CrossRef CAS PubMed.
- J. P. K. Doye and D. J. Wales, J. Chem. Phys., 1999, 111, 11070–11079 CrossRef CAS PubMed.
- U. Schönberger and F. Aryasetiawan, Phys. Rev. B: Condens. Matter Mater. Phys., 1995, 52, 8788–8793 CrossRef.
- H. Baltache, R. Khenata, M. Sahnoun, M. Driz, B. Abbar and B. Bouhafs, Phys. B, 2004, 344, 334–342 CrossRef CAS PubMed.
- D. M. Roessler and W. C. Walker, Phys. Rev., 1967, 159, 733–738 CrossRef CAS.
- N. F. Chayed, N. Badar, R. Rusdi, N. Kamarudin and N. Kamarulzaman, AIP Conf. Proc., 2011, 1400, 328–332 CrossRef CAS PubMed.
- C. B. Murray, D. J. Norris and M. G. Bawendi, J. Am. Chem. Soc., 1993, 115, 8706–8715 CrossRef CAS.
- D. M. Roessler and H. J. Lempka, Br. J. Appl. Phys., 1966, 17, 1553 CrossRef CAS.
- L. S. Li, J. T. Hu, W. D. Yang and A. P. Alivisatos, Nano Lett., 2001, 1, 349–351 CrossRef CAS.
- V. N. Soloviev, A. Eichhofer, D. Fenske and U. Banin, J. Am. Chem. Soc., 2000, 122, 2673–2674 CrossRef CAS.
- D. M. Roessler and H. J. Lempka, Br. J. Appl. Phys., 1966, 17, 1553 CrossRef CAS.
- S. A. Shevlin, Z. X. Guo, H. J. J. van Dam, P. Sherwood, C. R. A. Catlow, A. A. Sokol and S. M. Woodley, Phys. Chem. Chem. Phys., 2008, 10, 1944–1959 RSC.
| This journal is © the Owner Societies 2014 |

