
 Open Access Article
 This Open Access Article is licensed under a Creative Commons Attribution-Non Commercial 3.0 Unported Licence
Linking crystal structure with temperature-sensitive vibrational modes in calcium carbonate minerals
Ben
Xu
and
Kristin M.
Poduska
*
Department of Physics and Physical Oceanography, Memorial University of Newfoundland, St. John's, NL A1B3X7, Canada. E-mail: kris@mun.ca; Fax: +1-709-864-3739; Tel: +1-709-864-8890
First published on 8th July 2014
Abstract
We demonstrate a correlation between how an IR-active vibrational mode responds to temperature changes and how it responds to crystallinity differences. Infrared (IR) spectroscopy was used to track changes in carbonate-related vibrational modes in three different CaCO3 polymorphs (calcite, aragonite, and vaterite) and CaMg(CO3)2 (dolomite) during heating. Of the three characteristic IR-active carbonate modes, the in-plane bending mode (ν4) shows the most pronounced changes with heating in polymorphs that have planar carbonate arrangements (calcite, aragonite, and dolomite). In contrast, this mode is virtually unchanged in vaterite, which has a canted arrangement of carbonate units. We correlate these trends with recent studies that identified the ν4 mode as most susceptible to changes related to crystallinity differences in calcite and amorphous calcium carbonate. Thus, our results suggest that studies of packing arrangements could provide a generalizable approach to identify the most diagnostic vibrational modes for tracking either temperature-dependent or crystallinity-related effects in IR-active solids.
1 Introduction
Fourier transform infrared spectroscopy (FTIR) has been used to study the constituents of naturally occurring and laboratory synthesized samples for decades. Since sample preparation methods and measurement geometries can have dramatic effects on the widths and intensities of FTIR peaks, there has been a general disregard for quantitative comparisons of structural order from such spectra. However, recent studies have demonstrated that differences in long-range periodicity (crystallinity) can be extracted from FTIR spectra.1–5 Calcite has been an excellent test case because it has three well separated IR absorption bands,6–9 and because there are a range of different degrees of crystalline order that it can accommodate, ranging from amorphous to single crystalline. In other materials, such as apatite, the effects of crystallinity on peak widths can be more challenging to track when there are overlapping IR bands.10–12 FTIR has proven to be useful for tracking phase transitions in geological samples,10 developing screening techniques for archaeological materials,13 and for characterizing biominerals.3,12In this work, we investigate the temperature dependencies of peak positions and peak widths in the FTIR spectra of different carbonate minerals (geogenic sources of spar calcite, spar aragonite, and dolomite), as well as laboratory-prepared samples of calcite and vaterite. We find that there are different temperature dependencies for two prominent vibrational modes, and that these differences correlate with the packing arrangements of the carbonate units in the different crystal structures. Our analyses suggest that crystallinity differences and temperature dependency differences affect the vibrational modes of these carbonate materials in a similar manner. This offers a new way to help identify vibrational modes that could be indicators of crystallinity differences by using temperature-dependent spectral data.
2 Experimental details
Geogenic carbonate samples included calcite spar (Chihuahua, Mexico), aragonite spar (Minglanilla, Spain), and dolomite (Port au Choix, Newfoundland, Canada). Representative powder X-ray diffraction data, shown in Fig. 1, confirm the phase compositions of these geogenic samples. Calcite (space group R![[3 with combining macron]](https://www.rsc.org/images/entities/char_0033_0304.gif) C, compared with JCPDS 83-1762) has a = 4.990(1) Å and c = 17.063(3) Å; dolomite (space group RC, compared with JCPDS 75-1655) has a = 4.816(3) Å and c = 16.02(1) Å; and aragonite (space group Pmcn, compared with JCPDS 71-2396) has a = 4.967(4) Å, b = 7.96(1) Å, and c = 5.746(5) Å. All XRD data were collected using a Rigaku Ultima IV system with Cu Kα radiation, and lattice constant refinements from Jade (Materials Data Inc.) were compared with JCPDS14 standards.
C, compared with JCPDS 83-1762) has a = 4.990(1) Å and c = 17.063(3) Å; dolomite (space group RC, compared with JCPDS 75-1655) has a = 4.816(3) Å and c = 16.02(1) Å; and aragonite (space group Pmcn, compared with JCPDS 71-2396) has a = 4.967(4) Å, b = 7.96(1) Å, and c = 5.746(5) Å. All XRD data were collected using a Rigaku Ultima IV system with Cu Kα radiation, and lattice constant refinements from Jade (Materials Data Inc.) were compared with JCPDS14 standards.
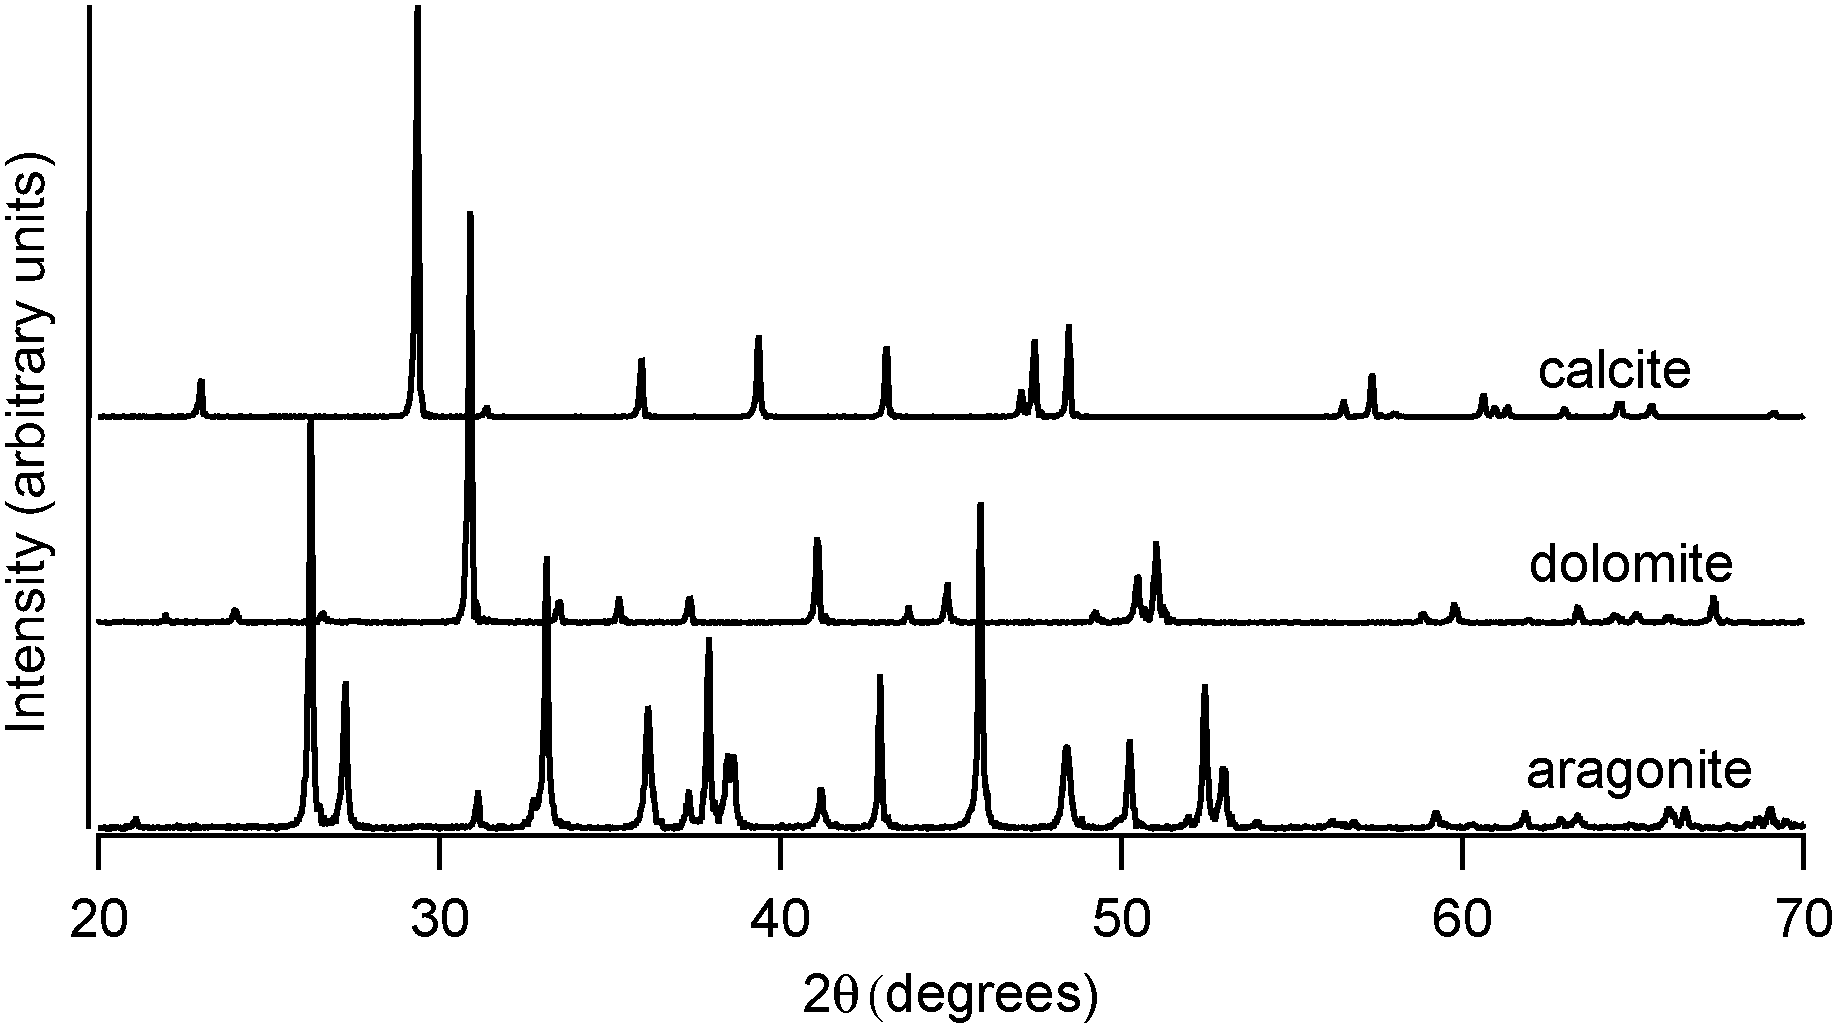 | ||
| Fig. 1 Representative powder X-ray diffraction spectra at room temperature of spar calcite, geogenic dolomite, and spar aragonite. Lattice constant refinements of these data yield values in good agreement with JCPDS14 standard patterns. | ||
Synthesized calcite and vaterite were made in two steps. First, 25 mL of 5 mM Na2CO3 was placed in a flask and immersed in an ultrasonic bath at room temperature, after which 1 mL of 60 mM CaCl2 was added every 15 seconds during the course of 6 minutes, for a total of 25 mL. To produce vaterite, suspensions were left at room temperature; calcite formed when suspensions were stored at 4 °C. After one hour, the suspensions were centrifuged for 15 minutes at 4200 rpm, the supernatant was removed, and products were air-dried.
FTIR measurements used a Bruker Vertex 70v vacuum spectrometer connected to a Hyperion 3000 IR microscope with a liquid-nitrogen-cooled single-element HgCdTe (MCT) detector. The system is attached to beamline 01B1-1 at the Canadian Light Source (Saskatoon, SK, Canada), and this bright IR source enabled very short data acquisition times. Spectra of the carbonate samples were measured in transmission mode (in the range of 4000–500 cm−1 with 1 cm−1 resolution). For this, specimens were ground with spectrophotometric grade KBr, pressed into 7 mm diameter pellets under 2 tons, and the resultant pellet was affixed to the mounting stage with thermal epoxy. To obtain a better signal to noise ratio for the two peaks of interest (ν2 and ν4), uncharacteristically high amounts of carbonate sample were used in the KBr pellets (approximately 1![[thin space (1/6-em)]](https://www.rsc.org/images/entities/char_2009.gif) :20 by weight). For this reason, the most intense peak (ν3) is saturated in all spectra shown in this work.
:20 by weight). For this reason, the most intense peak (ν3) is saturated in all spectra shown in this work.
Heating experiments used a nitrogen-purged temperature-controlled stage (Instec HCS601 Microscope Hot and Cold stage with MK1000 series High Precision Temperature Controller). Spectra were collected while heating from 293 K to 773 K at 25 K intervals, letting the temperature equilibrate for 30 minutes prior to each measurement. For each sample, spectra were collected from the same 250 μm diameter spot throughout the entire heating run.
Low-temperature data were collected using a liquid-nitrogen-cooled stage (Cryo Industries of America RC102-CFM Microscopy Cryostat with a controller from Cryogenic Control Systems) while under vacuum at 1 × 10⁶ torr. Samples were cooled to 77 K, then spectra were collected at 20 K intervals while warming to 298 K, letting the temperature equilibrate for 30 minutes at each temperature step. At each temperature, spectra were collected at 5 different 250 μm diameter spots.
Spectra were baseline corrected using Bruker OPUS 7.0 software, after which the peak positions, amplitudes, and full width at half maximum (FWHM) values were extracted from Lorentzian peak fits (Wavemetrics IgorPro v6.31). Lorentzian functions are widely utilized for peak fitting in IR and Raman spectra,15,16 and recent studies have demonstrated that the IR-active ν2 and ν4 modes in calcite are well matched by this function.17 For accurate comparisons, the same wavenumber regions were fitted across all temperature ranges for each different mineral phase: calcite (ν2 at 800–960 cm−1 and ν4 at 660–760 cm−1), aragonite (ν2 at 780–920 cm−1 and ν4 at 660–760 cm−1), vaterite (ν2 at 800–960 cm−1 and ν4 at 680–780 cm−1), and dolomite (ν2 at 800–960 cm−1 and ν4 at 700–760 cm−1).
3 Results
At room temperature, different polymorphs of CaCO3 (calcite, aragonite and vaterite) and the Mg–carbonate dolomite have clearly distinguishable X-ray diffraction patterns (Fig. 1) and FTIR spectra (Fig. 2). The vibrational modes associated with these FTIR peaks have been well documented in the literature,6,7 and our results are in good agreement. We find that the out-of-plane bend ν2 (near 870 cm−1) and the in-plane bend ν4 (near 720 cm−1) are the only distinct peaks in the mid-IR range that can be fit well with a single Lorentzian function across all four mineral phases. Thus, the ν2 and ν4 modes are the ones that we consider in detail here. Some of the remaining vibrational modes in these carbonates present overlapping peaks, including ν3 (near 1450 cm−1), and combined modes9ν1 + ν4 and ν1 + ν3 (near 1800 cm−1 and 2500 cm−1, respectively). Unlike calcite and dolomite, aragonite and vaterite have IR active ν1 modes at 1082 cm−1 and 1090 cm−1, respectively. Aragonite also has an additional peak in the ν4 range, as noted in Fig. 2(c).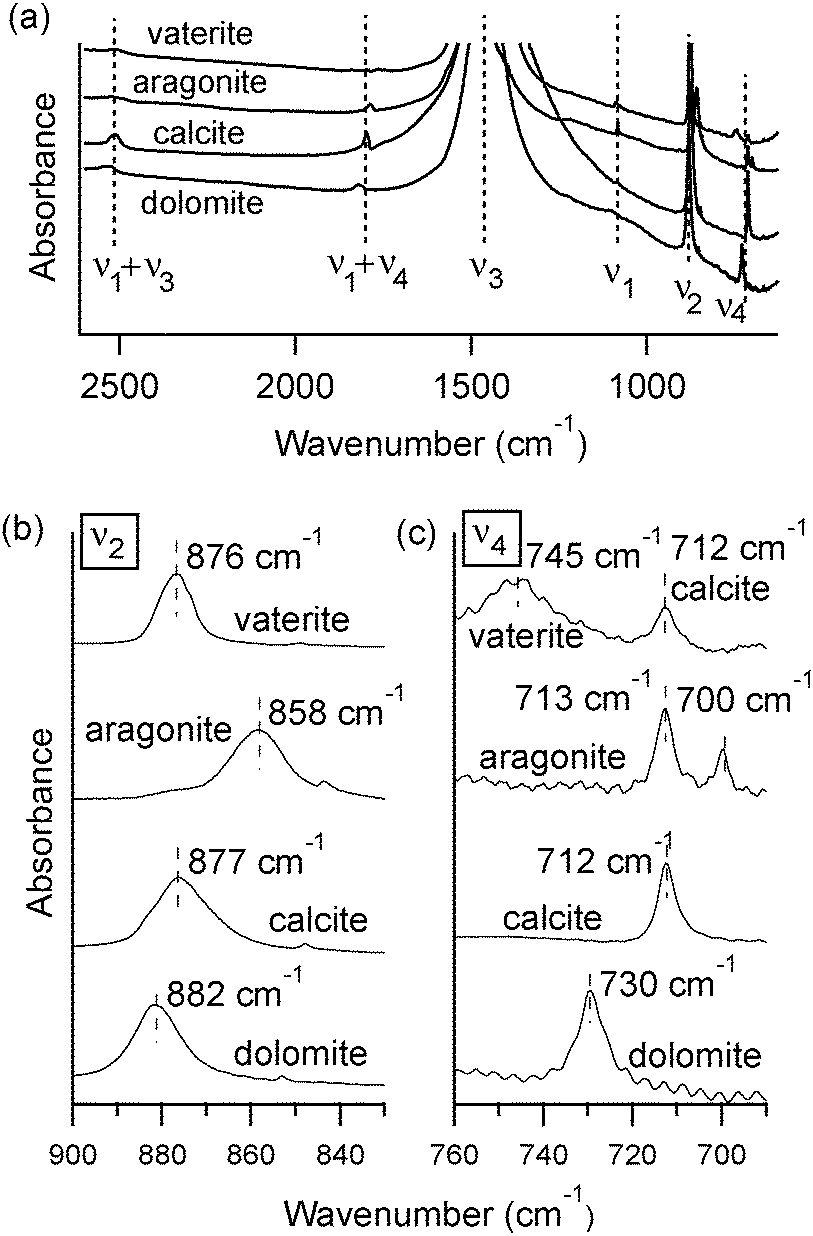 | ||
| Fig. 2 Representative FTIR spectra at room temperature of lab-synthesized vaterite, spar calcite, spar aragonite and geogenic dolomite, showing (a) full spectra, (b) the ν2 modes, and (c) ν4 modes. Spectra are scaled and shifted along the vertical axis for clarity. High amounts of sample were used to boost the signal to noise ratio for the ν2 and ν4 peaks, which leads to saturated absorbance unit values for the strongest (ν3) peak; for this reason the full ν3 peak is not shown in (a). | ||
FTIR spectra of calcite (lab-synthesized and geogenic spar), vaterite, aragonite, and dolomite were monitored while heating from 293 K to 768 K at 25 degree increments. Additional experiments at low temperatures were carried out on lab-synthesized and geogenic spar calcite. Fig. 3 illustrates representative temperature-dependent peak trends for calcite. Others have reported that calcite bonding distances expand and that carbonate ions distort at high temperatures.18,19 This is consistent with our findings, since both ν2 and ν4 peaks shift to lower wavenumbers and decrease in intensity with increasing temperature in both lab-synthesized and geogenic calcite. However, there are other temperature-dependent changes to these two spectral peaks as well. First, ν4 broadens with increasing temperature, while in contrast, the ν2 peak width is nearly constant (Fig. 4). Second, the ν4 peak intensity decreases more rapidly than the ν2 intensity as temperature increases.
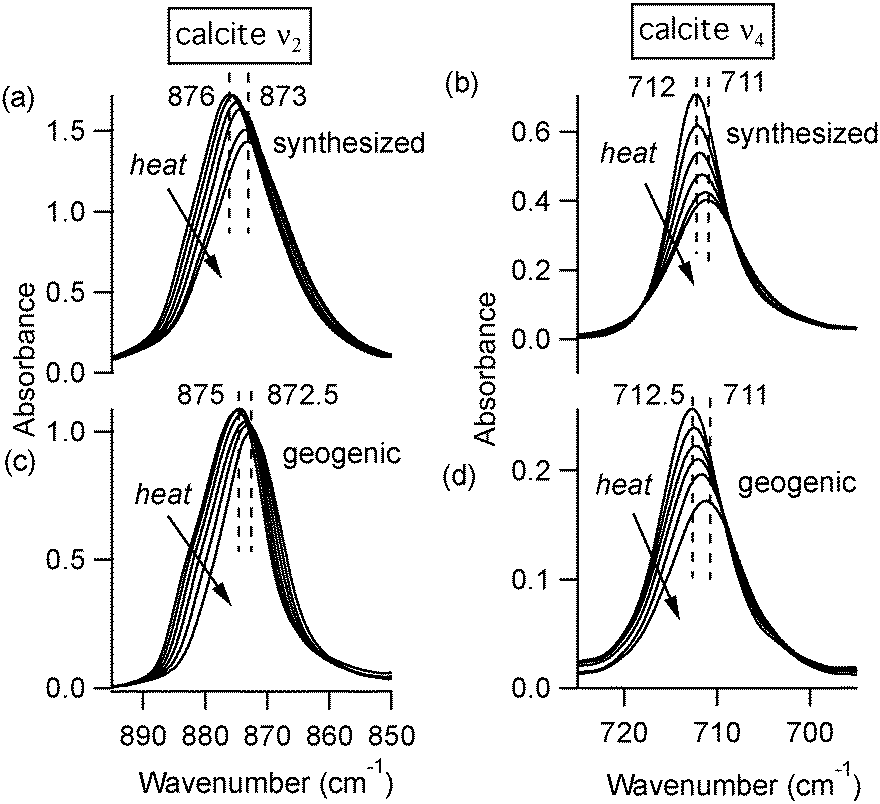 | ||
| Fig. 3 FTIR spectra of lab-synthesized calcite (a, b) and geogenic spar calcite (c, d) at different temperatures. The arrows indicate that the ν2 and ν4 peaks shift to lower wavenumber values and have smaller amplitudes at higher temperatures. | ||
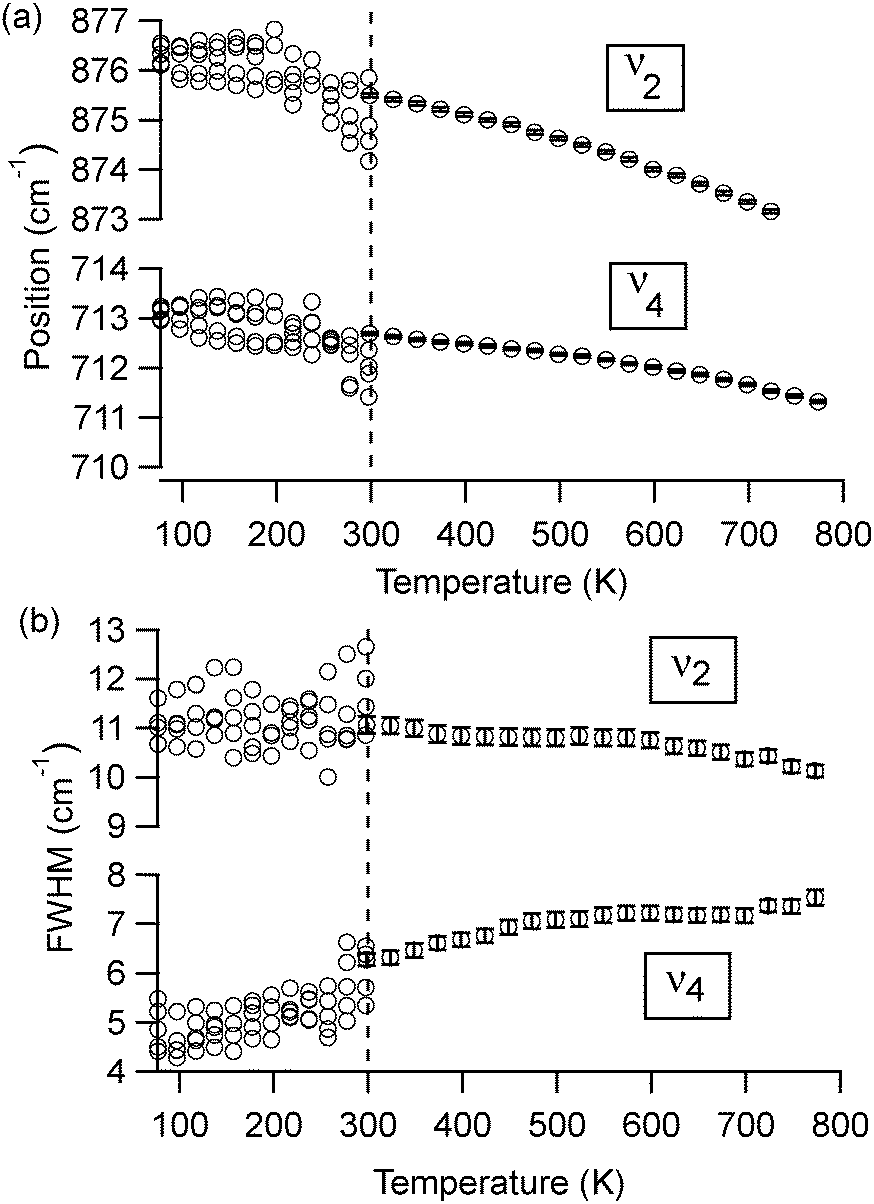 | ||
| Fig. 4 Temperature-dependent changes to (a) peak position and (b) FWHM values for ν2 (out-of-plane bend) and ν4 (in-plane bend) for spar calcite. Data below room temperature were collected in many different areas of the KBr pellet, contributing to more scatter. Data above room temperature show the trend at a single spot. Error bars account for the uncertainty associated with the Lorentzian peak fits, and are generally contained within the size of the data marker symbol. | ||
A comparison of high-temperature effects to FTIR peaks among all four types of carbonate minerals is provided in Table 1. The comparison temperature (598 K) is below any possible phase transition. As a rule, peak positions show a slight shift to lower wavenumbers upon heating. The lone exception is the aragonite ν4 peak near 700 cm−1, which moves to a higher wavenumber. The peak width trends show more pronounced differences. Dolomite, calcite, and aragonite show very little change in the ν2 FWHM, while the ν4 peak broadens with increasing temperature. Vaterite behaves differently, with its ν2 and ν4 peaks both showing constant widths during heating.
| Mode | Sample | δ position (cm−1) | δ FWHM (cm−1) | δ FWHM/FWHMRT (%) |
|---|---|---|---|---|
| ν 2 | Calcite synth | −1.7 ± 0.1 | −0.3 ± 0.3 | −2 ± 2 |
| Calcite spar | −1.5 ± 0.1 | −0.3 ± 0.3 | −2 ± 3 | |
| Dolomite | −2.5 ± 0.1 | 0.5 ± 0.2 | 4 ± 2 | |
| Aragonite | −2.3 ± 0.1 | 1.5 ± 0.5 | 9 ± 3 | |
| Vaterite | −2.2 ± 0.1 | −0.1 ± 0.2 | 2 ± 2 | |
| ν 4 | Calcite synth | −0.7 ± 0.1 | 1.8 ± 0.2 | 42 ± 5 |
| Calcite spar | −0.7 ± 0.1 | 1.0 ± 0.3 | 15 ± 4 | |
| Dolomite | −1.9 ± 0.2 | 3.4 ± 0.3 | 48 ± 5 | |
| Aragonite (713) | −0.4 ± 0.1 | 1.6 ± 0.4 | 40 ± 10 | |
| Aragonite (700) | 1.0 ± 0.3 | 2.6 ± 0.9 | 90 ± 40 | |
| Vaterite | −2.2 ± 0.3 | 0.3 ± 1.1 | 2 ± 8 | |
At temperatures above 598 K, our experiments demonstrate that both aragonite and vaterite undergo phase transitions to form calcite, as reported by others.20 The ν4 peaks are most indicative of these changes, shown in Fig. 5. The aragonite peak at 700 cm−1 disappears above 698 K (Fig. 5(a)), and the vaterite peak near 740 cm−1 disappears above 748 K (Fig. 5(b)). Up to the maximum heating capacity of our high temperature stage (768 K), dolomite shows no evidence of a phase change (Fig. 5(c)). For calcite, Fig. 4 indicates that there are no statistically significant discontinuities in the ν4 or ν2 peak positions or widths. For example, the small changes that occur to the calcite peak widths near 700 K (Fig. 4(b)) are within the range of the error bars on each data-point. Therefore, calcite does not show any evidence of a phase change within the temperature range of the present study.
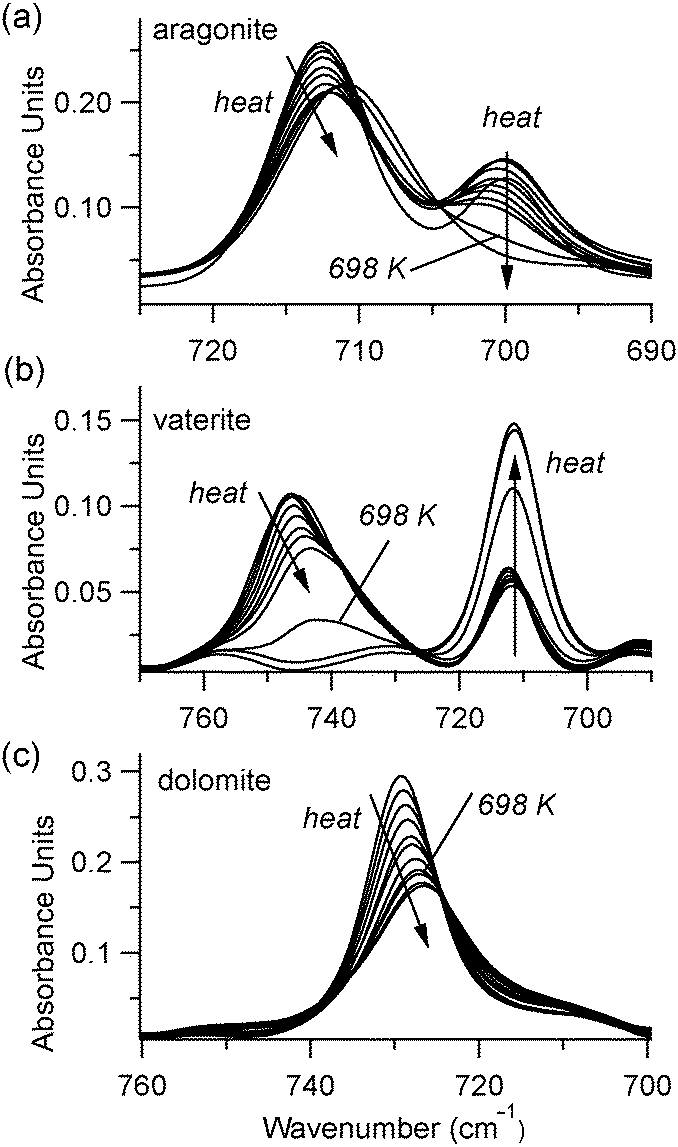 | ||
| Fig. 5 FTIR data in the ν4 region show that high temperatures cause a phase change to calcite in (a) aragonite and (b) vaterite, but not in dolomite (c). In each plot, the spectrum corresponding to 698 K is noted for clarity. | ||
4 Discussion
Changes in the IR spectra of solid materials during heating can be related to changes in the crystal lattice (such as phase transitions) or to the anharmonic nature of vibrations within the material.21,22 In the present study, the maximum measurement temperatures were safely below the decomposition temperature for calcite and dolomite (∼1000 K), but aragonite and vaterite each convert to calcite within this temperature range (at 748 K and 698 K, respectively) in agreement with the literature.20 For this reason, we choose to focus on the changes to spectral peak widths and positions that occur at temperatures below any phase transitions in these materials.In simple terms, adding thermal energy to a solid can provide information about the degree of anharmonicity of the atomic interaction potentials. For example, larger shifts in peak positions with a given temperature change signify a softer, more anharmonic interatomic potential. Recently, these kinds of effects have been explored in the temperature-dependent IR peak positions and width trends in apatite and kaolinite.2,23,24 A simple model was employed to describe weakly anharmonic oscillations and their quantum saturation limit at low temperatures.25 In brief, these previous studies report a linear temperature dependence for peak widths and positions at higher temperatures, which they attribute to anharmonic effects. However, below some threshold temperature, the temperature dependence diminishes, and peak widths and positions are constant; this is assumed to be the result of quantum saturation. Thus, there is an effective minimum peak width that can be achieved for a given IR vibrational mode once the material is cooled below a specific temperature threshold. This threshold temperature is determined empirically rather than from calculations, due to the complex and varied factors that contribute to spectral peak shapes and positions in real systems.
In the present study, we find that four calcium carbonate minerals (calcite, dolomite, aragonite, and vaterite) do not show a particularly strong temperature dependence in their peak positions or widths when compared to apatite or other minerals.2 Our working temperatures (298–768 K) appear to be far above the quantum saturation limit for the ν4 peak, since their widths show approximately linear temperature dependencies for all four carbonates. However, the ν2 peak width shows little change, suggesting that the quantum saturation temperature for this mode is far above ambient temperatures.
To explore these saturation effects in more detail, Fig. 4 shows low temperature peak width and position data for calcite ν2 and ν4 from many different microscopic regions of a sample. We achieved this by collecting numerous spectra at different areas on a KBr-embedded pellet sample, knowing that the spatial arrangement of the calcite particles within the KBr matrix will be slightly different at each location, and thus the peak widths will be slightly different due to differences in scattering effects (data below 300 K in Fig. 4). However, the spatial arrangement of particles at any given spot remains fixed during the course of the temperature-dependent measurements, since the calcite is not mobile in the KBr matrix. Therefore, collecting spectra from a single spot as the temperature changes shows peak width changes that are due solely to temperature-dependent effects (data above 300 K in Fig. 4). We note that the spread in peak widths at different measurement spots (low temperature data in Fig. 4) introduces scatter into the data, which is larger than the temperature-dependent trends that we can detect while measuring at a single location (high temperature data in Fig. 4). However, even with this large scatter, it is evident that the ν2 peak widths at higher temperatures are not statistically different than at lower temperatures. This is not the case for the ν4 peak widths, since there is a clear decrease in peak width with temperature. For both ν2 and ν4, the peak position changes are significant. Following the analysis of others,2 we extrapolate slopes (−0.0049 ± 0.0009 cm−1 K−1 and −0.0012 ± 0.001 cm−1 K−1) with corresponding 0 K peak positions (876.9 ± 0.2 cm−1 and 713.2 ± 0.1 cm−1) for ν2 and ν4, respectively. The larger slope for the ν2 peak position change suggests that the mode has a softer interatomic potential relative to the ν4 mode.
From these temperature dependent data, we notice two interesting trends. First, in all minerals, the ν2 peak (out-of-plane bend) has a width that is statistically unchanged with heating. Second, the ν4 peak (in-plane bend) does broaden with increasing temperature for calcite, aragonite, and dolomite, but not for vaterite. To explain the relative differences in the behavior of the in-plane and out-of-plane bending modes among these four different carbonate minerals, we look to differences in their crystal structures (Fig. 6).
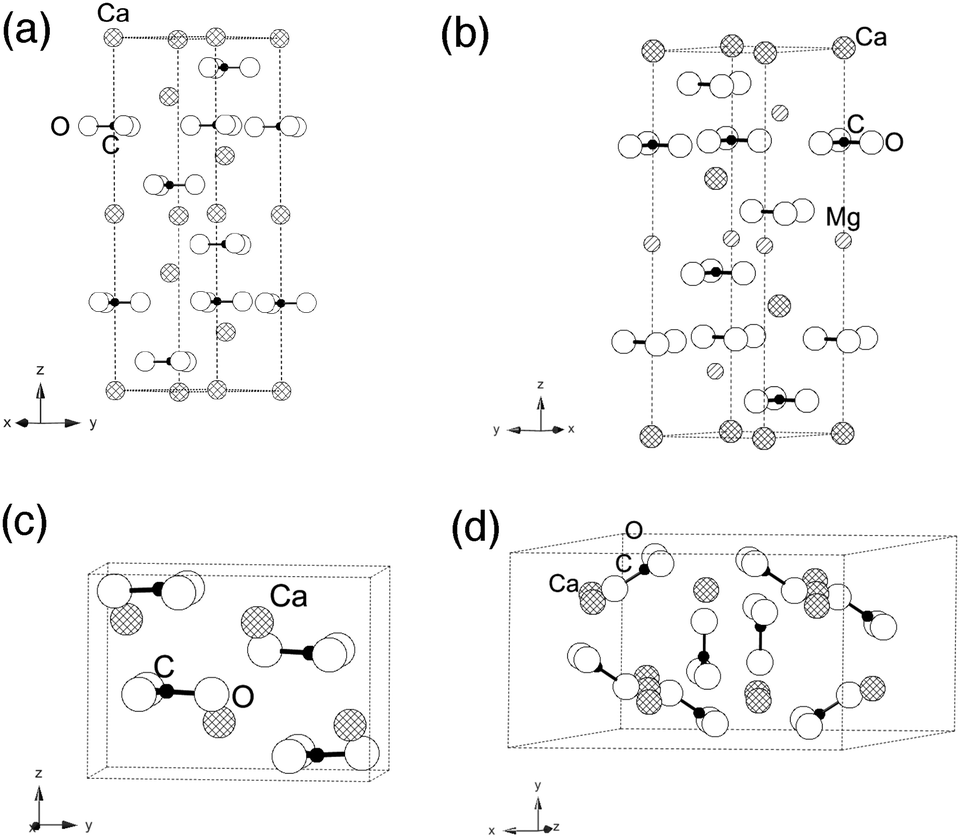 | ||
| Fig. 6 Schematic representation of crystallographic unit cells for (a) calcite and (b) isostructural dolomite, as well as (c) aragonite and (d) vaterite. | ||
Of the three pure calcium carbonates, calcite is the most stable phase under ambient temperature and pressure conditions (space group RC, with reported lattice constants26 of a = 4.99 Å and c = 17.10 Å). All of its carbonate moieties lie in-plane, rotated at 60° toward each other within a single plane. Dolomite is isostructural to calcite, but it has smaller lattice constants since it has ∼50% Mg replacing Ca. Aragonite is less stable thermodynamically under ambient conditions when compared to calcite. Its carbonate ions exist in staggered layers (space group Pmcn, with a = 4.9614 Å, b = 7.9671 Å and c = 5.7404 Å based on earlier reports6,27). Vaterite is even less stable than aragonite under ambient conditions, making it extremely rare in natural environments. Partial carbonate occupations and distortions have made definitive analysis of its structure quite complicated and the focus of considerable debate.28,29 Nevertheless, its non-planar arrangement of the carbonate units is a unique feature among the four carbonate minerals addressed in this study.
As described above, carbonate moieties have four possible vibrational modes, which are ν1 (in-plane symmetric stretching), ν2 (out-of-plane bending), ν3 (in-plane asymmetric stretching) and ν4 (in-plane bending).8 In dolomite, calcite and aragonite, the carbonate ions are arranged in layered structures and their ν2 mode (out-of-plane) is less affected by temperature changes than the ν4 (in-plane) mode. On the other hand, vaterite has carbonate units that are canted relative to each other and not in layers, and there are also partial occupancies that lead to built-in disorder. We propose that it is this structural difference – the non-planar arrangement of carbonate units – that makes the vaterite ν4 mode less changed as a function of temperature.
It is noteworthy that there are other reports of ν4 peak width changes in calcium carbonate phases, albeit in a different context. Recent studies based on experiments and density functional theory (DFT) demonstrate that the calcite ν4 peak broadens significantly more than ν2 when going from highly crystalline structures to a truly amorphous structure.5 The authors conclude that peak broadening, without a shift in peak position, is consistent with poorer long-range periodicity in calcite. At first glance, it might appear that comparing crystallinity differences (mixtures of amorphous and crystalline calcite) with temperature-dependent spectral features (changes in the anharmonicity of the vibrational modes) is not straightforward. However, we suggest that it is significant that the same peak (ν4) is most affected in both scenarios. For calcite, this in-plane bending mode appears to be the most responsive to changes in its structural environment, whether those changes are due to temperature or structural disorder. For example, we note that there is slightly larger temperature-dependent broadening in the ν4 peak for our rapidly formed laboratory-synthesized calcite compared with the geogenically formed spar calcite (Table 1). To extrapolate this link between temperature and structural disorder with other carbonate minerals beyond calcite is somewhat speculative, since theoretical studies are lacking. The DFT studies that work well in demonstrating the peak broadening between amorphous calcium carbonate and calcite5 cannot easily be extended to compare with other CaCO3 polymorphs, since the energy minima for these different structures are quite similar.30,31
5 Conclusions
Extending the idea of tracking crystallinity-dependent peak signatures with temperature-dependent experiments to cases beyond carbonate-containing minerals is an intriguing possibility, and it has not been explored. There are many potential materials that could be candidates for future studies. For example, there are reports of using features from vibrational spectra to track differences in crystallinity in silicon32,33 to identify the presence and proportion of amorphous components. In this case, factor analysis showed that Raman spectra have exactly two independent spectral features, one of which can be attributed to crystalline Si while the other is assigned to amorphous Si. Others have identified a crystallinity-sensitive IR mode in SiO2 that corresponds to an octahedral site that is easily disrupted in the Si–O tetrahedral network,1 and temperature-dependent studies in glassy SiO2 have also been conducted.34 Crystallinity has also been tracked in experimental studies of apatite12,35 and aragonite.3One possible advantage of using temperature as a screening strategy for crystallinity dependent vibrational modes is that one sample is all that is needed. This could be a more time-effective option when detailed theoretical calculations are not feasible.
Acknowledgements
We thank M. Toffolo and E. Boaretto (Weizmann Institute of Science, Israel) for spar calcite and spar aragonite samples, and F. Borondics, T. May, and X. Lu at the Mid-IR beamline at the Canadian Light Source.References
- B. J. Saikia, G. Parthasarathy and N. Sarmah, Bull. Mater. Sci., 2008, 31, 775–779 CrossRef CAS.
- E. Balan, S. Delattre, D. Roche, L. Segalen, G. Morin, M. Guillaumet, M. Blanchard, M. Lazzeri, C. Brouder and E. K. Salje, Phys. Chem. Miner., 2011, 38, 111–122 CrossRef CAS.
- M. Suzuki, T. Kogure, S. Weiner and L. Addadi, Cryst. Growth Des., 2011, 11, 4850–4859 CAS.
- K. M. Poduska, L. Regev, E. Boaretto, L. Addadi, S. Weiner, L. Kronik and S. Curtarolo, Adv. Mater., 2011, 23, 550–554 CrossRef CAS PubMed.
- R. Gueta, A. Natan, L. Addadi, S. Weiner, K. Refson and L. Kronik, Angew. Chem., Int. Ed., 2007, 46, 291–294 CrossRef CAS PubMed.
- J. P. R. D. Villiers, Am. Mineral., 1971, 56, 758–767 Search PubMed.
- F. A. Andersen and L. Brecevic, Acta Chem. Scand., 1991, 45, 1018–1024 CrossRef CAS PubMed.
- F. B. Reig, J. G. Adelantado and M. M. Moreno, Talanta, 2002, 58, 811–821 CrossRef CAS.
- S. Gunasekaran, G. Anbalagan and S. Pandi, J. Raman Spectrosc., 2006, 37, 892–899 CrossRef CAS.
- E. K. Salje, M. A. Carpenter, T. Malcherek and T. B. Ballaran, Eur. J. Mineral., 2000, 12, 503–519 CAS.
- A. J. Blanch, J. S. Quinton, C. E. Lenehan and A. Pring, Anal. Chim. Acta, 2007, 590, 145–150 CrossRef CAS PubMed.
- Y. Asscher, S. Weiner and E. Boaretto, Adv. Funct. Mater., 2011, 21, 3308–3313 CrossRef CAS.
- L. Regev, K. M. Poduska, L. Addadi, S. Weiner and E. Boaretto, J. Archaeol. Sci., 2010, 37, 3022–3029 CrossRef PubMed.
- Joint Commission on Powder Diffraction Standards – International Centre for Diffraction Data, http://www.icdd.com, 2003.
- R. H. Stolen, C. Lee and R. Jain, J. Opt. Soc. Am. B, 1984, 1, 652–657 CrossRef CAS.
- E. Gazit, I. R. Miller, P. C. Biggin, M. S. Sansom and Y. Shai, J. Mol. Biol., 1996, 258, 860–870 CrossRef CAS PubMed.
- X. Long, M. J. Nasse, Y. Ma and L. Qi, Phys. Chem. Chem. Phys., 2012, 14, 2255–2263 RSC.
- S. A. Markgraf and R. J. Reeder, Am. Mineral., 1985, 70, 590–600 CAS.
- N. Ishizawa, H. Setoguchi and K. Yanagisawa, Sci. Rep., 2013, 3, 2832–2836 Search PubMed.
- J. Peric, M. Vucak, R. Krstulovic, L. Brecevic and D. Kralj, Thermochim. Acta, 1996, 277, 175–186 CrossRef CAS.
- R. A. Cowley, Rep. Prog. Phys., 1968, 31, 123–166 CAS.
- M. Lazzeri, M. Calandra and F. Mauri, Phys. Rev. B: Condens. Matter Mater. Phys., 2003, 68, 220509 CrossRef.
- E. Balan, S. Delattre, M. Guillaumet and E. K. H. Salje, Am. Mineral., 2010, 95, 1257–1266 CrossRef CAS.
- J. Menéndez and M. Cardona, Phys. Rev. B: Condens. Matter Mater. Phys., 1984, 29, 2051–2059 CrossRef.
- J. F. Scott, Rev. Mod. Phys., 1974, 46, 83–128 CrossRef CAS.
- N. H. de Leeuw and S. C. Parker, J. Phys. Chem. B, 1998, 102, 2914–2922 CrossRef CAS.
- B. Dickens and J. S. Bowen, J. Res. Natl. Bur. Stand., Sect. A, 1971, 75, 27–32 CrossRef CAS.
- E. M. Pouget, P. H. H. Bomans, A. Dey, P. M. Frederik, G. de With and N. A. J. M. Sommerdijk, J. Am. Chem. Soc., 2010, 132, 11560–11565 CrossRef CAS PubMed.
- L. Kabalah-Amitai, B. Mayzel, Y. Kauffmann, A. N. Fitch, L. Bloch, P. Gilbert and B. Pokroy, Science, 2013, 340, 454–457 CrossRef CAS PubMed.
- L. Valenzano, Y. Noël, R. Orlando, C. Zicovich-Wilson, M. Ferrero and R. Dovesi, Theor. Chem. Acc., 2007, 117, 991–1000 CrossRef CAS.
- P. Rez and A. Blackwell, J. Phys. Chem. B, 2011, 115, 11193–11198 CrossRef CAS PubMed.
- M. Ledinsky, L. Fekete, J. Stuchlík, T. Mates, A. Fejfar and J. Kočka, J. Non-Cryst. Solids, 2006, 352, 1209–1212 CrossRef CAS PubMed.
- M. Ledinský, A. Vetushka, J. Stuchlík, T. Mates, A. Fejfar, J. Kočka and J. Štěpánek, J. Non-Cryst. Solids, 2008, 354, 2253–2257 CrossRef PubMed.
- A. G. Kalampounias, S. N. Yannopoulos and G. N. Papatheodorou, J. Chem. Phys., 2006, 124, 014504 CrossRef CAS PubMed.
- E. Beniash, J. Aizenberg, L. Addadi and S. Weiner, Proc. R. Soc. London, Ser. B, 1997, 264, 461–465 CrossRef CAS.
| This journal is © the Owner Societies 2014 |