 Open Access Article
Accurate characterization of single track-etched, conical nanopores
Pavel Yu.
Apel
*ab,
Patricio
Ramirez
c,
Irina V.
Blonskaya
a,
Oleg L.
Orelovitch
a and
Bozena A.
Sartowska
d
aFlerov Laboratory of Nuclear Reactions, Joint Institute for Nuclear Research, Joliot-Curie str. 6, 141980 Dubna, Russia. E-mail: apel@nrmail.jinr.ru
bDubna International University, Universitetskaya str. 19, 141980 Dubna, Russia
cDepartament de Física Aplicada, Universitat Politècnica de València, Camino de Vera s/n, E-46022 Valencia, Spain
dInstitute of Nuclear Chemistry and Technology, Dorodna str. 16, 03-195, Warsaw, Poland
First published on 9th June 2014
Abstract
Single track-etched conical nanopores in polymer foils have attracted considerable attention in recent years due to their potential applications in biosensing, nanofluidics, information processing, and other fields. The performance of a nanopore critically depends on the size and shape of its narrowest, nanometer-sized region. In this paper, we reconstructed the profiles of both doubly-conical and conical pores, using an algorithm based on conductometric measurements performed in the course of etching, coupled with SEM data. We showed that pore constriction deviates from the conical shape, and the deviation depends on the energy loss of the particle that produced the track. Funnel-like profiles of tracks of four ions with different atomic numbers were derived from experimental data. The simulations, using a Poisson–Nernst–Planck model, demonstrated that the ion current rectification properties of the funnel-shaped asymmetrical pores significantly differ from those of conical ones if the tip radius of the pore is smaller than 10 nm. Upon subjecting to further etching, the pores gradually approach the “ideal” conical geometry, and the ion transport properties of these two pore configurations become almost indistinguishable.
Introduction
Nanopore devices have become an important class of analytical instruments, particularly as sensors for (bio)molecules and nano- and microparticles. Both biological pores, typically imbedded in a lipid bilayer, and artificial nanopores, produced in an insulating material such as silicon oxide, silicon nitride or an organic polymer, are used in this field of research and development.1–6 Nanopores of precise shape and size are also of interest with regard to separation processes, nano- and microfluidics, controlled release, logic gates, energy harvesting and storage.7–9 Among the many methods developed for nanopore fabrication, the track-etch technique has proved to be a convenient and relatively simple approach.10,11 It entails the creation of damage tracks by bombarding a thin foil with high-energy ions, followed by chemical etching to transform the tracks into mono-disperse hollow channels (pores). Both multi-pore and single-pore membranes can be produced using this technique.11 An asymmetrical etching procedure has been developed to fabricate the so-called conical pores.12 These pores are produced in a cell, one half of which is filled with a strong etch solution, typically sodium hydroxide, while a stop-etch solution is added to the other half-cell. The cell is equipped with two gold or platinum electrodes so that a bias voltage can be applied to the system. When the etchant breaks through to the other side of the foil, it is neutralized by the stopping solution. Additionally, the electric field pulls out the hydroxide ions from the new-born pore, thus terminating the growth of the pore. As a result, an asymmetrical pore is obtained, with the large-diameter opening on the order of hundreds of nanometers and the small-diameter opening on the order of several nanometers.12,13 Such approximately conical pores possess ionic selectivity and diode-like current–voltage characteristics in electrolytic solutions. The ionic selectivity stems from the presence of carboxylic groups, capable of dissociation, on the pore walls, and from the nanometer-sized narrow part of the pore (“tip”). The diode-like behavior directly relates to the geometrical asymmetry of the nanopores with electrical charge on the walls. Asymmetrical track-etched pores have become the subject of extensive study, from both theoretical and experimental viewpoints, with the goals of understanding the transport of electrolytes in confined spaces and developing new nanofluidic devices.14–48 Some aspects such as the mimicking of biological ion channels,13,18,28,47,48 biosensing,14,15,18,19,23,29,32,36,47,48 ionic current rectification,16,20–22,24,26,27,30–34,38,41–43 nanoprecipitation,17,37,40 voltage gating,12,13,17,33 chemical gating,17,18,28,47,48 and others have been investigated. In a series of papers, the effects of tip diameter, cone angle, pore shape and length on the ionic current rectification were analyzed theoretically.16,22,24,26,27,32,38,41,43 Asymmetrical nanopores of non-conical shapes have been fabricated, studied experimentally and modeled using an approach based on the Poisson–Nernst–Planck equations.27,42 It was concluded that the geometry of the narrow part of an asymmetrical pore plays the most important role in its diode-like behavior.16,20,21,27Apart from asymmetrical nanopores, symmetrical doubly-conical track-etched pores are also of interest.44–46 Asymmetrical chemical modification makes it possible to impart useful functions to doubly-conical pores.47,48
In all instances, it is important to control and characterize the geometry of the conical nanopores accurately and precisely. The base diameters of conical nanopores can be determined by field-emission scanning electron microscopy (FESEM), which is a routine procedure. Conversely, it is practically impossible to find and identify a single hole a few nanometers in diameter on the surface of polymer foil using FESEM. Therefore, the size of the tip opening is estimated with the conductometric method. The ionic conductance of the electrolyte-filled nanopore is measured at applied transmembrane potentials of between +100 and −100 mV, where the current–voltage curve is linear. The slope provides the conductance G, from which the tip radius is calculated using the formula11
 | (1) |
Recently, we suggested a procedure that allows for determination of the geometry of a nanopore, in case the etching front reflects the latent track structure.53 The method is based on the conductometric monitoring of symmetrical etching, i.e., etching with the same etch solution on both sides of the foil. Based on the analysis of the time dependence of pore conductance, the profile of the quasi-doubly-conical pore can be reconstructed. In this paper, we apply the developed algorithm to tracks of ions with different atomic numbers, and present quantitative characterization of pores with significantly different shapes of constriction. We also demonstrate how the funnel-like pores gradually approach the “ideal” conical geometry as the etching continues after breakthrough. Finally, we present calculations illustrating the ionic transport properties of pores with the reconstructed funnel-like profile, and compare them to those of conical pores having the same conductance.
Experimental
Ion irradiation
Polyethylene terephthalate (PET) biaxially oriented films (10 μm-thick GOST-24234-80, USSR, and 12 μm-thick Hostaphan RN, Kalle, Germany) were irradiated with single U and Au ions at the UNILAC facility of GSI (Darmstadt). Reference samples were irradiated with the same ions, at fluences of 107–108 cm−2. Stacks consisting of 4–10 samples were exposed at normal incidence. The initial specific energy of the projectiles was 11.1 or 11.4 MeV u−1 for many- and single-ion irradiation, respectively. Both types of irradiation with 1.2 MeV u−1 Xe ions and 4.0 MeV u−1 Fe ions were performed using the IC-100 cyclotron and the U-400M cyclotron (FLNR JINR, Dubna). The basic parameters of the accelerated ions are shown in Table 1.| Ion | Specific energy (MeV u−1) | Energy loss in PET foil, dE/dx (keV nm−1)54 |
|---|---|---|
| U | 5–11.4 | 19–21 |
| Au | 5–11.4 | 15–17 |
| Xe | 1.2 | 8–11 |
| Fe | 4.0 | 4.6–5.0 |
The second column presents the specific energy of an ion impinging the polymer foil. Use of ions with atomic numbers from 26 to 92 enabled us to vary the energy loss dE/dx in the tracks from approximately 5 to 20 MeV μm−1.54 The variations of dE/dx, as the ions passed through the foil, were within the limits shown in the third column.
Etching and measurement conditions
Etching of single- and multi-track samples was performed in a two-compartment electrolytic cell, to provide identical treatment conditions. Before etching, all samples were exposed to soft (wavelength > 315 nm) ultraviolet radiation for 30 minutes, to stabilize the track-to-bulk etch ratio.49 The foil thickness was measured before and after etching, and its average thickness was used to determine the bulk etch rate. Both halves of the cell were filled with 9 M NaOH. High alkali concentration was used to ensure the fabrication of “doubly-conical” pores by maintaining a relatively low track-to-bulk etch rate ratio. Conductometric monitoring of the etching process for single-track samples was performed in AC mode using a PC-controlled LCR-meter (HiTESTER 3522-50, HIOKI E. E. Corporation, Japan). After filling both compartments with the etchant, the electrical resistance was measured by applying a sine voltage with an amplitude of 0.5 V to the gold electrodes. To avoid interference from 50 Hz noise, a frequency of 1333 Hz was chosen. To avoid overflow of the measuring device in the beginning of the process, a calibrated resistor was connected in parallel with the cell. The relevant conductance was subtracted from the measured values to obtain the conductance G of the pore itself. The particulars of these measurements were dictated by the following factors: (1) there is no need for a high sensitivity because the electrical current through a conical pore filled with a concentrated electrolyte solution is relatively high; (2) the current should be monitored for a long time, up to values of 10−5–10−4 A; (3) polarization of electrodes should be eliminated; (4) the applied voltage should be low, to avoid influencing the etching process. Pore breakthrough was identified by a sharp onset of the electrical current. Electron microscopy investigations were performed on multi-track samples. These reference samples, containing many ion tracks, were etched at identical concentrations and temperatures. Depending on the required resolution and magnification, samples were examined using either an SEM (JSM-840, JEOL; TM3000, Hitachi, Japan) or an FESEM Ultra Plus (Zeiss, Germany) instrument. Pore diameters on both foil surfaces were measured. Embrittled samples were fractured to observe the inner pore structure. Pores that cleaved exactly along their longitudinal axes were selected for imaging. Details of the sample preparation and FESEM examination have been reported previously.42Results and discussion
Conductometric measurements and their interpretation
Experimentally measured pore conductivity curves, G1/2(t), for different bombarding ions are shown in Fig. 1. For comparison, a theoretical dependence of the square root of conductance vs. etching time is also plotted in Fig. 1.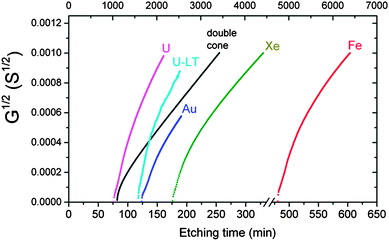 | ||
| Fig. 1 The square root of pore conductance as a function of etching time (scale at bottom), for single tracks of U, Au, Xe and Fe ions in PET foil. The theoretical curve (black) calculated by eqn (3) for the double-cone model is shown for comparison. Etching conditions: 9 M NaOH; temperature: 22 °C (U, Xe) and 18 °C (Au, Fe). The curve marked U–LT was measured at a temperature of 0.5 °C and normalized to the specific conductivity at 22 °C (time scale at top). | ||
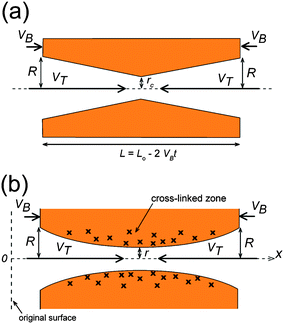
The theoretical curve is based on the double-cone model for etched pores (see Fig. 2a). According to the double-cone model, two circular cones form in mirror symmetry across the center plane of the foil, and advance towards each other at the track etch speed VT.53 The bulk etching of the material is characterized by the bulk etch speed, VB. After two pore tips have met each other, the pore has the geometry of two truncated cones with a cone base radius, R, and a constriction radius, rc. Based on eqn (1), the pore conductivity as a function of time can be written as follows:53
 | (2) |
The calculated shape of G1/2(t) for the doubly-conical pore was obtained using typical input parameters (9 M NaOH, k = 0.25 S cm−1, VB = 2 nm min−1, tb = 78 min, and L0 = 12 μm). This idealized function is a monotonically increasing curve. The experimental curves of all the tracks distinctly differ from the theoretical curve of G1/2 between 5 × 10⁻⁵ and 2 × 10⁻⁴ S1/2, where the doubly-conical model predicts a convex shape while the measured curves have concave segments. The presence of these concave segments is a clear indication that the pore geometry is not that of a double cone. As we have already mentioned in the Introduction, one must consider the structure of the latent track to explain the observed dynamics of pore growth. At small radii the etching process cannot be described by a unique etch rate VB. Within a cylinder of approximately 100 nm in diameter, the polymer is substantially modified by ion-induced radiolytic reactions. In the track core (radius < 5 nm), the etch rate VT is typically several orders of magnitude higher than the bulk etch rate. In the halo (radii between 5 and 50 nm), the track etch rate is slower than the bulk etch rate. The diameters of both the track core and the track halo depend on the energy dissipated around the ion path.52 With increasing pore diameter, the local etch rate recovers gradually and reaches the bulk etch rate at the outer halo diameter. As a result, double-funnel-shaped (or “quasi-doubly-conical”) pores form after breakthrough. Fig. 2b shows the quasi-doubly-conical pore geometry. The longitudinal profile of the pore is determined by the spatial distribution of radiation effects in the latent track. It is essential that the pore be symmetrical with respect to the center plane of the foil and that its evolution can be regarded as an imaginary (virtual) movement of its two halves towards each other at a speed VT. Such a consideration allowed us to derive the following equation, which relates the measured conductance of the pore to its geometrical parameters R and r:53
 | (3) |
Using eqn (3), the constriction radius r(t) can be calculated using the measured values of R(t), G(t), VT, VB, and k.
The same model of pore growth as the movement of two mirror halves makes it possible to obtain the longitudinal profile rx(x) of the pore from the r(t) function. The desired rx(x) function can be found, based on the fact that the time dependence and the distance dependence are linked to each other via the parameter VT.53 For any time ti ≥ tb the quasi-doubly conical shape is given by the pair of parametric equations with parameter t:
| rx(t) = r(t) | (4) |
| r(t) = L0/2 ± VT (t − ti) | (5) |
Here x is the distance along the pore axis (see Fig. 2b); the length x = L0/2 corresponds to the middle plane of the foil. The plus and minus signs in eqn (5) correspond to the right and left halves of the pore in Fig. 2b, respectively. Values of r(t) within the time interval between ti and ti + (1 − VB/VT)ti are needed to calculate the pore profile at the time t = ti. In a typical experiment, pore evolution was monitored for a time exceeding tb by a factor of 2 to 3, which was necessary to reconstruct the whole pore. The average pore opening diameters were determined by SEM within the same time interval, and were approximated with a linear function to obtain the required dependence R(t).53
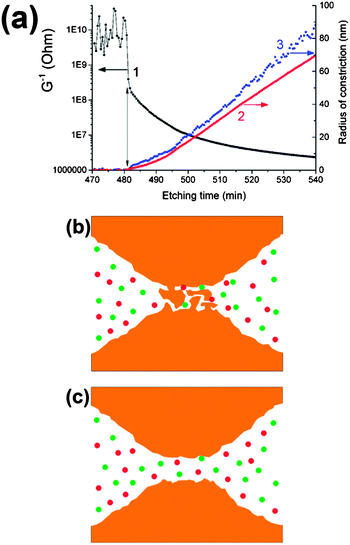
Fig. 3a shows the result of an experiment performed with a single Fe ion track. A sharp decrease in foil resistance was observed at t = 481 min (marked with a vertical arrow). The constriction radius of the growing pore was calculated in two different ways. Using eqn (1), the radius rc of this critical part of the pore was estimated within the framework of the double-cone model. Eqn (3) was employed to calculate the constriction radius r without presumptions as to the particular shape of the two symmetrical halves of the pore. Both rc and r increase nonlinearly with etching time during the first 20–30 minutes after breakthrough, thus demonstrating the radial dependence of the local etch rate in the latent track. The radius rc grows more or less smoothly, while the radius r increases sharply, beginning at a delay of approximately 1–2 minutes after the drop in resistance. This short phase, characterized by a current of a few nA, appears to signify a transition between the under-etched latent track and the open channel. It is known that electrolytes can penetrate the excess free volume of latent tracks created by heavy ions.31 Due to this process, the electrical current flowing between two etched cones (or, more appropriately, funnels), through the short residual segment of the latent track, is high enough to be distinguished from the background. Fig. 3b illustrates such an under-etched ion track in a simplified form. In this intermediate phase, the radius of constriction calculated by eqn (1) takes a value of ∼1 nm. Its physical meaning is questionable because the specific conductivity of the etch solution-soaked latent track is not equal to the bulk value. At the time t = 482.5 min, the radius rc of the potentially conical pore remains as small as 1.5 nm, while the radius calculated by eqn (3) jumps to 3.5 nm. We interpret this moment as the formation of an open channel, free of polymer fragments in the middle of the pore, as shown in Fig. 3c. Taking into account the typical values of the track etch rate and the duration of the intermediate phase, one can conclude that the current of ∼1 nA corresponds to a residual latent track length of several tens of nanometers. It should be noted that the electrical current through the under-etched pore was especially high in the case of the Fe ion because of the large cone angle of the two mirror halves. The wide cones (i.e., funnels) have a low electrical resistance, which is connected in series with the resistance of the residual part of the latent track. Conversely, the funnel-shaped parts of the uranium track pore are much narrower (due to a much shorter breakthrough time), and the electrical current, both during the transition phase and thereafter, is proportionally smaller, mostly due to the higher resistance of the etched part of the pore. As a result of the smaller current, the formation of an open channel cannot be identified clearly.
The question arises as to whether the slow radial growth of the pores at small radii is caused by diffusion limitations of the etch solution into the pores. The same phenomenon could affect the specific conductivity of the solution in the new-born narrow channels. To check the possibility that the measured conductance vs. time curves were influenced by diffusion, we performed an experiment on single track etching at a significantly lower temperature. The curve U-- in Fig. 1 shows the results of the etching of a uranium ion track at 0.5 °C. The 20-degree decrease in temperature resulted in a 20-fold increase in breakthrough time (note the time scale on top). Such a significant change in the track etch rate suggests that the chemical reaction was not diffusion limited. Actually, the 20-fold difference corresponds to the activation energy of approximately 100 kJ mol−1, which is typical of reaction rate limited kinetics. The specific conductivity of the working solution decreased from 0.27 S cm−1 at 22 °C down to 0.085 S cm−1 at 0.5 °C, i.e., by three times. Because conductivity directly relates to diffusivity, it is obvious that in the low-temperature experiment the rate of the chemical reaction was significantly reduced, while the rate of diffusion was not seriously altered. However, the shape of the G1/2vs. time curve remained the same. Therefore, we concluded that the dynamics of pore growth and the electrolyte conductivity in the pore were not limited by diffusion.
Reconstructed pore profiles
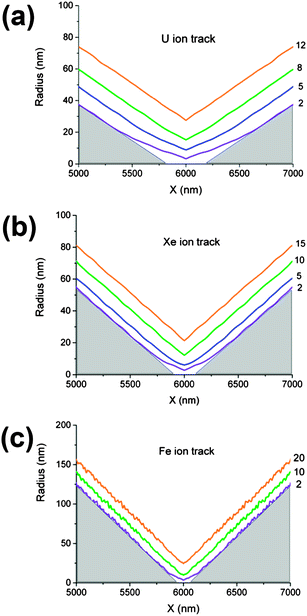
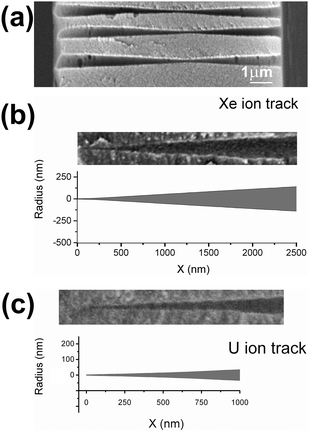
Fig. 4 shows the profiles of symmetrical pores obtained via the two-sided etching of single tracks, produced by different high-energy ions. The profiles were reconstructed using the arrays of measured data for G(t) and R(t) and the algorithm described by eqn (3)–(5). The pore's central segments, with a length of 2000 nm, are shown at three or four different etching times, each exceeding the breakthrough time by 2–20 minutes. In the case of the heaviest ion, U, the deviation from the ideal double-cone geometry extends in an axial direction for up to ±500 nm from the center plane. The inscribed triangles serve to locate the region where the deviation is significant. It is clearly seen from Fig. 4a–c that the pores obtained by etching Fe ion tracks are much closer in shape to the double cone than those produced from the tracks of heavier ions. As the pore widens, its geometry gradually approaches the doubly-conical shape. Five minutes after breakthrough, when the constriction radius reaches 7–9 nm, the critical region still has a double-funnel geometry (see Fig. 4a). A prolonged etching is required to approach a conical geometry, which is attained at a constriction radius of approximately 15–20 nm. In reality, however, the geometrically ideal double cone could hardly form even at long etching. Due to faster removal of short fragments of polymer chains, the ridge between the two conical surfaces tends to be smoothed. This tendency is clearly seen in the SEM images of pores etched up to radii significantly larger than the size of the latent track. The smoothed constrictions with a radius of approximately 40 nm are shown in Fig. 5a, where the fracture of a multi-pore sample is imaged.The tip profiles of U and Xe ion tracks, calculated for the time t = tb + 1 min, are shown in Fig. 5b and c and compared with the SEM images of real pore tips, obtained by one-sided etching tracks of the relevant bombarding particles. Each pair of plots and micrographs has the same scale. The calculated and directly observed profiles are in good agreement. Other experimental confirmations of this pore shape are the scanning electron microscope images of the metal replicas35 and fractured membrane samples53 that have recently been published.
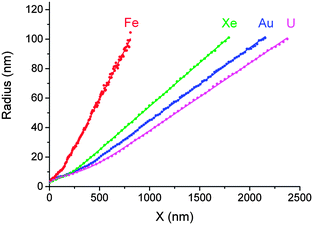
The pore radius as a function of the distance from the tip, for tracks of four different ions, is presented in Fig. 6. The regions with rx < rm = 100 nm are shown, where the effect of dE/dx on pore shape is most pronounced. These profiles can be considered as simulations of pores produced by asymmetrical etching, followed by a short additional etching (which is often used to obtain a pore with reproducible and stable properties).19,23,25,30,36,39 The reconstruction algorithm accounts for the movement of the etching front towards the tip and the simultaneous small shortening of the pore, due to bulk etching on both sides. The resulting reconstructed profiles resemble elongated funnels, whose tip lengths (defined here as the abscissa xm, where rx(xm) = rm) systematically decrease with the decreasing atomic number of the track-forming ion. Surprisingly, the radius of the narrowest part of the tip does not vary much and is randomly valued at around r ≈ 4 nm. This scatter in radius length is most likely due to an uncertainty in determination of the breakthrough time. The length of the funnel tip correlates much better with the ion atomic number than does the tip radius. The half angles of the conical parts of the pores also correlate well with dE/dx and take the values of 2.6, 2.9, 3.4 and 7.5° for U, Au, Xe and Fe ions, respectively. The half angle directly reflects the decrease in the track etch rate VT with continuing energy loss of the track-forming particle.
To quantitatively characterize the shape of the tip in each particular case, the profiles for x < xm were fitted by the equation27,55
 | (6) |
| Ion | r (nm) | R (nm) | L (nm) | x m (nm) | h (nm) | x m/h | n |
|---|---|---|---|---|---|---|---|
| U | 4.5 | 466 | 11![[thin space (1/6-em)]](https://www.rsc.org/images/entities/char_2009.gif) 560 560 |
2375 | 2790 | 0.85 | 1.53 |
| Au | 4.5 | 540 | 11![[thin space (1/6-em)]](https://www.rsc.org/images/entities/char_2009.gif) 505 505 |
2154 | 2520 | 0.85 | 1.47 |
| Xe | 4.0 | 597 | 11![[thin space (1/6-em)]](https://www.rsc.org/images/entities/char_2009.gif) 327 327 |
1791 | 1920 | 0.93 | 1.48 |
| Fe | 4.0 | 1220 | 10![[thin space (1/6-em)]](https://www.rsc.org/images/entities/char_2009.gif) 240 240 |
784 | 1060 | 0.74 | 1.46 |
A similar characterization of the pore shapes obtained with U ions at different etching times was performed. The results obtained are presented in Table 3. Again, parameters r, R, xm and L were measured directly, while parameters n and h were determined from least square fitting. We see that increasing the etching time results in the increase of the pore radii r and R, and parameter h, while the pore tip length xm and the parameters characterizing the pore shape, xm/h and n, decrease with the etching time and approach the limit xm/h → 0 and n → 1, corresponding to the conical pore.
| Etching time | r (nm) | R (nm) | L (nm) | x m (nm) | h (nm) | x m/h | n |
|---|---|---|---|---|---|---|---|
| t b + 2 min | 4.5 | 466 | 11![[thin space (1/6-em)]](https://www.rsc.org/images/entities/char_2009.gif) 560 560 |
2375 | 2790 | 0.85 | 1.53 |
| t b + 5 min | 9.0 | 475 | 11![[thin space (1/6-em)]](https://www.rsc.org/images/entities/char_2009.gif) 543 543 |
2133 | 3203 | 0.67 | 1.31 |
| t b + 8 min | 16 | 484 | 11![[thin space (1/6-em)]](https://www.rsc.org/images/entities/char_2009.gif) 526 526 |
1891 | 4374 | 0.43 | 1.14 |
| t b + 12 min | 29 | 496 | 11![[thin space (1/6-em)]](https://www.rsc.org/images/entities/char_2009.gif) 504 504 |
1569 | 6127 | 0.26 | 1.05 |
Modeling of ion transport in funnel-shaped pores
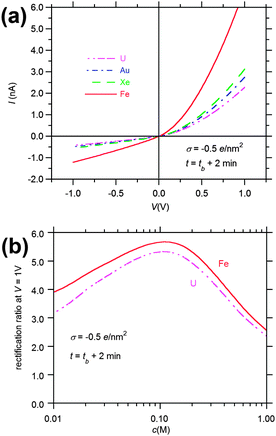
Fig. 7–9 show the calculated current vs. voltage (I–V) and rectification ratio (defined as |I(V)/I(–V)|) vs. electrolyte concentration for the asymmetric pores, based on the reconstructed profiles characterized in Tables 2 and 3. The simulations have been performed using a Poisson–Nernst–Planck (PNP) model developed previously.16 Although this model was originally proposed for conical nanopores, it has been applied successfully to pores with a variety of shapes and fixed charge distributions,8,16,20–22,24,26,27,34,45,55 and constitutes a standard tool for the characterization of the ionic transport through long and narrow pores, such as those produced in organic polymers by track-etching. In spite of the nanoscale nature of the pore radii, this continuum electrostatics model can explain most of the transport phenomena observed because the nanopore diameters are larger than the Debye length in the range of electrolyte concentrations used in the experiments.16,27 All calculations have been performed assuming that the pores separated two identical KCl solutions. We have also considered the infinite dilution diffusion coefficients DK+ = 1.95 × 10⁻⁵ cm2 s−1 and DCl− = 2.03 × 10⁻⁵ cm2 s−1, as well as the surface charge density σ = −0.5e nm−2, where e is the elementary charge, which is within the range of the experimental values reported for conical PET nanopores.16,20–22,34 Note that, although the value of σ is assumed to be constant all over the pore surface, the volume charge density defined as | (7) |
The I–V curves of the pores with the reconstructed profiles in Fig. 6 are presented in Fig. 7a. All curves show rectification of the electric current, with a high conducting state for positive applied voltages, in which the current enters the pore through the narrow opening, and a low conducting state for negative applied voltages, in which the current enters the pore through the wide opening. We see also that, at a given voltage, the current increases with decreasing atomic number of the track-forming ion, as a result of the increasing radius of the wide opening with decreasing dE/dx. Fig. 7b shows the rectification ratio at V = 1 V. For the sake of clarity, only the curves of pores obtained with U and Fe ions have been plotted. In spite of the different I–V curves shown in Fig. 7a, the rectification ratio vs. KCl concentration c curves obtained through the pores are very similar for the four reconstructed profiles, showing a maximum value around c ≈ 0.1 M. The maximum value increases slightly with decreasing dE/dx, due to the increase in the pore angle at the region of the pore tip. In accordance with this result, previous experiments on PET samples irradiated by different single heavy ions have not revealed any explicit relationship between the type of bombarding ion and the diode-like properties of the asymmetrical pores fabricated by one-sided etching.
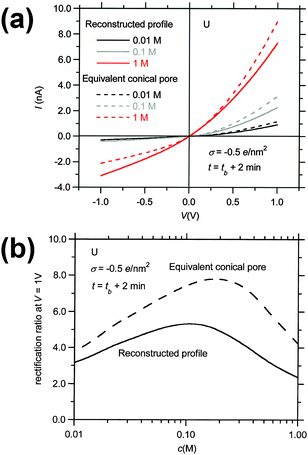
As discussed in the Introduction, experimentalists who use conical pores frequently employ SEM techniques to estimate the base radius of the pores, and use eqn (1) to calculate the radius of the pore tip. This procedure can lead to severe errors if the pore geometry deviates from the conical shape, as illustrated in Fig. 8 and 9. The continuous curves of Fig. 8a correspond to the I–V curves of the funnel-shaped pore produced by the tracks of U ions at etching time t = tb + 2 min, and the dashed curves represent the I–V curves of the equivalent conical pore with the same surface charge concentration, base radius and conductance at V = 0.1 V and c = 1 M KCl. The curves are parametrical in the electrolyte concentration. At this etching time, the radius of the pore tip of the equivalent conical nanopore is r ≈ 2.2 nm, which deviates significantly from the value r = 4.5 nm found for the tip of the funnel. We see that the equivalent conical pore overestimates the electric currents obtained assuming the reconstructed profile at the three KCl concentrations analyzed. This is also the case for the rectification ratio vs. KCl concentration curves, shown in Fig. 8b. Again, the rectification ratios corresponding to the equivalent conical pore are significantly higher than those obtained assuming the reconstructed profile, due to the reduction of the tip radius in the case of the equivalent conical pore. We also find significant differences in the concentration where the maximum value is attained: c ≈ 0.1 M in the case of the pore with the reconstructed profile and c ≈ 0.2 M for the equivalent conical pore.
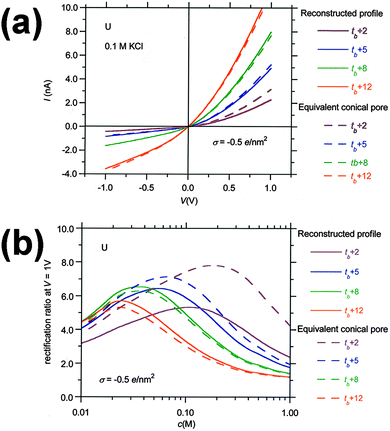
Fig. 9 illustrates how, with increasing etching time, the properties of the pores with reconstructed profiles approach those of the equivalent conical pores. We have considered again the case of the pores obtained with U ions and the shape described by the parameters summarized in Table 3. Fig. 9a shows the I–V curves of the pores with the reconstructed profile (continuous lines), and the I–V curves of the equivalent conical pores (dashed lines). The curves are parametric in the etching time. The calculated pore tip radii of the equivalent conical pores at the different etching times are r ≈ 2.2 nm (t = tb + 2 min), 9 nm (t = tb + 5 min), 16 nm (t = tb + 8 min), and 29 nm (t = tb + 12 min). Therefore, the estimation of the pore tip radius using the conical pore assumption equals that of the reconstructed profile at t = tb + 5 min, and the calculated I–V curves using the two models practically coincide above this etching time. The rectification ratio vs. concentration curves of Fig. 9b show greater differences between the two models because the rectification ratio is very sensitive to small differences in the I–V curves. Nevertheless, the curves corresponding to the equivalent conical pores match those of the reconstructed profile at etching times higher than tb + 8 min.
The exact determination of nanopore size and shape is a challenge associated with numerous potential applications of nanopore-based devices. Very often, the nanopores are employed in electrolyte solutions, and the electrical conductance is taken to be a measure of the nanopore dimensions. However, the shape of the pore cannot be determined solely from conductance measurements in the absence of any additional information or reasonable presumptions. In the present work, we applied a previously introduced method for the characterization of so-called conical track-etched pores.53 The method includes conductance measurements performed during the chemical etching of an ion-irradiated foil. The analysis of conductance vs. time, in combination with the time dependence of the pore size on the foil surface, made it possible to determine the whole longitudinal profile of the pore. The implied presumptions are (a) the pore etches symmetrically from both sides; (b) the etching front subsequently reproduces itself when moving along the track axis; and (c) the specific conductivity of the etching solution in the pore is equal to the bulk value. The symmetry was ensured in our experiments by the use of bombarding ions (U, Au, Fe), the kinetic energy of which was high enough so that the energy loss was nearly constant in the 12 μm-thick foils (see Table 1). The only exception was the Xe ion with an energy of 1.2 MeV u−1: its energy loss was reduced by 27% as the ion passed through the foil. Nevertheless, this has lead to only a slight asymmetry. As seen in Fig. 5a, the constriction is shifted, relative to the center plane of the foil, by a distance of 0.5–1 μm. For all the other ions, the etched pores were symmetrical. As to points (b) and (c), these conditions are fulfilled as long as the concentration of etchant in the pore is constant. A very high concentration of electrolyte suggests that the effect of surface charge on the specific conductivity in the pores is negligible. We also performed etching experiments at sufficiently different temperatures to show that the process was not diffusion-limited, assuring a homogeneous distribution of etchant concentration in the pores. Note that this is not the case when the etch solution contains a surfactant, the adsorption front of which moves slower than the alkali ions diffusing into the pores.42 Therefore, the reconstruction algorithm is not applicable to surfactant-controlled track etching. It should be mentioned that the surfactant-controlled etching provides another interesting geometry, namely, spindle-shaped pores.55 The presence of two nanoscale-sized pore mouths, which can be functionalized individually, opens up the door to a wide variety of nanofluidic circuits.56 Compared to the double-cone geometry, the situation is opposite, with the small radius at pore ends, and the large radius in the pore middle. In this case the SEM technique seems to be the only reliable method to determine the pore geometry while the etching conductometric measurements can serve for a rough estimate of the inside pore radius.55 The information hidden in the G(t) function cannot be extracted to provide quantitative determination of the pore axial profile until significant progress is made in the understanding of the diffusion, adsorption and surface protection effect of the surfactant in narrow channels.
The long-standing question about the fluctuating and voltage-gated behavior of asymmetrical pores with apparent small radii of a few nanometers remains open, though new experimental findings provide credible explanations. The analysis of the conductometric data for ion tracks with a relatively low track-to-bulk etch rate ratio suggests that the extremely narrow, unstable pores in PET may contain parts that have not been etched out completely. This hypothesis has been made before;29 electrical conductivity studies of under-etched ion tracks in polymers seem to support this point of view.31 Another relevant problem is the specific conductivity in channels as narrow as 1–2 nm, which has been reported to be different from the bulk value even for highly concentrated solutions.57
Conclusions and outlook
The accurate reconstruction of the pore shape, with the focus on the tip region, shows that the asymmetrical pores produced by one-sided etching have a larger critical radius and a longer narrow part than previously thought. This finding should be taken into account when studying ion and molecule transport processes, the application of nanopores in resistive-pulse sensing and in other cases. Important parameters such as the electrical field, dwell time, and ionic selectivity critically depend on the pore constriction geometry. An example is the modeling of photo-triggered and pH-tunable membranes, which has been refined with the use of the corrected nanopore shape.58 The calculations performed in the present paper show that the ion current rectification properties of funnel-shaped pores significantly differ from those of conical pores, provided the tip radius is smaller than ∼10 nm. For larger tip radii, i.e., when the pore is subjected to additional two-sided etching after breakthrough, the ion transport properties of these two pore configurations become almost indistinguishable.Based on the data for two-sided (symmetrical) track etching, we reconstructed the pore profiles for one-sided etching. We assumed that contact of the opposite side of the foil with a stop-etch solution did not affect the tip shape, as long as the etchant had not broken through the foil. Strictly speaking, this is in actuality not true. The neutralizing agent can diffuse along the latent track and change, at least slightly, the etching conditions in the tip region.31 In this context, the development of a method for estimating the geometry of the asymmetrical nanopore, exactly as it is after fabrication, would be of considerable importance. Recently, new approaches to the quantitative characterization of nanopores drilled in thin inorganic films have been suggested.59–61 The dependence of nanopore conductance on ionic strength, in combination with selective surface functionalization, can be used to accurately determine the nanopore shape and size. Application of this concept to asymmetrical track-etched pores could be the next step towards comprehensive knowledge of their geometry.
Acknowledgements
The authors are grateful to the Material Research group (GSI Darmstadt) for providing irradiated samples. The authors thank O. M. Ivanov for the irradiation of the polymer foils with accelerated ions. The help with SEM imaging provided by N. E. Lizunov is also appreciated. P. R. acknowledges financial support from the Generalitat Valenciana (project PROMETEO/GV/0069), Ministry of Science and Innovation of Spain, Materials Program (project MAT2012-32084), and FEDER. This research has been partially supported by the Cooperation Program between Polish scientific institutions and JINR (theme 04-5-1076-2009/2014, regulation number 62 of February 11, 2013).References
- H. Bayley and C. R. Martin, Chem. Rev., 2000, 100, 2575 CrossRef CAS PubMed.
- C. Dekker, Nat. Nanotechnol., 2007, 2, 209 CrossRef CAS PubMed.
- K. Healy, B. Schiedt and A. Morrison, Nanomedicine, 2007, 2, 875 CrossRef CAS PubMed.
- R. B. Schoch, J. Han and P. Renaud, Rev. Mod. Phys., 2008, 80, 839 CrossRef CAS.
- S. Howorka and Z. Siwy, Chem. Soc. Rev., 2009, 38, 2360 RSC.
- M. Wanunu, Phys. Life Rev., 2012, 9, 125 CrossRef PubMed.
- P. Stroeve and N. Ileri, Trends Biotechnol., 2011, 29, 259 CrossRef CAS PubMed.
- J. Cervera, P. Ramirez, S. Mafe and P. Stroeve, Electrochim. Acta, 2011, 56, 4504 CrossRef CAS PubMed.
- A. Kocer, L. Tauk and P. Dejardin, Biosens. Bioelectron., 2012, 38, 1 CrossRef CAS PubMed.
- R. L. Fleischer, P. B. Price and R. M. Walker, Nuclear Tracks in Solids, University of California Press, Berkeley, CA, 1975 Search PubMed.
- R. Spohr, Radiat. Meas., 2005, 40, 191 CrossRef CAS PubMed.
- P. Yu. Apel, Yu. E. Korchev, Z. Siwy, R. Spohr and M. Yoshida, Nucl. Instrum. Methods Phys. Res., Sect. B, 2001, 184, 337 CrossRef CAS.
- Z. Siwy, Y. Gu, H. Spohr, D. Baur, A. Wolf-Reber, R. Spohr, P. Apel and Y. Korchev, Europhys. Lett., 2002, 60, 349 CrossRef CAS.
- A. Mara, Z. Siwy, C. Trautmann, J. Wan and F. Kamme, Nano Lett., 2004, 4, 497 CrossRef CAS.
- B. Schiedt, K. Healy, A. P. Morrison, R. Neumann and Z. Siwy, Nucl. Instrum. Methods Phys. Res., Sect. B, 2005, 236, 109 CrossRef CAS PubMed.
- J. Cervera, B. Schiedt, R. Neumann, S. Mafe and P. Ramirez, J. Chem. Phys., 2006, 124, 104706 CrossRef PubMed.
- Z. S. Siwy, M. R. Powell, A. Petrov, E. Kalman, C. Trautmann and R. S. Eisenberg, Nano Lett., 2006, 6, 1729 CrossRef CAS PubMed.
- Y. Choi, L. A. Baker, H. Hillebrenner and C. R. Martin, Phys. Chem. Chem. Phys., 2006, 8, 4976 RSC.
- C. C. Harrell, Y. Choi, L. P. Horne, L. A. Baker, Z. S. Siwy and C. R. Martin, Langmuir, 2006, 22, 10837 CrossRef CAS PubMed.
- X. Wang, J. Xue, L. Wang, W. Guo, W. Zhang, Y. Wang, Q. Liu, H. Ji and Q. Quyang, J. Phys. D: Appl. Phys., 2007, 40, 7077 CrossRef CAS.
- Q. Liu, Y. Wang, W. Guo, H. Ji, J. Xue and Q. Quyang, Phys. Rev. E: Stat. Phys., Plasmas, Fluids, Relat. Interdiscip. Top., 2007, 75, 051201 CrossRef.
- J. Cervera, A. Alcaraz, B. Schiedt, R. Neumann and P. Ramirez, J. Phys. Chem. C, 2007, 111, 12265 CAS.
- J. E. Wharton, P. Jin, L. T. Sexton, L. P. Horne, S. A. Sherrill, W. K. Mino and C. R. Martin, Small, 2007, 2, 1424 CrossRef PubMed.
- I. Vlassiouk, S. Smirnov and Z. S. Siwy, ACS Nano, 2008, 2, 1589 CrossRef CAS PubMed.
- W. Guo, J. M. Xue, W. M. Zhang, X. Q. Zou and Y. G. Wang, Radiat. Meas., 2008, 43, S623 CrossRef CAS PubMed.
- I. D. Kosinska, I. Goychuk, M. Kostur, G. Schmid and P. Hänggi, Phys. Rev. E: Stat. Phys., Plasmas, Fluids, Relat. Interdiscip. Top., 2008, 77, 03113 CrossRef.
- P. Ramirez, P. Yu. Apel, J. Cervera and S. Mafe, Nanotechnology, 2008, 19, 315707 CrossRef PubMed.
- F. Xia, W. Guo, Y. Mao, Y. Hou, J. Xue, H. Xia, L. Wang, Y. Song, H. Ji, Q. Quyang, Y. Wang and L. Jiang, J. Am. Chem. Soc., 2008, 130, 8345 CrossRef CAS PubMed.
- M. Ali, V. Bayer, B. Schiedt, R. Neumann and W. Ensinger, Nanotechnology, 2008, 19, 485711 CrossRef PubMed.
- M. L. Kovarik, K. Zhou and S. C. Jacobson, J. Phys. Chem. B, 2009, 113, 15960 CrossRef CAS PubMed.
- D. Fink, J. Vacik, V. Hnatowicz, G. N. Mufloz, L. Alfonta and I. Klinkovich, Radiat. Eff. Defects Solids, 2010, 165, 343 CrossRef CAS.
- I. Vlassiouk, T. R. Kozel and Z. S. Siwy, J. Am. Chem. Soc., 2009, 131, 8211 CrossRef CAS PubMed.
- E. B. Kalman, O. Sudre, I. Vlassiouk and Z. S. Siwy, Anal. Bioanal. Chem., 2009, 394, 413 CrossRef CAS PubMed.
- M. Ali, P. Ramirez, S. Mafe, R. Neumann and W. Ensinger, ACS Nano, 2009, 3, 603 CrossRef CAS PubMed.
- H. Mukaibo, L. P. Horne, D. Park and C. R. Martin, Small, 2009, 5, 2474 CrossRef CAS PubMed.
- L. T. Sexton, H. Mukaibo, P. Katira, H. Hess, S. A. Sherrill, L. P. Horne and C. R. Martin, J. Am. Chem. Soc., 2010, 132, 6755 CrossRef CAS PubMed.
- L. Innes, M. R. Powell, I. Vlassiouk, C. Martens and Z. S. Siwy, J. Phys. Chem. C, 2010, 114, 8126 CAS.
- C. Kubeil and A. Bund, J. Phys. Chem. C, 2011, 115, 7866 CAS.
- M. R. Powell, N. Sa, M. Davenport, K. Healy, I. Vlassiouk, S. E. Létant, L. A. Baker and Z. S. Siwy, J. Phys. Chem. C, 2011, 115, 8775 CAS.
- L. Wang, L. Sun, C. Wang, L. Chen, L. Cao, G. Hu, G. Xue and Y. Wang, J. Phys. Chem. C, 2011, 115, 22736 CAS.
- B. Zhang, Y. Ai, S. W. Joo and S. Qian, J. Phys. Chem. C, 2011, 115, 24951 CAS.
- P. Yu. Apel, I. V. Blonskaya, O. L. Orelovitch, P. Ramirez and B. A. Sartowska, Nanotechnology, 2011, 22, 175302 CrossRef PubMed.
- J.-F. Pietschman, M.-T. Wolfram, M. Burger, C. Trautmann, M. Pevarnik, V. Bayer and Z. Siwy, Phys. Chem. Chem. Phys., 2013, 15, 16917 RSC.
- D. Gillespie, D. Boda, Y. He, P. Apel and Z. S. Siwy, Biophys. J., 2008, 95, 609 CrossRef CAS PubMed.
- E. B. Kalman, I. Vlassiouk and Z. S. Siwy, Adv. Mater., 2008, 20, 293 CrossRef CAS.
- M. Davenport, A. Rodriguez, K. J. Shea and Z. S. Siwy, Nano Lett., 2009, 9, 2125 CrossRef CAS PubMed.
- X. Hou, F. Yang, L. Li, Y. Song, L. Jiang and D. Zhu, J. Am. Chem. Soc., 2010, 132, 11736 CrossRef CAS PubMed.
- H. Zhang, Y. Tian and L. Jiang, Chem. Commun., 2013, 49, 10048 RSC.
- P. Apel, Radiat. Meas., 2001, 34, 559 CrossRef CAS.
- D. Albrecht, P. Armbruster, R. Spohr, M. Roth, K. Schaupert and H. Stuhrmann, Appl. Phys. A: Solid Surf., 1985, A37, 37 CAS.
- S. A. Saleh and Y. Eyal, Nucl. Instrum. Methods Phys. Res., Sect. B, 2005, 236, 81 CrossRef PubMed.
- P. Yu. Apel, I. V. Blonskaya, V. R. Oganessian, O. L. Orelovitch and C. Trautmann, Nucl. Instrum. Methods Phys. Res., Sect. B, 2001, 185, 216 CrossRef CAS.
- P. Yu. Apel, I. V. Blonskaya, O. L. Orelovitch, B. A. Sartowska and R. Spohr, Nanotechnology, 2012, 23, 225503 CrossRef PubMed.
- J. F. Ziegler, J. P. Biersack and U. Littmark, The Stopping and Range of Ions in Solids, Pergamon, New York, 1985, Free SRIM software is available from the website, http://www.srim.org/ Search PubMed.
- P. Yu. Apel, I. V. Blonskaya, A. Yu. Didyk, S. N. Dmitriev, O. L. Orelovitch, D. Root and L. I. Samoilova, Nucl. Instrum. Methods Phys. Res., Sect. B, 2001, 179, 55 CrossRef CAS.
- M. Ali, P. Ramirez, H. Q. Nguen, S. Nasir, J. Cervera, S. Mafe and W. Ensinger, ACS Nano, 2012, 6, 3631 CrossRef CAS PubMed.
- C. Ho, R. Qiao, J. B. Heng, A. Chatterjee, R. J. Timp, N. R. Aluru and G. Timp, Proc. Natl. Acad. Sci. U. S. A., 2005, 102, 10445 CrossRef CAS PubMed.
- S. Nasir, P. Ramirez, M. Ali, I. Ahmed, L. Fruk, S. Mafe and W. Ensinger, J. Chem. Phys., 2013, 138, 034709 CrossRef PubMed.
- Y. Liebes, M. Drozdov, Y. Y. Avital, Y. Kauffmann, H. Rapaport, W. D. Kaplan and N. Ashkenasy, Appl. Phys. Lett., 2010, 97, 223105 CrossRef PubMed.
- C. M. Frament and J. R. Dwyer, J. Phys. Chem. C, 2012, 116, 23315 CAS.
- C. M. Frament, N. Bandara and J. R. Dwyer, ACS Appl. Mater. Interfaces, 2013, 5, 9330 CAS.
| This journal is © the Owner Societies 2014 |

