 Open Access Article
 This Open Access Article is licensed under a
 Creative Commons Attribution 3.0 Unported Licence
Improved efficiency of bulk heterojunction hybrid solar cells by utilizing CdSe quantum dot–graphene nanocomposites†
Michael
Eck
ab,
Chuyen Van
Pham
ab,
Simon
Züfle
cd,
Martin
Neukom
d,
Martin
Sessler
ae,
Dorothea
Scheunemann
f,
Emre
Erdem
g,
Stefan
Weber
g,
Holger
Borchert
f,
Beat
Ruhstaller
cd and
Michael
Krüger
*ab
aFreiburg Materials Research Center (FMF), University of Freiburg, Stefan-Meier-Straße 21, D-79104 Freiburg, Germany. E-mail: Michael.Krueger@fmf.uni-freiburg.de
bDepartment of Microsystems Engineering (IMTEK), University of Freiburg, Georges-Köhler-Allee 103, D-79110 Freiburg, Germany
cInstitute of Computational Physics, Zurich University of Applied Sciences (ZHAW), Technikumstrasse. 9, CH-8401 Winterthur, Switzerland
dFluxim AG, Technoparkstrasse 2, CH-8406 Winterthur, Switzerland
eFraunhofer Institute for Solar Energy Systems (ISE), Heidenhofstraße 2, D-79110 Freiburg, Germany
fDepartment of Physics, Carl von Ossietzky University of Oldenburg, Carl-von-Ossietzky-Straße 9-11, D-26129 Oldenburg, Germany
gInstitute of Physical Chemistry, University of Freiburg, Albertstraße 21, D-79104 Freiburg, Germany
First published on 24th April 2014
Abstract
We present a significant efficiency enhancement of hybrid bulk heterojunction solar cells by utilizing CdSe quantum dots attached to reduced graphene oxide (rGO) as the electron accepting phase, blended with the PCPDTBT polymer. The quantum dot attachment to rGO was achieved following a self-assembly approach, recently developed, using thiolated reduced graphene oxide (TrGO) to form a TrGO–CdSe nanocomposite. Therefore, we are able to obtain TrGO–CdSe quantum dot/PCPDTBT bulk-heterojunction hybrid solar cells with power conversion efficiencies of up to 4.2%, compared with up to 3% for CdSe quantum dot/PCPDTBT devices. The improvement is mainly due to an increase of the open-circuit voltage from 0.55 V to 0.72 V. We found evidence for a significant change in the heterojunction donor–acceptor blend nanomorphology, observable by a more vertical alignment of the TrGO-quantum dot nanocomposites in the z-direction and a different nanophase separation in the x–y direction compared to the quantum dot only containing device. Moreover, an improved charge extraction and trap state reduction were observed for TrGO containing hybrid solar cells.
Introduction
Hybrid bulk heterojunction (BHJ) solar cells fabricated from nanocrystals (NCs) and conjugated polymers have undergone a remarkable development over the past few years.1,2 Already in the seminal work of Greenham et al.3 in 1996 one of the main obstacles to be overcome in hybrid BHJ solar cells was realized: the inefficient electron transport between individual quantum dots (QDs) within the active layer. To solve this problem, different post-synthetic treatments for QDs and other differently shaped NCs have been applied in order to enable the exchange of the long insulating alkyl chain containing synthetic ligands with shorter molecules, like pyridine,4–13tert-butylthiol,14 or ethanedithiol (EDT)15–17 with its ability to link two NCs, or even to link NCs to the polymer.16 And recently, we introduced a post-synthetic acid-based ligand-sphere removal procedure18 leading to the improved performance of CdSe QD–polymer hybrid solar cells. Improving the electron extraction along the NCs was also addressed by using more elongated NCs, so-called nanorods (NRs), instead of the spherical QDs through which electrons can move necessitating less hopping events19 for their extraction.4,7,10,12,20 Moreover, tetrapod (TP) nanocrystals with the advantage over NRs (which tend to align horizontally21) to have one arm always extended towards the cathode were successfully utilized too.4,6,10,11 In direct comparisons solar cell efficiencies proved to be higher for devices incorporating NRs instead of QDs,10,20 and TPs were demonstrated to perform better than NRs.4,10 Also, mixtures of QDs and NRs proved to result in enhanced power-conversion efficiency (PCE);13,22 and recently multibranched NCs also reached high efficiency values.14 For facilitating the hole extraction by a similar idea of providing directed pathways for charge extraction, polymer nanofibers were successfully introduced into BHJ solar cells.16 Furthermore, the fraction of the sun spectrum absorbed by the hybrid BHJ solar cells was increased by using low band gap polymers11,23 or low band gap NCs, moving from the commonly used cadmium chalcogenides to lead chalcogenide NCs.15,24 In addition, the introduction of a metal oxide15,25 or an organic hole blocking layer16 between the NC/polymer blend and the cathode for reducing the charge carrier recombination and serving as an optical spacer further increased PCEs of hybrid BHJ solar cells. Thus, a variety of concepts – only some of which are presented here – aiming towards the improvement of hybrid BHJ solar cells have been developed. Even though some improvements are not easily transferable to other solar cell concepts, the nowadays highest PCEs are reached by combining a manifold of improvements achieved over the past nearly two decades. The second highest reported PCE of 4.1% has been achieved by Ren and coworkers16 by facilitating the hole extraction using polymer nanofibers decorated with EDT treated CdS QDs and utilization of bathocuproine (BCP) as an organic hole-blocking layer. However, the highest reported PCE of 4.7% for hybrid BHJ solar cells using a single photoactive layer was recently achieved by Zhou et al.17 using CdSe NRs. They combined the above-mentioned advantages utilizing EDT treated high aspect ratio NRs, blended with the low band gap polymer poly[2,6-(4,4-bis-(2-ethylhexyl)-4H-cyclopenta[2,1-b;3,4-b′]-dithiophene)-alt-4,7-(2,1,3-benzothiadiazole)] (PCPDTBT). In this work, we introduce a novel hybrid material approach by utilization of thiolated reduced graphene oxide (TrGO) as a backbone for the electron extraction from CdSe quantum dots in BHJ QD/polymer solar cells. In purely organic BHJ solar cells there are several reports on the utilization of graphene, attempting to replace the expensive ITO (indium tin oxide),26–29 as flexible substitution of the metal top electrode,30 as an electron acceptor in the donor–acceptor blend31–33 or as an electron extraction layer when decorated with PCBM (phenyl-C61-butyric acid methyl ester).34 However, these reports resulted only in a relative improvement of purely organic BHJ solar cells, but usually could not reach PCEs in the range of state-of-the-art cells. Recently, a promising result for hybrid NC/polymer BHJ solar cells was published by Tong et al.,61 describing a PCE of 1.4% using CdTe TP decorated oleylamine functionalized rGO blended within the polymer matrix. This result has even been improved to a PCE of 3.3% by using type II CdTe/CdSe TPs which are assumed to improve the separation of excitons.In the following, we are reporting for the first time the introduction of CdSe QD-decorated graphene nanocomposites into the active layer of hybrid BHJ solar cells, using a TrGO–CdSe QD hybrid material.35,62 This method was applied on a CdSe QD/PCPDTBT solar cell system by which we previously reported PCEs of 2.7%23 following our post-synthetic acid-based ligand sphere reduction procedure for CdSe QDs.18 By following the same approach, we could now improve the PCE with TrGO-QD/polymer BHJ solar cells up to 4.2%. We observed a more efficient electron extraction from the active layer towards the Al electrode, and a significantly higher open-circuit voltage together with a significant change in the nanomorphology within the photoactive layer for TrGO containing hybrid solar cells compared to TrGO free devices.
Experimental
CdSe QD synthesis
The CdSe QDs were synthesized according to Yuan et al.59 Here, only the precursor concentration was doubled to increase the QD homogeneity, which on the other hand leads to smaller NCs (with their 1st excitonic absorption peak at about 645 nm instead of 665 nm in the direct comparison). First, 2898 mg (12 mmol) of HDA (hexadecylamine, ≥95%, Merck Schuchardt), 3092 mg (8 mmol) of TOPO (trioctylphosphine oxide, 99%, Sigma-Aldrich), and 444 mg (0.4 mmol) of Cd-stearate were heated up under a nitrogen atmosphere inside a 25 ml three neck flask to 300 °C. After reaching 300 °C, 400 μl (0.4 mmol) of a 1 M solution of selenium in TOP (trioctylphosphine, 97%, ABCR) was rapidly injected. The synthesis was continued at 300 °C under stirring and stopped after 30 min.TrGO synthesis
In brief, graphene oxide (GO) was synthesized from graphite by a modified Hummers Method.60 Subsequently, GO was simultaneously reduced and thiol-functionalized by the procedure reported in our previous work35 with phosphorus pentasulfide (P4S10) in DMF (dimethylformamide, ≥99.8%, Carl Roth) at 120 °C under vacuum for 12 h. The final product was collected using a Whatman NL 16 polyamide 0.2 μm membrane filter. Subsequently, a washing procedure of the TrGO on the membrane filter was conducted. Therefore, first DMF (≥99.8%, Carl Roth) was added in the recipient over the membrane filter and left for 30 min for soaking. Afterwards the DMF was actively soaked through the filter membrane by applying vacuum on the flask below the membrane. The same procedure was repeated a second time to further clean the product. TrGO was then redispersed at a high concentration of 1 mg ml−1 in DMF, for easily weighing the material, and homogenized for 10 min in an ultrasonic bath. Afterwards, the TrGO concentration was reduced by dilution to 50 μg ml−1. But, the actual concentration in the TrGO dispersion still decreased by precipitation, therefore the TrGO concentration must be <50 μg ml−1. However, after about 1 day the non-precipitated particles dispersed in the DMF formed a quasi stable dispersion. Scanning electron microscope (SEM) images reveal diameters of these TrGO flakes of a wide range from ca. 3 μm down to 80 nm. Larger particles seem to be composed of aggregated sheets of about 1 μm in length (see Fig. S1c, ESI†).TrGO–CdSe hybrid formation
The CdSe QDs, as-obtained from the synthesis, were dissolved with a concentration of 1 mg of CdSe NCs per 2.5 ml of hexanoic acid and stirred for 15 min at 110 °C. In the following, the double volume of methanol was added to the solution that was stirred for another 7 min in order to precipitate the CdSe QDs. To separate the QDs from the liquid, the dispersion was centrifuged using the Eppendorf MiniSpin® plus centrifuge for 1 min at 14.5 krpm. To remove the remaining free hexanoic acid, the NCs were redispersed in CHCl3 with 2 mg ml−1 and stirred at 105 °C for 1 min. Consequently, a triple volume of methanol was added, and the NCs were further stirred for 3 min at 105 °C, after that they were collected by centrifugation for 30 s at 14.5 krpm. Chlorobenzene (CB) was added to obtain a CdSe QD concentration of 24 mg ml−1. For 1 mg of CdSe QDs 50 μl of <50 μg ml−1 TrGO dispersion in DMF were taken and centrifuged in a 2 ml Eppendorf centrifugation tube for 3 min. Afterwards, all DMF solution was carefully removed by beating the centrifugation tube headfirst on a paper towel. Finally, the CdSe QDs/CB solution was added into the centrifugation tube with the collected TrGO inside, resulting in a weight ratio of 1000![[thin space (1/6-em)]](https://www.rsc.org/images/entities/char_2009.gif) :<2.5 (CdSe QDs:TrGO) and stirred for 45 s at the maximum speed using a vortex mixer.
:<2.5 (CdSe QDs:TrGO) and stirred for 45 s at the maximum speed using a vortex mixer.
Solar cell manufacturing
The utilized solar cells are generally similar to the ones previously published by Zhou et al.,23 only for the TrGO–CdSe/PCPDTBT solar cells the TrGO–CdSe hybrid was utilized instead of CdSe QDs only. The cells were fabricated from three CdSe QD batches resulting in relatively monodisperse spherical quantum dots with a typical diameter of 6 nm showing an average PL peak position of 658.4 ± 7.7 nm, an average full width at half maximum (FWHM) of 29.7 ± 1.1 nm, and an average 1st excitonic absorption peak at 637.3 ± 5 nm. The CdSe/CB solution with a NC concentration of 24 mg ml−1 was mixed in a weight ratio of 88:12 with a 20 mg ml−1 solution of PCPDTBT with a molecular weight of Mn = 10–20 kDa purchased from 1-Material in CB. Respectively, the TrGO–CdSe QD/CB solution was mixed with PCPDTBT/CB solution in a weight ratio of 85:15, which was found to be the optimum ratio according to experiments shown in Fig. S6 (ESI†). The final ink was spun cast using the WS400-6NPP-Lite spin coater from Laurell Technologies at 800 rpm for 30 s followed by a 60 s drying step at 1800 rpm, resulting in an active layer thickness of about 80 nm. The spin coating was done on a self structured ≤10 Ωsq ITO substrate from Präzisions Glas & Optik GmbH, that was treated for 5 min with oxygen plasma and spin coated using Baytron AI4083 PEDOT:PSS from HC Starck at 2000 rpm for 30 s and dried for 20 min at 160 °C, to form a 70 nm thick hole blocking layer. After thermal evaporation of an 80 nm aluminum layer the cells were annealed at 145 °C. Therein, the optimum annealing time for TrGO containing cells proved to be with an average of 14.5 min, 5 min longer than the average 9.5 min needed for CdSe/PCPDTBT solar cells to reach their optimum performance.
EPR measurements
For the electron paramagnetic resonance (EPR) measurements a dried powder sample of TrGO and one of the TrGO–CdSe QD hybrids in a quartz tube were measured using a Bruker ESP 380 spectrometer at room temperature and under ambient light conditions. Thereby, EPR spectra were recorded at 9.86 GHz (X-band) for both samples.TEM tomography
The samples were prepared by dissolving the PEDOT:PSS layer of a hybrid BHJ solar cell in a water bath. The active layer thereby delaminated from the ITO substrate after about 30 seconds and then began floating in water. Subsequently, the floating layer was collected as a planar film on a carbon film coated 300 mesh copper TEM grid (Quantifoil Micro Tools GmbH, Germany). Acquisition of tilt series for TEM tomography was performed on a Jeol JEM2100F electron microscope (Jeol Ltd., Tokyo, Japan) operated at 200 kV. All tilt series were obtained in an automatic fashion by using TEMography™ microscope control software in a tilt angle range of approximately −60° to 60° in steps of 2°. The alignment and reconstruction of the data series and visualization of the 3D reconstructed volume were carried out by using the TEMography™ software packages Composer and Visualizer-Kai (System in Frontier Inc., Tokyo, Japan).Solar cell characterization
Solar cells were measured in our laboratory inside a nitrogen filled glovebox using a computer controlled Keithley 2602A source-meter in a 2-point probe setup. The cells were individually illuminated using a LOT-Oriel Sun Simulator, housing a xenon lamp and using an AM 1.5G filter. The light is coupled to a solar cell device holder inside the glovebox by a liquid light guide from Lot-Oriel. The light intensity is adjusted using a calibrated silicon reference solar cell to match 100 mW cm−2. Solar cells were transferred inside a sealed flask to the group of dye and organic solar cells of the Fraunhofer Institute for Solar Energy Systems (ISE) for testing. First, spectral response measurements were conducted for the tested solar cells and spectral mismatch factors of 0.956 for the TrGO solar cell and 1.017 for our standard solar cell were determined. The solar cells were measured inside a glovebox in a 4-point probe setup using a computer controlled Keithley 2400 source-meter. The solar cells were illuminated using a K. H. Steuernagel Lichttechnik GmbH solar simulator through a window at the bottom of the glovebox with light intensities adjusted to the respective spectral mismatch correction factor using a calibrated reference silicon solar cell. For exact determination of the active area of our two best devices photos have been taken to exactly determine the active area represented by the overlapping region between the ITO substrate and the aluminum top electrode.Impedance, C–V and CELIV measurements
Five solar cell devices (2× CdSe QD/PCPDTBT, TrGO–CdSe QD/PCPDTBT, CdSe NR/PCPDTBT, and TrGO–CdSe NR/PCPDTBT) were sealed by fixing a 1 mm thick glass plate over their active area. Therefore, first a 25 μm thick thermoplastic film made of Surlyn® (Solaronix Meltonix 1170-25PF) was adhered by melting for 2 min on a 145 °C hot 2 cm × 1 cm × 1 mm glass plate. After cooling down the protective film on the upper side of the thermoplastic film was removed and thereby the uncovered surface was placed over the active area of the solar cell. The cell was then placed for 3 min on a 145 °C hot surface for creating a bond to the thermoplastic film and thereby completing the sealing. The cells were then transported to FLUXIM AG for CELIV (charge extraction by linear increase of voltage) examination as well as for impedance and C–V measurements. The measurements were performed using the PAIOS measurement system for steady-state, transient and AC measurements at FLUXIM AG, using the PAIOS version 1.0. Further details of the measurements are given in the ESI.†Results
TrGO–CdSe hybrid material
Thiolated reduced graphene oxide decorated with CdSe QDs was obtained according to a previously published procedure35 and is described in detail in the experimental section. The QDs are attached to the TrGO via thiol-functionalization (Fig. 1). Transmission electron microscope (TEM) images (see Fig. 1a) show the dense QD decoration on a TrGO flake.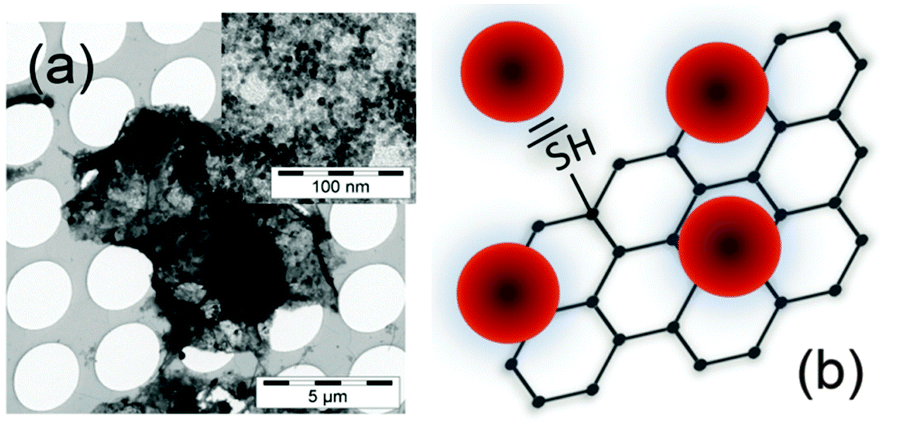 | ||
| Fig. 1 (a) TEM image of a TrGO flake decorated with CdSe QDs. Upper right inset: zoom-in on the same CdSe QD–TrGO hybrid revealing the individual QDs. (b) Schematic of the CdSe QD–TrGO hybrid material. | ||
As already demonstrated in our recent publication on the TrGO–CdSe hybrid synthesis,35 neither the absorption nor the PL spectra of the TrGO–CdSe hybrid indicate a change in the band-gap size of CdSe QDs (see Fig. S2, ESI†). However, we realized the occurrence of strong photoluminescence (PL) quenching.35 A decrease of the PL intensity to 1/3 of the original value was observed for the CdSe QDs (see Fig. S2, ESI,† right) when mixing TrGO with CdSe to form the hybrid material. This might be an indication for charge or energy transfer from the CdSe QDs to the reduced graphene oxide. Here, we prove the previously assumed direct chemical binding of CdSe QDs to TrGO using a more direct analysis method, namely by electron paramagnetic resonance (EPR) spectroscopy. EPR is able to detect unpaired electron spins due to their magnetic moments that absorb resonant microwave radiation in an externally applied magnetic field.37 In Fig. 2, the first-derivatives (with respect to the magnetic field) of the EPR absorption signals of TrGO and CdSe–TrGO are shown.
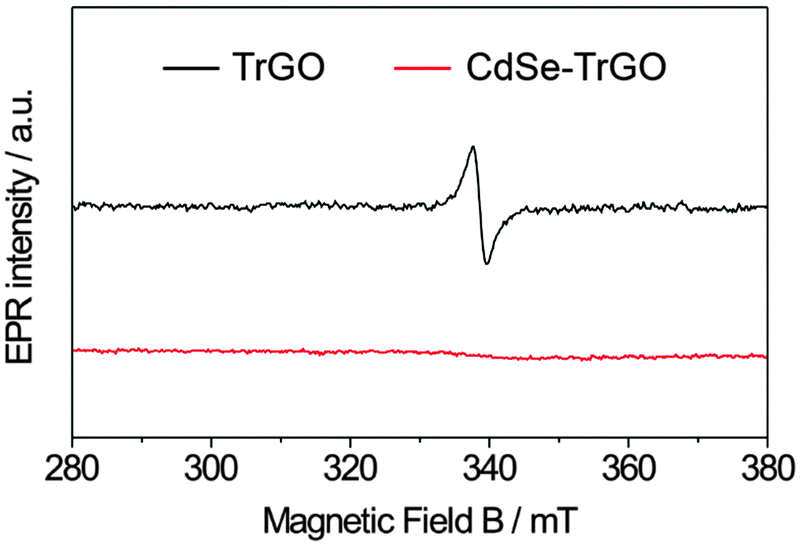 | ||
| Fig. 2 X-band electron paramagnetic resonance (EPR) spectra of illuminated TrGO (black graph) and the CdSe–TrGO hybrid (red graph) recorded at 9.86 GHz at room temperature. | ||
It is observed that the EPR signal arising from unpaired electron spins and derived from defects originally present in TrGO is completely quenched in the CdSe–TrGO hybrid material. This can be explained by the formation of a chemical bond between TrGO and CdSe QDs. Thereby, CdSe QDs are interacting with the unpaired electron spins of the TrGO by direct electronic coupling of CdSe QDs with the sp2 backbone of TrGO. Further details about the EPR investigation were reported in a recently published paper.62 Moreover, similar to our finding, Lightcap and Kamat recently reported an electron and energy transfer from photoexcited CdSe QDs towards rGO.38
TrGO–CdSe/polymer hybrid film
The morphology of the active layers of CdSe/PCPDTBT and TrGO–CdSe/PCPDTBT has been investigated by atomic force microscopy (AFM) (Fig. 3), scanning electron microscopy (SEM), and transmission electron microscopy (TEM), including TEM tomography measurements (Fig. 4). The TEM images were obtained by dissolving the PEDOT:PSS layer in water and collecting the active layer on a TEM grid.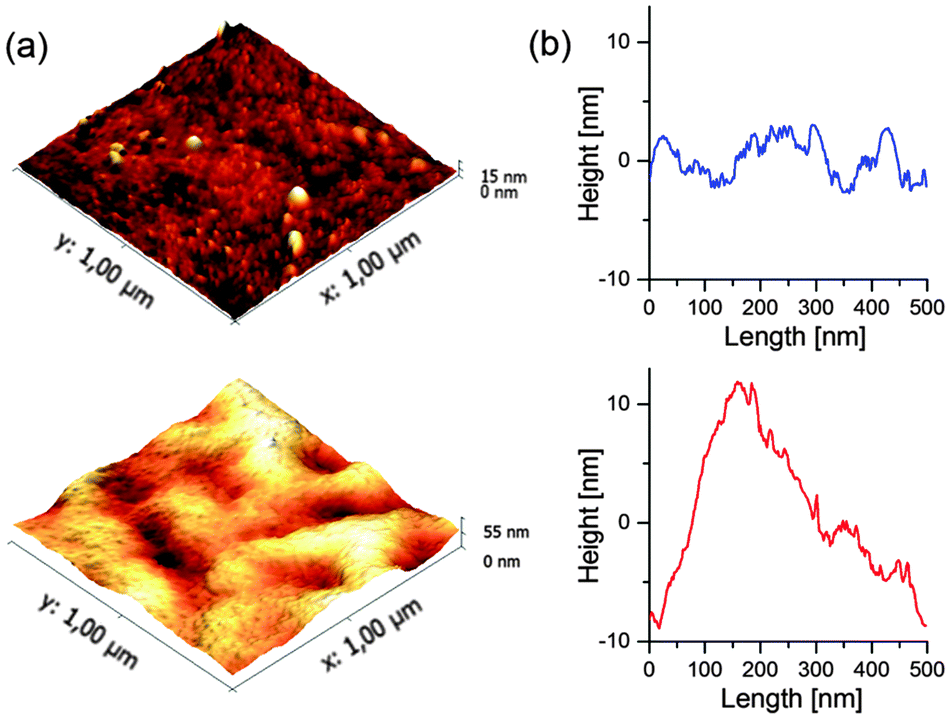 | ||
| Fig. 3 (a) AFM topographical images of the active layer surface of CdSe/PCPDTBT (top) and TrGO–CdSe/PCPDTBT solar cells (bottom) recorded in tapping mode. (b) Representative extracted AFM height profiles of CdSe/PCPDTBT (top) and TrGO–CdSe/PCPDTBT (bottom) films. | ||
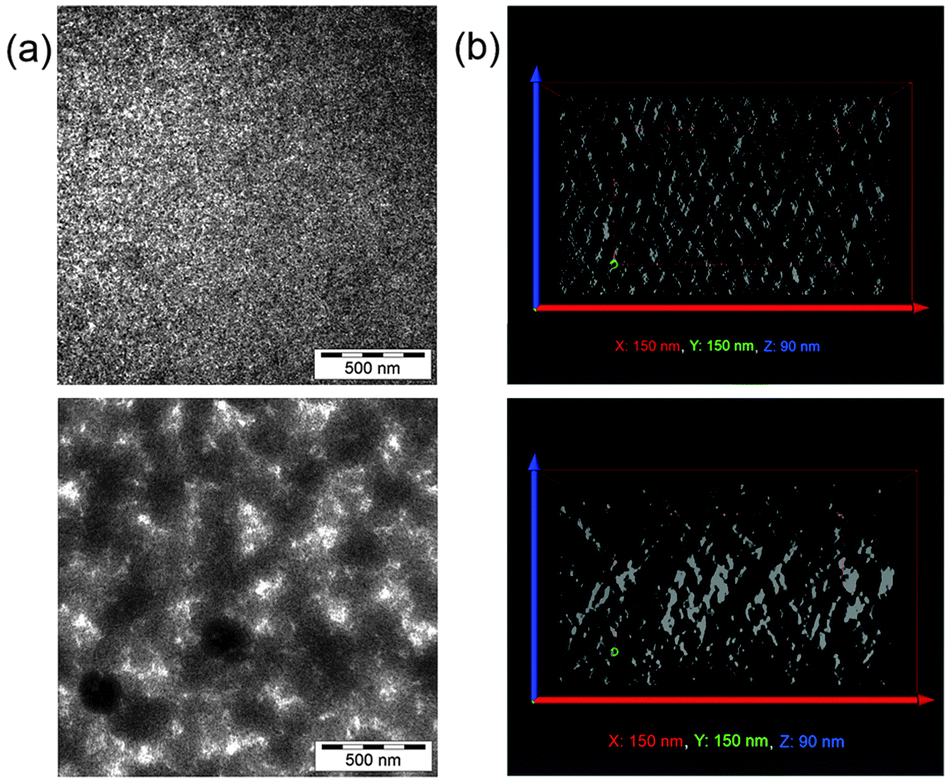 | ||
| Fig. 4 (a) TEM images of the active layer of CdSe/PCPDTBT (upper image) and TrGO–CdSe/PCPDTBT solar cells (lower image). The dark regions represent CdSe QDs and the bright regions the polymer phase. (b) x–z-cut through 3D reconstructions of the respective active layers obtained by TEM tomography. The bright regions correspond to the volume filled with CdSe. The dimensions of the reconstructed volume were 150 nm parallel to the film (x- and y-direction) and 90 nm perpendicular to the film (z-direction). | ||
From AFM micrographs (Fig. 3) one can find that the surface of the CdSe/polymer solar cells is much smoother than the surface of the CdSe–TrGO polymer solar cells. One can determine that for an area of 2 × 2 μm2 the average roughness (Ra) of the TrGO containing cells is 6.7 nm, while the CdSe/polymer solar cells show a much lower roughness with Ra = 1.15 nm.
SEM images (see Fig. S4 in the ESI†) confirm the AFM results, also demonstrating a much higher surface roughness for the TrGO containing solar cell active layer. Two-dimensional TEM images (Fig. 4a) reveal in the case of the CdSe/PCPDTBT hybrid film a relatively homogenous distribution of the QDs within the polymer, with phase separation in the x–y plane (parallel to the film) on the scale of a few nm. In contrast, for the TrGO-containing hybrid film, one can find a different distribution of the organic and inorganic compounds resulting in a coarser phase separation in the x–y plane. To get deeper insight into the three-dimensional morphology of the active layers, an electron tomography analysis, visualizing the spatial distribution of the CdSe QDs, was exemplarily performed. The analysis of slices parallel to the thin film confirmed that the TrGO-containing active layer has a coarser phase-separation (see Fig. S5 in the ESI†). Furthermore, electron tomography revealed that the QD–TrGO hybrid nanocomposites are not randomly distributed in the film. Slices through the x–z or y–z plane (see Fig. 4b) provide evidence for the formation of structures resulting in an improved interconnection of electron-transporting domains along the z-axis within the photoactive layer of CdSe QD–TrGO hybrid solar cells.
TrGO–CdSe/PCPDTBT hybrid solar cell performance
Solar cells were prepared according to the description given in the experimental part. The design of the utilized solar cells is depicted schematically in Fig. 5. It comprises a pre-structured ITO anode, a 70 nm PEDOT:PSS electron blocking layer, a ca. 80 nm thick hybrid CdSe NC/polymer or a CdSe NC–TrGO/polymer active layer, and a ca. 80 nm thick aluminum cathode. No additional hole blocking layer was introduced.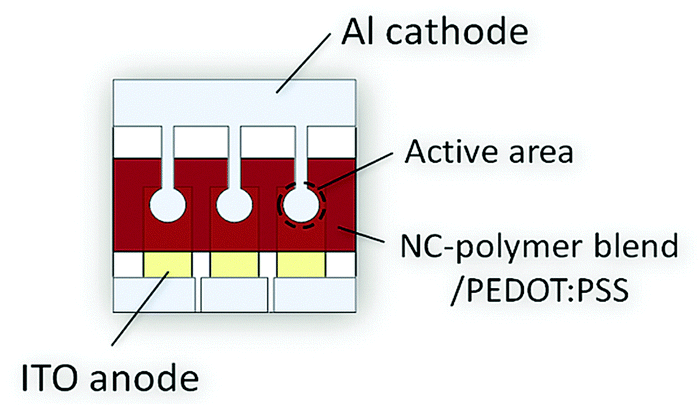 | ||
| Fig. 5 Top view of the design of the utilized hybrid BHJ device containing three individual solar cells (left, middle, and right) on one substrate. The active layer consists either of a blend of CdSe NCs and the PCPDTBT polymer or of a blend of the CdSe NC–TrGO hybrid plus PCPDTBT. | ||
At first, the optimum CdSe QD to polymer ratio in the TrGO–CdSe/polymer and CdSe/polymer devices was determined from 114 individual solar cells on 38 substrates (see ESI,† Fig. S6). As a result, it was determined that the TrGO-containing cells reach their highest short-circuit current at a lower QD/polymer weight ratio of 85%, compared with the standard CdSe QDs containing hybrid solar cells with their optimum at 88 wt%. This difference is already an indication of a better interconnection in the acceptor material of the TrGO containing cells, allowing for efficient electron percolation pathways at a lower NC fraction. Furthermore, there is a consistent trend of a higher open-circuit voltage (VOC) for the TrGO–CdSe/polymer solar cells. The VOC difference is about 0.15 V, with an average value of 0.56 V for the QD only/polymer cells and 0.71 V for the TrGO-containing cells. Thereby, even though CdSe–TrGO/polymer solar cells tend to have a smaller average JSC of about 8 mA cm−2 compared to ca. 9 mA cm−2 of the TrGO free solar cells, they exhibit higher power conversion efficiencies with an average of 3.3% compared to 2.7% mainly due to higher VOC (see ESI,† Table S1). In Fig. 6 we show the results regarding our best TrGO–CdSe/PCPDTBT solar cell containing 85 wt% CdSe and a CdSe/polymer solar cell containing 88 wt% CdSe. For verification of our results, measurements of the same devices have been performed in an external laboratory – who additionally determined spectral mismatch factors39 – 20 days after manufacturing (devices have been stored under nitrogen protection), which is also shown in Fig. 6 for comparison. Furthermore, the extracted device parameters are listed in Table 1 respectively. Surprisingly, the results were quite similar and no significant drop in performance was observed during the storage under the nitrogen atmosphere (results of all solar cells measured at the external lab are summarized in ESI,† Table S2).
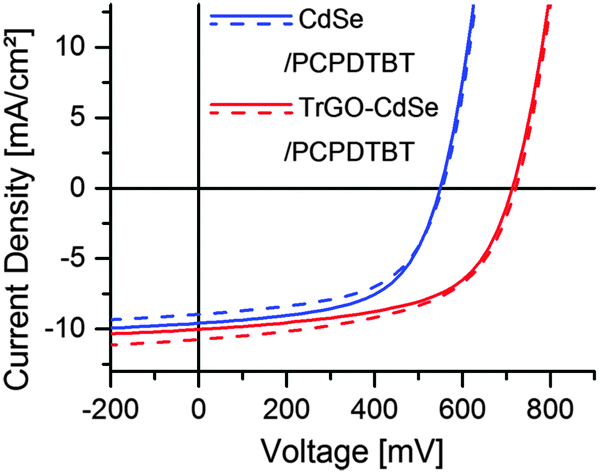 | ||
| Fig. 6 Current–density–voltage diagram for the best CdSe QD/PCPDTBT and TrGO–CdSe QD/PCPDTBT solar cells measured under AM 1.5G illumination in our laboratory (solid lines), and for comparison in the external laboratory 20 days later at the group of Dye- and Organic Solar Cells of the Fraunhofer Institute for Solar Energy Systems (ISE) (dashed lines). | ||
| Our laboratory | External laboratory | |||||||
|---|---|---|---|---|---|---|---|---|
| J SC [mA cm−2] | FF | V OC [V] | PCE [%] | J SC [mA cm−2] | FF | V OC [V] | PCE [%] | |
| CdSe/PCPDTBT | 9.58 | 0.574 | 0.549 | 3.02 | 8.96 | 0.566 | 0.554 | 2.91 |
| TrGO–CdSe/PCPDTBT | 10.02 | 0.575 | 0.713 | 4.12 | 10.74 | 0.548 | 0.721 | 4.24 |
Hence, the best CdSe/polymer solar cells resulted in efficiencies of nearly 3% and exceeded 4% for the TrGO–CdSe/polymer solar cells. Also, the observed higher open-circuit voltage could be confirmed, with the TrGO-containing solar cells exhibiting a ca. 30% higher VOC. It is noteworthy to mention that the TrGO containing solar cells have a higher fluctuation of their short circuit current, observable by a lower current of the central solar cell on each substrate – a behavior also observed in our lab (see Tables S1 and S2 in the ESI†). This might derive from an inhomogeneous distribution of TrGO within the active layer due to the centrifugal force during spin coating. Thus, a different coating technique, i.e. doctor blading, might be more suitable for manufacturing the CdSe–TrGO hybrid containing cells. The determined external quantum efficiency (EQE) spectra, recorded for spectral mismatch correction, of TrGO-QD and QD based devices, are depicted in Fig. 7a. In addition, UV-Vis absorption spectra of CdSe QDs and PCPDTBT in solution, as well as absorption spectra of the CdSe QD/PCPDTBT and TrGO–CdSe QD/PCPDTBT active layers are displayed in Fig. 7b.
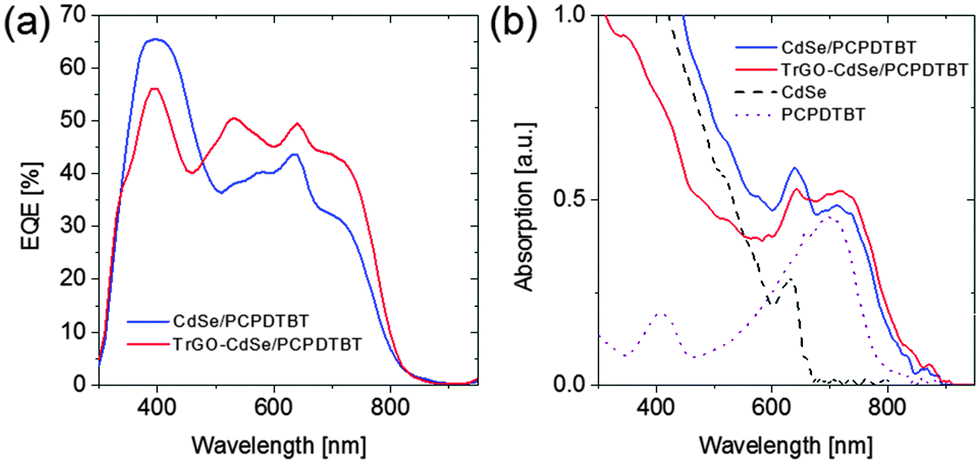 | ||
| Fig. 7 (a) External quantum efficiency (EQE) spectra from which spectral mismatch factors of 0.956 for the TrGO solar cell and 1.017 for our standard solar cell were determined. (b) Absorption spectra of the active layers out of CdSe QD/PCPDTBT with a 88:12 weight ratio, TrGO–CdSe QD/PCPDTBT with a 85:15 weight ratio of CdSe:PCPDTBT, and of solutions in chloroform from CdSe QDs and PCPDTBT. | ||
Charge extraction
To examine whether the hybrid TrGO–CdSe nanocomposite has a positive influence on the electron mobility (μe) in the hybrid solar cells, several sealed devices (see Fig. S8, ESI†) were taken to FLUXIM AG for CELIV (charge extraction by linear increase of voltage), impedance spectroscopy, and capacitance–voltage measurements using the PAIOS (Platform for All-in-one characterization of Solar cells) system, whose theoretical and practical significance of enabling the execution of multiple measurement methods within a short time on a thereby nearly unchanged sample has been demonstrated by Neukom et al.41 First, a CELIV measurement was performed in the dark and under 100 mW cm−2 illumination by a white-light LED. In the CELIV measurement a voltage ramp in reverse bias is applied to the solar cell. Extracted holes and electrons are visible as current in an external sensing circuit. The faster the charges can be extracted, the higher are their extracted mobility values.42–44 A detailed description of the measurement procedure and the extracted mobility values is given in the ESI.† The average CELIV graph obtained from two CdSe QD/polymer solar cells and one TrGO–CdSe/polymer solar cell is presented in Fig. 8. Additional CELIV measurements including solar cells with elongated NCs (NRs) are depicted in Fig. S9 (ESI†), to support that our concept of the TrGO containing NC/polymer solar cells can also be extended to elongated NCs, for which a considerable increase of VOC by 0.1 V was also observed (see Fig. S8, ESI†). However, we focus in this publication on the fabrication of CdSe QD/polymer solar cells due to our higher expertise with QD-based hybrid BHJ solar cells. The mobilities determined by the CELIV measurements of electrons and holes of QD-based BHJ solar cells with and without TrGO are listed in Table 2.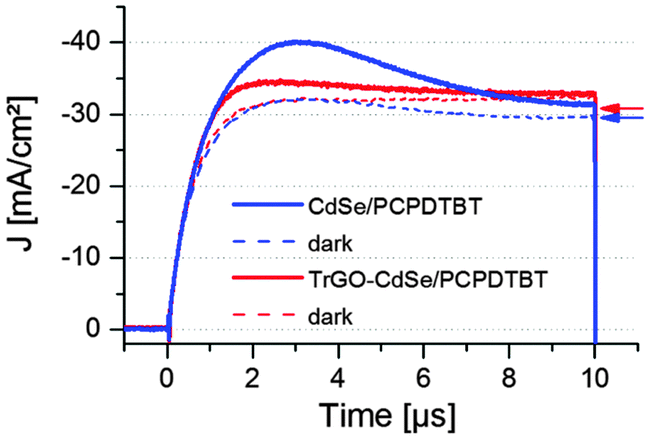 | ||
| Fig. 8 CELIV measurement results for a CdSe QD/polymer and a TrGO–CdSe QD/polymer solar cell, executed with a slope A of 400 mV μs−1 under illumination and in the dark. The respective capacitive current (j(0)) values calculated from capacitance–voltage measurements are indicated by arrows (red arrow for TrGO containing cell and blue arrow for a cell without TrGO). | ||
| μ e [cm2 V−1 s−1] | μ h [cm2 V−1 s−1] | |
|---|---|---|
| CdSe/PCPDTBT | 1.2 × 10⁻⁵ | 8 × 10⁻⁵ |
| TrGO CdSe/PCPDTBT | 2.3 × 10⁻⁵ | 8 × 10⁻⁵ |
CELIV measurements reveal that the resulting electron mobilities are approximately twice as high for cells containing CdSe QD–TrGO hybrid materials; the same also applies for the NR-based solar cells (Table S4, ESI†). The determined values of the electron mobilities are in the same range as measured by Ginger et al.45 (1 × 10⁻⁴ cm2 V−1 s−1 to 1 × 10⁻⁶ cm2 V−1) for CdSe NC films. The determined hole mobilities of 8 × 10⁻⁵ cm2 V−1 s−1 are the same in both hybrid solar cell types but nearly one order of magnitude lower than those measured from PCBM/PCPDTBT blends in ortho-dichlorobenzene (oDCB) by Morana et al.46 (4 × 10⁻⁴ cm2 V−1 s−1 to 7 × 10⁻⁴ cm2 V−1 s−1). Besides the higher electron mobility in TrGO containing cells, a noticeable aspect of the CELIV measurements (Fig. 8) is that fewer charges (86% fewer in dark and 78% fewer under illumination) are extracted from the TrGO containing cells (see Table 3). The extracted charges Q from the solar cells can be calculated – after subtraction of the calculated capacitive current density j(0) derived from the obtained capacitance C (see details on calculation of j(0) and C in the ESI†) – from the measured CELIV current integrating the remaining extracted current density Δj (Δj = jCELIV − j(0)) over time. In Table 3 the extracted charges for CELIV in the dark and under illumination are displayed.
| Extracted QD [e cm−3] in dark | Extracted QL [e cm−3] under illumination | (QL–QD) [e cm−3] | (QL–QD)/QD | |
|---|---|---|---|---|
| CdSe QD/PCPDTBT | 1.97 × 10¹⁶ | 5.00 × 10¹⁶ | 3.03 × 10¹⁶ | 1.54 |
| TrGO–CdSe QD/PCPDTBT | 0.27 × 10¹⁶ | 1.12 × 10¹⁶ | 0.86 × 10¹⁶ | 3.19 |
The results displayed in Table 3 reveal that although from the TrGO containing cells a lower quantity of charges can be extracted, the ratio of charges extracted due to illumination (QL–QD) to charges extracted in the dark QD is 3.19, about double as high for the TrGO containing cells, being an indication of a more efficient charge extraction in the TrGO–CdSe/polymer solar cell.
For obtaining the geometric capacitance of the solar cell, which was needed to calculate the capacitive current j(0) for the CELIV measurements, impedance spectroscopy (IS) measurements were performed using PAIOS (see Fig. 9). In the case of the CdSe QD/PCPDTBT and TrGO–CdSe QD/PCPDTBT solar cells the presented capacitance density/frequency plots were obtained under illumination and in the dark.
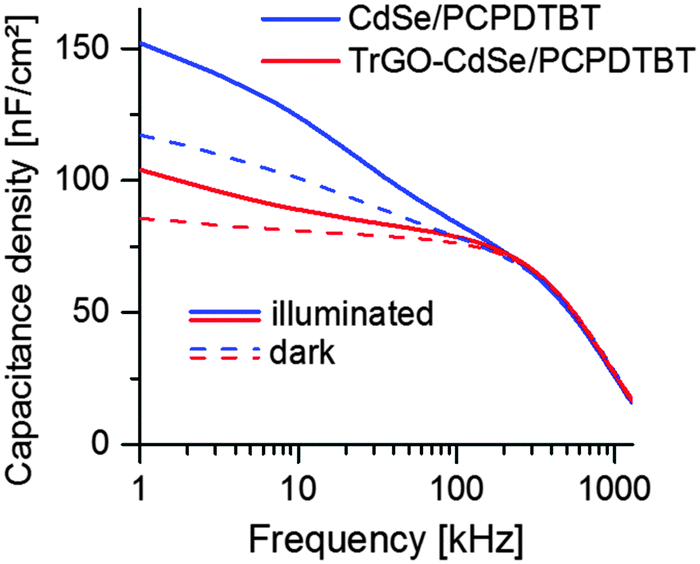 | ||
| Fig. 9 Capacitance density vs. frequency of the CdSe/polymer and TrGO–CdSe/polymer solar cells from CdSe QDs under illumination and in the dark. | ||
From the frequency-dependent capacitance one can notice that the capacitance for low frequencies is increasing with a higher slope for cells without TrGO than with TrGO (the same behavior can also be observed for NR devices, see Fig. S11, ESI†). Ideally, the capacitance should run into saturation, forming a plateau, at low frequencies. Thus, the value after the knee point would indicate the geometric capacitance. According to Knapp et al.,47 a steadily increasing capacitance for low frequencies indicates the presence of slow trap states for charges in the device. Thereby one can conclude from the IS that charge trapping is generally reduced in cells containing the TrGO–CdSe hybrid material, fitting to the less extracted charges in the CELIV experiment for TrGO containing cells. This finding is also supported by a former publication by Barkhouse et al.,36 showing that thiol passivation reduced the number of deep surface traps in colloidal quantum dots. Moreover, they report an increase of the built-in voltage for thiol capped QD solar cells. We have been measuring as well an increased built-in voltage for BHJ solar cells containing the TrGO–CdSe QD hybrid by capacitance–voltage measurements (see Fig. 10). Therein, the TrGO containing solar cells exhibited its peak capacitance at a 0.15 V higher voltage than the QD/polymer solar cell, which can be attributed to the higher built-in voltage.63 A similar effect was also confirmed in TrGO–CdSe NR containing solar cells (see ESI,† Fig. S12).
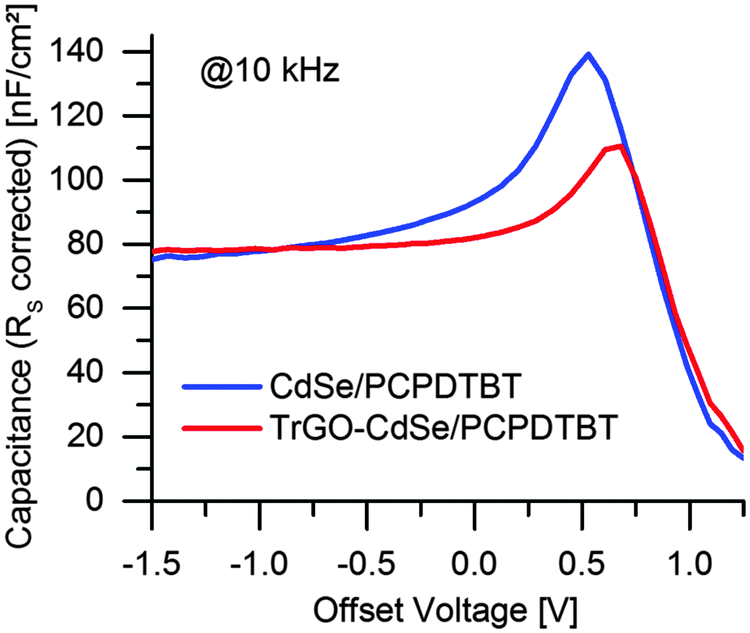 | ||
| Fig. 10 Capacitance vs. DC offset voltage at a modulation frequency of 10 kHz for CdSe QD/PCPDTBT and TrGO–CdSe QD/PCPDTBT solar cell respectively. | ||
Furthermore, Barkhouse et al.36 also observed an increased exciton dissociation efficiency for thiol passivated QDs, due to decreased nonradiative electron–hole recombination, leading to increased VOC and JSC values. This positive effect of a decreased recombination on the VOC was also shown in a more recent work by Maurano et al.40 In addition, we found a further indication for a decreasing density of trap states in the TrGO-containing device by measuring the light intensity dependence of the VOC for both solar cell types. A lower slope – representing the solar cell ideality factor – of 1.22 compared to 1.33 for the CdSe only/PCPDTBT cell was found (see Fig. S14, ESI†), indicating less trap states for charges48,49 in the TrGO containing hybrid solar cells and are leading to a reduction of trap-mediated recombination processes. The same method was also recently applied by Gao et al.,64 demonstrating that reduced ideality factors, which correspond to less deep trap states, are the cause of a higher VOC of CdSe QD/polymer BHJ solar cells.
Discussion
Here, we will discuss the observed improved performance of hybrid solar cells due to the integration of TrGO–CdSe nanocomposites into hybrid BHJ solar cells from the manifold of the presented measurements. First, we address the nature, cause, and implications of the very prominent morphological changes in the TrGO–CdSe hybrid containing solar cell. As it can be observed from AFM and SEM measurements (Fig. 3 and Fig. S4, ESI†), TrGO-containing cells exhibit a six times higher surface roughness of the active layer compared to TrGO-free solar cells. This could be attributed by TEM imaging to coarser phase segregation (Fig. 4a), induced by the TrGO. Thereby, the nanomorphology in the active layer changes from more equally distributed QDs in CdSe QD/PCPDTBT solar cells to vertically aligned CdSe QD–TrGO nanocomposites in TrGO–CdSe QD/PCPDTBT hybrid solar cells as observed by TEM tomography (Fig. 4b). There have already been several attempts to control the morphology of the BHJ films by solvent variation, showing that usually a finer phase segregation between donor and acceptor materials, typically observed by AFM surface roughness measurements, leads to higher JSC which is supposed to occur due to an increased exciton dissociation by the increased donor acceptor interfacial area.55,56 Hence, by the coarser phase segregation, in the case of TrGO–CdSe QD integration, we would expect less free charges forming initially, due to the reduced donor/acceptor interfacial area, which is in accordance with the less extracted charges observed by CELIV measurements (Fig. 8, Table 3). Moreover, the observed two-fold increase of electron mobility (Table 2) and the double ratio between charges extracted after illumination compared to charges extracted in the dark (Table 3), might to some extent be attributed to the observed vertically aligned CdSe QD–TrGO nanocomposites, proving a more efficient extraction of the generated free charges throughout the active layer. The CdSe–TrGO composites might have a different dispersibility in the solvent during its evaporation after the spin coating compared to CdSe QDs leading to the coarser phase segregation. The observed reduction of trapped charges in the TrGO solar cell, especially seen in impedance spectroscopy (Fig. 9), might be attributed to the reduction of dead ends, leading generally to improved electron percolation pathways for electron extraction (and therefore increase of electron mobility). Both might also contribute to an overall reduction of charge recombination, which would result in higher VOC values. This cause of VOC enhancement is described for all-inorganic NC solar cells to derive from passivation of NC recombination centers.50 However, the VOC enhancement achieved by reduced recombination is also reported to decrease the dark saturation current,50,51 a behavior that we could not confirm. As the observed dark saturation current for our solar cells is in the same range for both TrGO-containing and TrGO-free devices (see Fig. S13, ESI†), we cannot certainly conclude that a lower recombination by the surface trap passivation contributes to a higher VOC, at least not by following the argumentation in the previously given literature. In the following we discuss further factors which might contribute to the improved VOC values observed in TrGO-containing hybrid solar cells. An electronic coupling due to the formed chemical bond of CdSe to TrGO via a thiol-bridge, demonstrated by the EPR quenching of free TrGO electrons in the CdSe–TrGO hybrid (Fig. 2) and also to some extent by CdSe QD PL quenching in a solution containing TrGO (Fig. S2, ESI,† right), might favor a better charge separation of the electron–hole pair and improved light-induced electron transfer, which would also contribute to an increase of VOC in the TrGO containing cells. However, it is generally believed that in BHJ solar cells the difference between the donor HOMO and the acceptor LUMO is proportional to VOC.52 Hence, either a HOMO shift of the polymer or a LUMO shift of the QDs would also result in higher VOC. But, according to UV-Vis absorption and PL spectroscopy measurements of a CdSe–TrGO hybrid solution (Fig. S2, ESI†) and absorption spectroscopy of a PCPDTBT–TrGO mixture (Fig. S3, ESI†), the optical band gap is not changed. Therefore, a shift of the energy level positions (implying a simultaneous shift of HOMO and LUMO) of the acceptor material remains as an additional explanation for higher VOC in the TrGO–CdSe containing solar cells. Indeed, it has already been reported that thiol ligand exchange on CdSe NCs shifts the energy levels towards the vacuum level without affecting the band gap size.53,54 For comparison and clarification we carried out a control experiment comparing a PCBM/PCPDTBT organic solar cell with a PCBM/TrGO/PCPDTBT device that resulted in nearly no change in VOC (see Fig. S15, ESI†), indicating that TrGO does not affect the PCPDTBT band gap position, or the PCBM band edge position. Thus, we conclude that the VOC enhancement only originated from the CdSe–TrGO hybrid nanocomposite. Nevertheless, the blend morphology is also reported to influence the BHJ solar cell open circuit voltage. But, the effect on the VOC is usually considered to be small. Although, there are reports of higher VOC observable for coarser phase segregation,40,58 which are explained by a decreasing number of direct pathways within the donor and acceptor materials, reducing shortage between the anode and the cathode57and reaching the optimum VOC for a structure where the donor material is only in contact with the anode and the acceptor, and the acceptor material is only in contact with the donor and the cathode. A last noteworthy difference, probably mainly attributed to the different nanomorphology, is that in the TrGO containing solar cells, the current fraction derived from the polymer is apparently much higher than the current fraction derived from the QDs, observable in EQE and IQE spectra (Fig. S7, ESI†). The role of the QDs in the TrGO–CdSe QD hybrid is therefore more related to charge extraction than being responsible for charge generation.Conclusions
We obtained a significant improvement in PCE by incorporating QD–TrGO hybrid materials instead of QDs only into hybrid polymer solar cells. The highest reached PCE of about 4.2% is among the best values for NC–polymer hybrid solar cells and to the best of our knowledge the highest PCE of hybrid QD/polymer solar cells using a BHJ active layer. We obtained an average of 25–30% higher open-circuit voltage with values up to 0.8 V compared to the QD only based devices. Moreover, a higher electron mobility and reduction of trapped charges inside the active layer of TrGO containing solar cells has been confirmed by CELIV measurements and impedance spectroscopy respectively. The higher VOC can have multiple reasons and might be attributed to the reduction of traps and trapped charges within the active layer and to a reduction of the exciton binding energy due to the attachment of QDs to the graphene backbone. Additionally a shift of HOMO and LUMO levels of the CdSe QDs in the CdSe–TrGO hybrid and morphological reasons due to the coarser phase segregation can contribute to the VOC enhancement in CdSe–TrGO hybrid solar cell devices. Although fewer free charges are formed in the TrGO containing solar cells at the reduced donor–acceptor contact area, a more efficient charge extraction was observed, leading to short circuit currents of comparable magnitude in both device types. However, additional investigations are needed to further elucidate the impact of the TrGO in the BHJ solar cell, as well as further optimization of the BHJ nanomorphology of respective active films towards increasing the donor acceptor interfacial area, which promises an even stronger PCE increase of TrGO containing solar cells. First results show that these improvements can be transferred to CdSe NR based solar cells, pointing towards a general applicability of the presented concept for BHJ NC–graphene/polymer solar cells. The QD–graphene nanocomposite concept might be even extended to other material combinations to open further perspectives for the improvement of device efficiency and performance of hybrid solar cells in general and might be successfully applied also in other optoelectronic applications.Acknowledgements
We acknowledge R. Thomann for the performed TEM measurements, F.-S. Riehle for fruitful discussions and for supplying a sample of CdSe nanorods, and S. Tu for her support with EPR measurements. Furthermore, we thank the German Science Foundation (DFG) Graduate School “Micro Energy Harvesting” (GRK1322), the Vietnam International Education Development (VIED) program as well as the “EWE-Nachwuchsgruppe Dünnschicht-Photovoltaik,” by the EWE AG, Oldenburg, for funding.References
- Y. Zhou, M. Eck and M. Krueger, Energy Environ. Sci., 2010, 3, 1851–1864 CAS.
- F. Gao, S. Ren and J. Wang, Energy Environ. Sci., 2013, 6, 2020 CAS.
- N. C. Greenham, X. Peng and A. P. Alivisatos, Phys. Rev. B: Condens. Matter Mater. Phys., 1996, 54, 17628–17637 CrossRef CAS.
- B. Q. Sun, E. Marx and N. C. Greenham, Nano Lett., 2003, 3, 961–963 CrossRef CAS.
- S. Kumar and T. Nann, J. Mater. Res., 2004, 19, 1990–1994 CrossRef CAS.
- B. Sun, H. J. Snaith, A. S. Dhoot, S. Westenhoff and N. C. Greenham, J. Appl. Phys., 2005, 97, 14914 CrossRef PubMed.
- B. Sun and N. C. Greenham, Phys. Chem. Chem. Phys., 2006, 8, 3557–3560 RSC.
- P. Wang, A. Abrusci, H. M. P. Wong, M. Svensson, M. R. Andersson and N. C. Greenham, Nano Lett., 2006, 6, 1789–1793 CrossRef CAS PubMed.
- Y. Wu and G. Zhang, Nano Lett., 2010, 10, 1628–1631 CrossRef CAS PubMed.
- S. Dayal, M. O. Reese, A. J. Ferguson, D. S. Ginley, G. Rumbles and N. Kopidakis, Adv. Funct. Mater., 2010, 20, 2629–2635 CrossRef CAS.
- S. Dayal, N. Kopidakis, D. C. Olson, D. S. Ginley and G. Rumbles, Nano Lett., 2010, 10, 239–242 CrossRef CAS PubMed.
- D. Celik, M. Krueger, C. Veit, H. F. Schleiermacher, B. Zimmermann, S. Allard, I. Dumsch, U. Scherf, F. Rauscher and P. Niyamakom, Sol. Energy Mater. Sol. Cells, 2012, 98, 433–440 CrossRef CAS PubMed.
- K. F. Jeltsch, M. Schädel, J.-B. Bonekamp, P. Niyamakom, F. Rauscher, H. W. A. Lademann, I. Dumsch, S. Allard, U. Scherf and K. Meerholz, Adv. Funct. Mater., 2012, 22, 397–404 CrossRef CAS.
- M. J. Greaney, J. Araujo, B. Burkhart, B. C. Thompson and R. L. Brutchey, Chem. Commun., 2013, 49, 8602 RSC.
- J. Seo, M. J. Cho, D. Lee, A. N. Cartwright and P. N. Prasad, Adv. Mater., 2011, 23, 3984–3988 CrossRef CAS PubMed.
- S. Ren, L.-Y. Chang, S.-K. Lim, J. Zhao, M. Smith, N. Zhao, V. Bulović, M. Bawendi and S. Gradečak, Nano Lett., 2011, 11, 3998–4002 CrossRef CAS PubMed.
- R. Zhou, R. Stalder, D. Xie, W. Cao, Y. Zheng, Y. Yang, M. Plaisant, P. H. Holloway, K. S. Schanze, J. R. Reynolds and J. Xue, ACS Nano, 2013, 7, 4846–4854 CrossRef CAS PubMed.
- Y. Zhou, F. S. Riehle, Y. Yuan, H.-F. Schleiermacher, M. Niggemann, G. A. Urban and M. Krueger, Appl. Phys. Lett., 2010, 96, 13304 CrossRef PubMed.
- Y. Liu, M. Gibbs, J. Puthussery, S. Gaik, R. Ihly, H. W. Hillhouse and M. Law, Nano Lett., 2010, 10, 1960–1969 CrossRef CAS PubMed.
- W. U. Huynh, J. J. Dittmer and A. P. Alivisatos, Science, 2002, 295, 2425–2427 CrossRef CAS PubMed.
- J. C. Hindson, Z. Saghi, J.-C. Hernandez-Garrido, P. A. Midgley and N. C. Greenham, Nano Lett., 2011, 11, 904–909 CrossRef CAS PubMed.
- Y. Zhou, M. Eck, C. Men, F. Rauscher, P. Niyamakom, S. Yilmaz, I. Dumsch, S. Allard, U. Scherf and M. Krueger, Sol. Energy Mater. Sol. Cells, 2011, 95, 3227–3232 CrossRef CAS PubMed.
- Y. Zhou, M. Eck, C. Veit, B. Zimmermann, F. Rauscher, P. Niyamakom, S. Yilmaz, I. Dumsch, S. Allard, U. Scherf and M. Krueger, Sol. Energy Mater. Sol. Cells, 2011, 95, 1232–1237 CrossRef CAS PubMed.
- A. A. R. Watt, D. Blake, J. H. Warner, E. A. Thomsen, E. L. Tavenner, H. Rubinsztein-Dunlop and P. Meredith, J. Phys. D: Appl. Phys., 2005, 38, 2006–2012 CrossRef CAS.
- J. Y. Kim, S. H. Kim, H.-H. Lee, K. Lee, W. Ma, X. Gong and A. J. Heeger, Adv. Mater., 2006, 18, 572–576 CrossRef CAS.
- Y. Zhu, Z. Sun, Z. Yan, Z. Jin and J. M. Tour, ACS Nano, 2011, 5, 6472–6479 CrossRef CAS PubMed.
- H. Park, P. R. Brown, V. Bulović and J. Kong, Nano Lett., 2012, 12, 133–140 CrossRef CAS PubMed.
- H. Park, R. M. Howden, M. C. Barr, V. Bulović, K. Gleason and J. Kong, ACS Nano, 2012, 6, 6370–6377 CrossRef CAS PubMed.
- C.-L. Hsu, C.-T. Lin, J.-H. Huang, C.-W. Chu, K.-H. Wei and L.-J. Li, ACS Nano, 2012, 6, 5031–5039 CrossRef CAS PubMed.
- Z. Liu, J. Li and F. Yan, Adv. Mater., 2013, 25, 4296–4301 CrossRef CAS PubMed.
- V. Gupta, N. Chaudhary, R. Srivastava, G. D. Sharma, R. Bhardwaj and S. Chand, J. Am. Chem. Soc., 2011, 133, 9960–9963 CrossRef CAS PubMed.
- D. Yu, K. Park, M. Durstock and L. Dai, J. Phys. Chem. Lett., 2011, 2, 1113–1118 CrossRef CAS.
- J. K. Kim, M. J. Park, S. J. Kim, D. H. Wang, S. P. Cho, S. Bae, J. H. Park and B. H. Hong, ACS Nano, 2013, 7, 7207–7212 CrossRef CAS PubMed.
- S. Qu, M. Li, L. Xie, X. Huang, J. Yang, N. Wang and S. Yang, ACS Nano, 2013, 7, 4070–4081 CrossRef CAS PubMed.
- C. V. Pham, M. Eck and M. Krueger, Chem. Eng. J., 2013, 231, 146–154 CrossRef CAS PubMed.
- D. A. R. Barkhouse, A. G. Pattantyus-Abraham, L. Levina and E. H. Sargent, ACS Nano, 2008, 2, 2356–2362 CrossRef CAS PubMed.
- S. K. Misra, Multifrequency electron paramagnetic resonance. Theory and applications, Wiley-VCH; John Wiley [distributor], Weinheim, Chichester, 2011 Search PubMed.
- I. V. Lightcap and P. V. Kamat, J. Am. Chem. Soc., 2012, 134, 7109–7116 CrossRef CAS PubMed.
- P. M. Sommeling, H. C. Rieffe, J. A. M. van Roosmalen, A. Schönecker, J. M. Kroon, J. A. Wienke and A. Hinsch, Sol. Energy Mater. Sol. Cells, 2000, 62, 399–410 CrossRef CAS.
- A. Maurano, R. Hamilton, C. G. Shuttle, A. M. Ballantyne, J. Nelson, B. O'Regan, W. Zhang, I. McCulloch, H. Azimi, M. Morana, C. J. Brabec and J. R. Durrant, Adv. Mater., 2010, 22, 4987–4992 CrossRef CAS PubMed.
- M. Neukom, S. Züfle and B. Ruhstaller, Org. Electron., 2012, 13, 2910–2916 CrossRef CAS PubMed.
- G. Juška, Phys. Rev. Lett., 2000, 84, 4946–4949 CrossRef.
- G. Juška, M. Viliūnas, K. Arlauskas, N. Nekrašas, N. Wyrsch and L. Feitknecht, J. Appl. Phys., 2001, 89, 4971 CrossRef PubMed.
- M. Neukom, N. Reinke and B. Ruhstaller, Sol. Energy, 2011, 85, 1250–1256 CrossRef CAS PubMed.
- D. S. Ginger and N. C. Greenham, J. Appl. Phys., 2000, 87, 1361–1368 CrossRef CAS PubMed.
- M. Morana, M. Wegscheider, A. Bonanni, N. Kopidakis, S. Shaheen, M. Scharber, Z. Zhu, D. Waller, R. Gaudiana and C. Brabec, Adv. Funct. Mater., 2008, 18, 1757–1766 CrossRef CAS.
- E. Knapp and B. Ruhstaller, J. Appl. Phys., 2012, 112, 24519 CrossRef PubMed.
- K. Rajeshwar, J. Electrochem. Soc., 1981, 128, 1744 CrossRef CAS PubMed.
- G. A. H. Wetzelaer, M. Kuik, M. Lenes and P. W. M. Blom, Appl. Phys. Lett., 2011, 99, 153506 CrossRef PubMed.
- W. Yoon, J. E. Boercker, M. P. Lumb, D. Placencia, E. E. Foos and J. G. Tischler, Sci. Rep., 2013, 3(2225), 1–7 Search PubMed.
- W. J. Potscavage, S. Yoo and B. Kippelen, Appl. Phys. Lett., 2008, 93, 193308 CrossRef PubMed.
- C. J. Brabec, A. Cravino, D. Meissner, N. S. Sariciftci, T. Fromherz, M. T. Rispens, L. Sanchez and J. C. Hummelen, Adv. Funct. Mater., 2001, 11, 374–380 CrossRef CAS.
- M. Soreni-Harari, N. Yaacobi-Gross, D. Steiner, A. Aharoni, U. Banin, O. Millo and N. Tessler, Nano Lett., 2008, 8, 678–684 CrossRef CAS PubMed.
- M. J. Greaney, S. Das, D. H. Webber, S. E. Bradforth and R. L. Brutchey, ACS Nano, 2012, 4222–4230 CrossRef CAS PubMed.
- S. E. Shaheen, C. J. Brabec, N. S. Sariciftci, F. Padinger, T. Fromherz and J. C. Hummelen, Appl. Phys. Lett., 2001, 78, 841–843 CrossRef CAS PubMed.
- M. T. Rispens, A. Meetsma, R. Rittberger, C. J. Brabec, N. S. Sariciftci and J. C. Hummelen, Chem. Commun., 2003, 2116–2118 RSC.
- H. J. Snaith, N. C. Greenham and R. H. Friend, Adv. Mater., 2004, 16, 1640–1645 CrossRef CAS.
- J. Liu, Y. Shi and Y. Yang, Adv. Funct. Mater., 2001, 11, 420–424 CrossRef CAS.
- Y. Yuan, F.-S. Riehle, H. Gu, R. Thomann, G. Urban and M. Krueger, J. Nanosci. Nanotechnol., 2010, 10, 6041–6045 CrossRef CAS PubMed.
- W. S. Hummers and R. E. Offeman, J. Am. Chem. Soc., 1958, 80, 1339 CrossRef CAS.
- S. W. Tong, N. Mishra, C. L. Su, V. Nalla, W. Wu, W. Ji, J. Zhang, Y. Chan and K. P. Loh, Adv. Funct. Mater., 2014, 24, 1904–1910 CrossRef CAS.
- C. V. Pham, M. Krueger, M. Eck, S. Weber and E. Erdem, Appl. Phys. Lett., 2014, 104, 132102 CrossRef PubMed.
- S. van Mensfoort and R. Coehoorn, Phys. Rev. Lett., 2008, 100, 086802 CrossRef CAS.
- F. Gao, Z. Li, J. Wang, A. Rao, I. A. Howard, A. Abrusci, S. Massip, C. R. McNeill and N. C. Greenham, ACS Nano, 2014, 8, 3213–3221 CrossRef CAS PubMed.
Footnote |
| † Electronic supplementary information (ESI) available. See DOI: 10.1039/c4cp01566e |
| This journal is © the Owner Societies 2014 |