Optimizing porphyrins for dye sensitized solar cells using large-scale ab initio calculations†
Received
25th March 2014
, Accepted 13th June 2014
First published on 16th June 2014
Abstract
In the search for sustainable energy sources, dye sensitized solar cells (DSSCs) represent an attractive solution due to their low cost, relatively high efficiencies, and flexible design. Porphyrin-based dyes are characterized by strong absorption in the visible part of the spectrum and easy customization allowing their electronic properties to be controlled by structural variations. Here we present a computational screening study of more than 5000 porphyrin-based dyes obtained by modifying the porphyrin backbone (metal center and axial ligands), substituting hydrogen by fluorine, and adding different side and anchoring groups. Based on the calculated frontier orbital energies and optical gaps we quantify the energy level alignment with the TiO2 conduction band and different redox mediators. An analysis of the energy level–structure relationship reveals a significant structural diversity among the dyes with the highest level alignment quality, demonstrating the large degree of flexibility in porphyrin dye design. As a specific example of dye optimization, we show that the level alignment of the high efficiency record dye YD2-o-C8 [Yella et al., Science, 2011, 334, 629–634] can be significantly improved by modest structural variations. All the presented data have been stored in a publicly available database.
1 Introduction
As the negative environmental consequences of fossil energy production and use are growing, the search for new efficient technologies enabling harvesting and conversion of solar photons into electrical or chemical energy is becoming increasingly important. Since the emergence of the first efficient system in 1991,1 dye sensitized solar cells (DSSCs)2 have been considered promising and cost-efficient candidates for photovoltaic energy conversion. Compared to conventional solar cell systems, some of the unique properties of DSSCs are their simple fabrication and low material cost, flexibility, both in terms of mechanical properties and architectural design, and high efficiency under low illumination conditions.3
A (standard) DSSC is a photoelectrochemical system which converts photons from the sun into electrical work in a three-step process. First, the photons are absorbed by a molecular dye which is anchored to a semi-conductor nanoparticle (typically TiO2). Next, the excited electrons on the dye are transferred to the conduction band of the semiconductor and extracted to an external circuit. In the last step the electron is transferred from the counter electrode and back to the dye using an electrolyte. For a dye to yield a high efficiency in this type of setup there are three essential requirements which should be fullfilled: (i) the energy of the highest occupied molecular orbital (HOMO) should be smaller than the redox potential of the electrolyte. (ii) The lowest unoccupied molecular orbital (LUMO) should lie above the conduction band edge of the semiconductor. (iii) The absorption spectrum of the dye should have a large overlap with the solar spectrum. In addition to these level alignment criteria, the efficiency of the DSSC depends on a number of other processes including the charge injection from the dye to the semiconductor, the regeneration of the oxidized dye by the electrolyte, losses due to charge transport and recombination etc. In the present study we shall focus on the criteria (i)–(iii).
The high absorption of visible light in combination with the many possibilities of functionalizing porphyrins makes these dyes excellent candidates for use in DSSCs.4–15 In particular, the so-called donor–π–acceptor scheme in which the HOMO of the functionalized porphyrin dye is located on the donor side groups while the LUMO is mostly located on the accepting anchor group has led to DSSCs with very high efficiencies including a record efficiency of 12.3%.16 To improve the efficiency of DSSCs further it is natural to resort to computational methods that allow for fast exploration of the vast space of molecular structures. Thanks to the enormous growth in computer power, high-throughput computational screening is rapidly becoming an essential tool for accelerated materials discovery and has recently been applied in a wide range of areas.17–27
We have previously reported a computational screening study of zinc porphyrin based dyes,28 in which we investigated the effect of changing side and anchor groups. However, modifying the backbone by exchanging zinc as the metal center can alter the electronic structure of the dye significantly.29,30 In addition, replacing hydrogen with fluorine in copper-phthalocyanine has been shown to produce a significant lowering of the frontier orbital energies.31 Furthermore, using a Ti4+metal center in the porphyrin allows for the use of axial ligands. As shown by Pickup et al. for titanium phthalocyanines this can have a large impact on the frontier orbitals.32 Inspired by these results, we have performed extensive electronic structure calculations to systematically explore the effect of fluorination of the zinc porphyrins as well as the effect of changing the metal center of the porphyrin dyes including titanium with the two axial ligands investigated by Pickup et al.32 We explore the systematic trends in frontier orbital energies, optical gaps and level alignment quality essential for the DSSC performance for a total of 5145 different porphyrin based dyes with a high structural diversity. All calculated data are available in the public database Computational Materials Repository at the web address http://cmr.fysik.dtu.dk/.
2 Methods
In this paper we have calculated the frontier orbital energies, lowest optical excitation energies and level alignment quality for porphyrins with different metal centers and functionalized by different side groups and anchor groups. The investigated metal centers are Zn and Ti which are also compared to using the metal-free porphyrin. The use of a Ti4+ metal center leads to the requirement of having an axial anionic ligand bound directly to the metal center in order to obtain a neutral porphyrin molecule. In this study we have chosen to use the simple O2− ligand and the more complicated OCHC6H3OO2− ligand as axial ligands. This leads to the five different porphyrin backbones shown in Fig. 1. In the figure, for all backbones, the R1, R2 and R3 labels denote side group locations and A denotes the anchor group location. A total of seven different side groups (see Fig. 2) and three different anchor groups (see Fig. 3) have been chosen for this study.8,10,16,28 Note that when the fluorinated FZnP backbone is used, the H side group is replaced by the F group consisting of a fluorine atom. Apart from accepting electrons, the anchor groups should also be able to bind to the semi-conductor surface, which is achieved by using anchor groups with carboxylic acid groups. All quantum mechanical calculations are performed using density functional theory (DFT)33 with the Perdew–Burke–Ernzerhof (PBE)34 exchange–correlation functional as implemented in the GPAW code.35 For all standard calculations we have used a basis set of numerical atomic orbitals36 (LCAO mode) with a double-ζ polarized basis set, a grid-spacing of 0.18 Å and a unit cell with a 5.0 Å vacuum added on both sides of the molecule in all directions. All structures have been optimized using the Broyden–Fletcher–Goldfarb–Shanno (BFGS) method as implemented in the Atomic Simulation Environment (ASE)37 until all forces are below 0.05 eV Å−1. After the geometry optimization the locations of the HOMO, EHOMO, and LUMO, ELUMO are calculated as the ionization potential IP and electron affinity EA of the molecule. Thus the the resulting gap, Egap, is given by:| | | Egap = ELUMO − EHOMO = (E[−1] − E[0]) − (E[0] − E[+1]) = IP − EA | (1) |
where E[0] is the ground state total energy and E[−1] and E[+1] is the total energy of the negatively and positively charged ions of the molecule in the ground state geometry, respectively. This definition of Egap avoids the use of Kohn–Sham eigenvalues which are well-known to be inaccurate within PBE. In addition to the fundamental gap, the optical gap, E1, which includes the electron–hole interaction, has been calculated. The calculation of E1 is done by forcing the molecule to the triplet groundstate by fixing the magnetic moment, and thus promoting one of the two electrons in the HOMO to the LUMO. We use the triplet excitation energy rather than the singlet excitation because this is technically simpler to compute. We have previously shown for a number of Zn-porhyrins that the singlet and triplet excitations are within 0.3 eV and that their dependence on the molecular structure is very similar.28 In the same study we furthermore showed that computed EHOMO and E1 values compared well to experimental values.8,28 However, we underline that it is the presented trends rather than the absolute values which are the main focus of this paper. We also stress that the effect of hybridization and image charge screening by the TiO2 surface as well as the effect of the solvent on the HOMO energies have not been included in the calculations.38–41 However, we do not believe that this will have a significant impact on the qualitative trends. In order to identify the optimal electronic spectrum of the dyes relative to the semiconductor conduction band edge, we have previously defined a loss-less level alignment quality of a DSSC:28| |  | (2) |
where
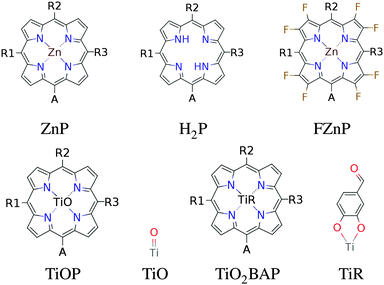 |
| | Fig. 1 The porphyrin backbones investigated in this work. The axial ligands used for TiOP and TiO2BAP are shown next to the backbones. | |
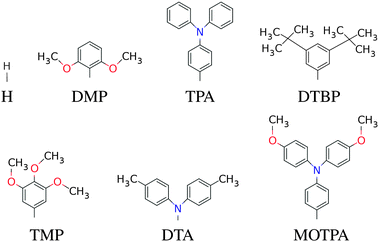 |
| | Fig. 2 The donor groups investigated in this work. Note that when the fluorinated FZnP backbone is used, the H side group is replaced by the F group consisting of a fluorine atom. | |
 |
| | Fig. 3 The accepting anchor groups investigated in this work. | |
Here Ec–EH is the distance from the HOMO level to the conduction band, E1 is the optical gap of the dye, Θ(E − E1) is a step function representing the absorption of the dye molecules, Isolar(E) is the photon flux of the ASTM G-173-03 (AM 1.5 G) solar spectrum, and eVoc is the open-circuit voltage multiplied with the charge of the electron. In the following we assume that Ec = −4.0 eV and Voc = 1.0 V consistent with using TiO2 as the semi-conductor and I−/I3− as the redox mediator. We note that using a single value of Ec for all dyes is an assumption, since different dyes will affect the conduction band via interface–dipole interactions.42 Furthermore, using the Θ(E − E1) step function to represent the dye absorption is based on the assumption that all solar photons with an energy higher than E1 of the dye are absorbed by the dye molecules. We thus assume that all investigated dyes regardless of their size cover the nano-structured TiO2 to effectively form several layers of the dye in the device and that vibrational modes enhance the oscillator strength of any symmetry-forbidden transitions in the dyes.43 The level alignment quality only describes the alignment between the dye and the semi-conductor and is thus only one component in order to obtain a high efficiency in a DSSC. In reality many other critical factors influence the overall efficiency of a DSSC and it should be stressed that we do not claim to include these in the present study.
3 Results and discussion
Histograms of the computed EHOMO and ELUMO as well as the level alignment quality are shown in Fig. 4 and 5, respectively. (The molecules with the largest and smallest EHOMO, ELUMO, Egap and E1 are listed in Table S1 in the ESI.†) The entire data set spans a range of 2.3 eV for EHOMO, 1.3 eV for ELUMO, 2.4 eV for Egap, and 0.8 eV for E1. Furthermore, a great part of the presented dyes are expected to have highly optimal level alignment with respect to the TiO2 conduction band and the I−/I3− redox mediator as can be seen in Fig. 5. Here, thousands of candidates with a high structural diversity exceed the predicted level alignment quality of the record holding YD2-o-C816 dye (η = 0.2). These results demonstrate the large degree of flexibility of the electronic properties of functionalized porphyrins and show that many different design strategies could be followed to control the level alignment. In the following the effects of the different modifications on the frontier orbital energies, lowest optical excitation, and level alignment quality are described in more detail and an overview of the best candidates is provided.
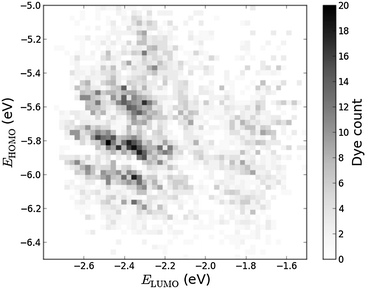 |
| | Fig. 4 2D histogram of obtained pairs of EHOMO and ELUMO for all 5145 investigated dyes. | |
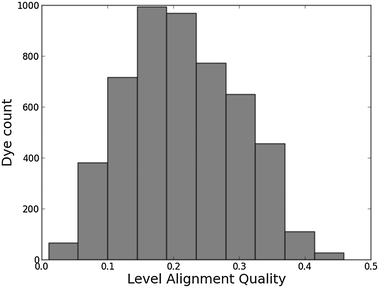 |
| | Fig. 5 Level alignment quality histogram for all 5145 investigated dyes. As a reference, the calculated level alignment quality of the record holding YD2-o-C816 dye is 0.2. | |
3.1 Porphyrin backbones
The effect of exchanging the central metal atom can be investigated by comparing porphyrin dyes with the ZnP, H2P and TiOP backbones (see Fig. 1). Fig. 6 shows the frontier orbital energies of the three different porphyrin backbones using the EthynPhA anchoring group and varying the side groups. It can be seen that replacing ZnP by TiOP results in a small red shift of both the HOMO and the LUMO. However, it is also clear that the three backbones exhibit the same trends depending on the side groups. In particular, the side groups affect the HOMO levels in a similar way whereas the LUMO is almost not affected (see Table S2 in ESI†). From Fig. S1 in the ESI† it is further observed that varying the anchor group shifts the LUMO without affecting the HOMO. For the ZnP backbone these trends were explained by first order perturbation theory28 and more specifically by the match between EHOMO and ELUMO of the bare backbone with EHOMO of the side groups and ELUMO of the anchor groups, respectively. For comparison, EHOMO and ELUMO of the different bare backbone structures are given in Table 1.‡ From the table it is noted that EHOMO and ELUMO of the bare backbones vary only up to 0.3 eV between ZnP, H2P and TiOP. This suggests that the orbital energy match between the backbone and the side and anchor groups is retained for all three backbones thus explaining the similar trends as shown in Fig. 6.
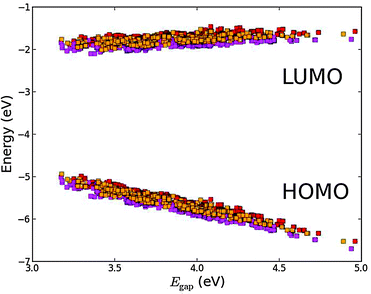 |
| | Fig. 6 Calculated EHOMO and ELUMO relative to vacuum ordered by the resulting Egap of functionalized porphyrins with the EthynPhA anchor group and the ZnP (red), H2P (orange) and TiOP (magenta) backbones. | |
Table 1
E
HOMO and ELUMO for the bare ZnP, H2P, TiOP, TiO2BAP and FZnP backbones
| Backbone |
E
HOMO
|
E
LUMO
|
| ZnP |
−6.71 |
−1.10 |
| H2P |
−6.72 |
−1.20 |
| TiOP |
−6.88 |
−1.37 |
| TiO2BAP |
−6.56 |
−1.80 |
| FZnP |
−7.20 |
−1.85 |
For two specific dyes, Fig. S2 and S3 in the ESI† give a visual impression of the effect on the HOMO wave functions upon changing the metal center. In the figures it can be seen that substituting the Zn core atom for H2 only makes little difference in terms of the spatial distribution of the HOMO as the metal core atoms carry no weight of the molecular orbital. On the other hand, an interesting effect appears when substituting with the TiO center. In this case the O atom, as opposed to the metal centres, does carry part of the HOMO. This may explain the lower EHOMO of the TiOP backbone relative to ZnP and H2P as shown in Table 1, and indicates that the frontier orbitals of the titanium porphyrins may be altered by modifying the axial ligand as will be discussed in greater details later.
Fig. 7 gives a histogram for the level alignment quality of all molecules using either of the three backbones. Clearly, it is possible to obtain very high level alignment qualities for several dyes using any of the three backbones. However, for the three backbones, the best level alignment quality is generally obtained for different side and anchor groups. This is visualized in Fig. S4 in the ESI† where the level alignment quality for all combinations of dyes with the three backbones as a function of the optical gap, E1, and the energy difference between the conduction band of TiO2 and the HOMO level of the dyes, Ec − EH, are visualized. Here, it is observed that for all backbones, in order to yield a high level alignment quality, it is necessary to use highly donating side groups giving a low Ec − EH value. To further optimize the level alignment quality it is necessary to have a low E1 value, which is mainly influenced by the LUMO position. The latter is controlled by the anchor group and it is generally observed that using the 2CarboxyPropenA or 2CyanoPropenA anchor groups yields more dyes with a high level alignment quality. This observation is especially concerned with dyes with the ZnP backbone for which the use of the popular EthynPhA anchor group significantly lowers the number of dyes with a high level alignment quality. Thus, it may be beneficial for these dyes to replace the zinc atom to obtain a better level alignment quality.
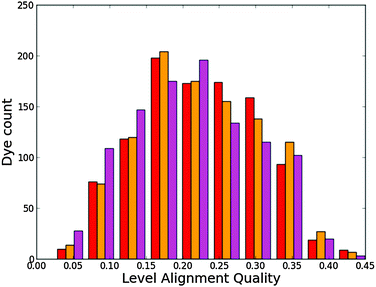 |
| | Fig. 7 Level alignment quality histogram for functionalized porphyrins with the ZnP (red), H2P (orange) and TiOP (magenta) backbones. | |
3.2 Axial ligands
By employing a Ti4+ metal center we introduce the possibility of using axial ligands directly bound to the titanium metal center. As discussed, using a double bonded oxygen to form the TiOP backbone shifts the weight of the HOMO towards the axial ligand. Thus, we now investigate the effect of replacing the oxygen with the O2BA ligand. Fig. 8 shows a plot of the frontier orbital energies of the TiOP and TiO2BAP porphyrin backbones using the EthynPhA anchoring group and varying the side groups (see Fig. S5 in the ESI† for results with all anchor groups). It is observed that the general trends discussed previously are retained and that the fundamental gaps of the dyes with the TiO2BAP backbone are lower due to generally lower ELUMO values. Furthermore, a significant decrease in the range of Egap is observed for TiO2BAP compared to TiOP. This is seen to be due to the lower range of EHOMO values indicating a smaller interaction between the side groups and the backbone. This effect may in turn be explained by looking at the spatial shape of the HOMOs for similar dyes with different backbones shown in Fig. S6 and S7 in the ESI.† Here, it is observed that for the TiO2BAP backbone the HOMO is mostly located at the O2BA axial ligand and thus the interaction between the side groups and the backbone is reduced. Apart from modifying the energy of the frontier orbitals of the dye, the relatively large weight of the HOMO on the axial ligand can further influence the regeneration of the dye, since this involves interaction between the redox mediator and the HOMO.
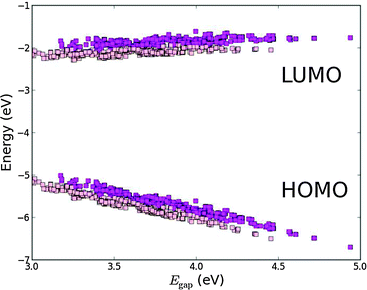 |
| | Fig. 8 Calculated EHOMO and ELUMO relative to vacuum ordered by the resulting Egap of functionalized porphyrins with the EthynPhA anchor group and the TiOP (magenta) and TiO2BAP (pink) backbones. | |
Fig. 9 shows a histogram of the level alignment quality using either of the two backbones. It can be seen that the TiOP backbone yields slightly more candidates with high level alignment quality, but in general it is possible to obtain a high level alignment quality using either of the axial ligands introducing more flexibility in designing dyes. The optimal choice of side and anchor groups needed to obtain a high level alignment quality is very similar for the two backbones. This is visualized in Fig. S8 in the ESI,† which shows the calculated level alignment quality for all dye combinations with the two backbones as a function of E1 and Ec − EH. For both backbones the highest level alignment quality values are found for dyes with highly donating side groups in combination with either 2CarboxyPropenA or 2CyanoPropenA anchor groups. The main difference between the two backbones concerning the level alignment quality is found when using the EthynPhA anchor group. Here, using the TiO2BAP backbone yields a greater number of dyes with a high level alignment quality.
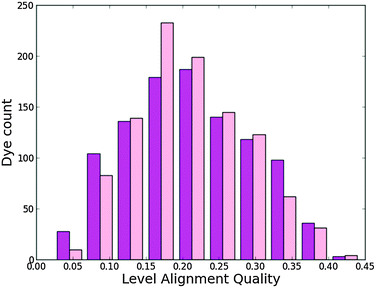 |
| | Fig. 9 Level alignment quality histogram for functionalized porphyrins with the TiOP (magenta) and TiO2BAP (pink) backbones. | |
3.3 Substitution of hydrogen with fluorine
A third method for tweaking the electronic structure of the porphyrin dyes is to replace the hydrogen atoms in the porphyrin backbone with fluorine atoms. Here, the electron transfer from the backbone to the fluorine atoms is expected to generate an electrostatic potential that shifts down the energy of the orbitals localized on the backbone.31,44 This effect is shown in Fig. 10 which shows the frontier orbital energies of the ZnP and FZnP porphyrin backbones using the EthynPhA anchor group and varying the side groups (see Fig. S9 in the ESI† for results with all anchor groups). Apart from exhibiting the same trends as discussed for all other backbones, the fluorinated dyes have significantly lower ELUMO values. As the LUMO is mostly localized on the backbone (and the anchor group) this decrease can be ascribed to the electrostatic potential generated by the fluorine atoms. For the EHOMO values the picture is more complicated as only dyes with a large fundamental gap have HOMOs which are localized on the backbone whereas dyes with more donating side groups have HOMOs which are localized more on the side groups.28 Thus, it can be expected that the EHOMO values for fluorinated dyes with large Egap will be more affected than those with a small Egap. This is indeed shown in Fig. 10. From Fig. S10 and S11 in the ESI,† which show the HOMO and LUMO wave functions for both fluorinated and non-fluorinated dyes, it is observed that the change in shape of the orbitals upon fluorination is negligible and thus the altered electrostatic potential must be the main effect of the fluorination.
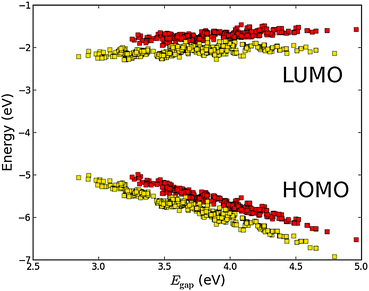 |
| | Fig. 10 Calculated EHOMO and ELUMO relative to vacuum ordered by the resulting Egap of functionalized porphyrins with the EthynPhA anchor group and the ZnP (red) and FZnP (yellow) backbones. | |
Fig. 11 shows a histogram for the level alignment quality of all dyes with either hydrogen or fluorine in the porphyrin backbone. From the figure it is clear that the FZnP backbone yields slightly more candidates with high level alignment quality, but also dramatically increases the number of candidates with very low level alignment quality. Fluorination thus have a significant impact on specific dyes and the resulting level alignment quality. This can be further understood from Fig. S12 in the ESI† in which the level alignment quality is given as a function of E1 and Ec − EH. Here, highly donating side groups as discussed for all backbones lead to the highest level alignment quality. However, in contrast to dyes with the ZnP backbone, the number of dyes with a high level alignment quality employing the FZnP backbones is similar for all anchor groups leading to more structural flexibility.
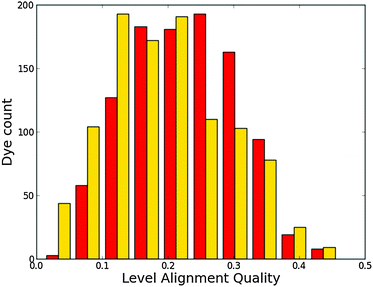 |
| | Fig. 11 Level alignment quality histogram for functionalized porphyrins with the ZnP (red) and FZnP (yellow) backbones. | |
3.4 Optimizing level alignment
Fig. 12 (top) shows the calculated level alignment quality for all 5145 dye candidates presented in this study as a function of E1 and the energy difference between the conduction band of TiO2 and the HOMO level of the dyes, Ec − EH. The black dotted line indicates where EHOMO = −5.50 eV which corresponds to the upper limit of EHOMO for dyes used in a DSSC with the I−/I3− redox pair. This strict limit stems from the need to have a 0.6 V potential difference between EHOMO and the redox potential of the I−/I3− redox pair in order to drive the charge transfer.2,45–47 The white dotted line indicates where Ec − EH = E1. Above this line, photoexcited electrons on the dye could in principle be trapped below the conduction band if the thermal relaxation in the molecule is fast compared to the charge injection time.
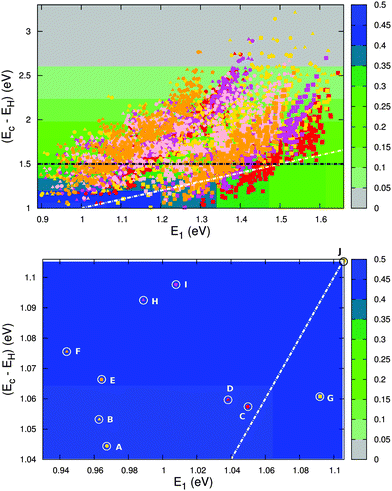 |
| | Fig. 12 Top: calculated level alignment quality as a function of the optical gap, E1, and the energy difference between the conduction band of TiO2 and the HOMO level of the dyes, Ec − EH, for candidates with the ZnP (red), H2P (orange), TiOP (magenta), TiO2BAP (pink) and FZnP (yellow) backbones and the EthynPhA (square), 2CarboxyPropenA (circle) and 2CyanoPropenA (triangle) anchor groups. The black dotted line indicates the lower limit of Ec − EH for dyes to be used with the I−/I3− electrolyte and the white dotted line indicates where Ec − EH = E1. Bottom: zoom of the above figure onto the region with the highest level alignment quality. The letters identify the top ten candidates and correspond to the letters given in Table 2. | |
The bottom part of Fig. 12 shows a zoom of the region with the highest level alignment quality and identifies the ten dyes with the highest η values. The structure of these candidates can be found in Table 2. The common feature of the top ten candidates is that they have an E1 value of around 1.0 eV and an EHOMO value of around −5.1 eV (corresponding to an Ec − EH value of around 1.1 eV). For similar values of E1 and Ec − EH all the photoexcited electrons on the dye contribute to the photocurrent. The optimal value of 1.1 eV is in agreement with the optimal value predicted for semi-conductor solar cells by Shockley and Queisser.49 Out of the top ten candidates only two contain the common ZnP backbone. Thus, by changing the backbone we have found eight new candidates for the top ten relative to our recent screening of zinc porphyrins.28 However, none of the top ten candidates have EHOMO values below −5.50 eV, which is the requirement for using the I−/I3− redox pair. Thus, a different redox mediator must be used for these dyes. Fig. S13 in the ESI† shows the TD-DFT predicted UV-VIS spectra of the top five dyes. These results verify that with a sufficient amount of dye layers present in the device due to the meso-porous TiO2 nano-particles, all dyes will have a step-function absorption spectrum above the absorption edge since the absorption here is non-zero for all dyes. The absorption edge is however poorly predicted by TD-DFT due to the charge-transfer character of donor–π–acceptor porphyrin dyes.
Table 2 Top ten candidates measured by the level alignment quality under the assumption that Ec = −4.0 eV and Voc = 1.0 V. The letters correspond to the letters in the bottom part of Fig. 12
| Dye |
Backbone |
A |
R1 |
R2 |
R3 |
E
HOMO (eV) |
E
1 (eV) |
η
|
| A |
FZnP |
2CarboxyPropenA |
MOTPA |
MOTPA |
MOTPA |
−5.04 |
0.97 |
0.46 |
| B |
FZnP |
2CyanoPropenA |
MOTPA |
MOTPA |
MOTPA |
−5.05 |
0.96 |
0.45 |
| C |
ZnP |
2CarboxyPropenA |
MOTPA |
MOTPA |
MOTPA |
−5.06 |
1.05 |
0.45 |
| D |
ZnP |
2CyanoPropenA |
MOTPA |
MOTPA |
MOTPA |
−5.06 |
1.04 |
0.45 |
| E |
H2P |
2CarboxyPropenA |
MOTPA |
MOTPA |
MOTPA |
−5.07 |
0.96 |
0.45 |
| F |
H2P |
2CyanoPropenA |
MOTPA |
MOTPA |
MOTPA |
−5.08 |
0.94 |
0.45 |
| G |
FZnP |
EthynPhA |
DTA |
MOTPA |
MOTPA |
−5.06 |
1.09 |
0.44 |
| H |
TiOP |
2CyanoPropenA |
MOTPA |
MOTPA |
MOTPA |
−5.09 |
0.99 |
0.44 |
| I |
TiOP |
2CarboxyPropenA |
MOTPA |
MOTPA |
MOTPA |
−5.10 |
1.01 |
0.44 |
| J |
FZnP |
EthynPhA |
MOTPA |
DTA |
MOTPA |
−5.11 |
1.11 |
0.44 |
Using our computational database it is possible to optimize the level alignment quality of a given dye by varying one or more structural parameters (side groups, anchor groups and backbones). In Table 3 we have optimized the level alignment quality of the high efficiency record holding YD2-o-C8 dye16 by varying 1 or 2 structural parameters under the constraint EHOMO ≤ −5.50 eV corresponding to the requirement imposed by the I−/I3− redox pair and the constraint EHOMO ≤ −5.36 eV corresponding to the requirement imposed by the [CoII/III(bpy-pz)2] redox pair,48 respectively. From the table it can be seen that changing the side groups has the largest impact on the level alignment quality for this particular dye. In fact, by substituting a single side group, the level alignment quality is expected to increase significantly. Since the structural change is negligible this could lead to a higher efficiency of an actual DSSC.
Table 3 Using the YD2-o-C816 dye as a starting point the level alignment quality is optimized by varying 1 or 2 structural parameters
| No. of optimized parameters |
Backbone |
A |
R1 |
R2 |
R3 |
E
HOMO (eV) |
E
1 (eV) |
η
|
|
The optimization is performed under the constraint that EHOMO ≤ −5.50 eV corresponding to the requirement of using the I−/I3− redox pair.2,45–47
The optimization is performed under the constraint that EHOMO ≤ −5.36 eV corresponding to the requirement of using the [CoII/III(bpy-pz)2] redox pair.48
|
| 0 parameters |
ZnP |
EthynPhA |
DMP |
DTA |
DMP |
−5.77 |
1.48 |
0.20 |
| 1 parametera |
ZnP |
EthynPhA |
DMP |
DTA |
TPA |
−5.54 |
1.40 |
0.27 |
| 1 parameterb |
ZnP |
EthynPhA |
MOTPA |
DTA |
DMP |
−5.40 |
1.40 |
0.33 |
| 2 parametersa |
ZnP |
EthynPhA |
DMP |
DMP |
MOTPA |
−5.51 |
1.46 |
0.29 |
| 2 parametersb |
ZnP |
EthynPhA |
TPA |
DTA |
TPA |
−5.36 |
1.34 |
0.34 |
4 Conclusions
We have presented a computational screening study of 5145 functionalized porphyrin dyes composed of a set of five different backbones, seven different donating side groups and three different accepting anchor groups. Replacing the commonly used zinc metal center with H2 was found to alter the electronic structure of the dyes only slightly. On the other hand, introducing the Ti4+ metal center enables the use of axial ligands. For dyes containing only weakly donating side groups, these ligands can have a large influence on both the frontier energy levels and the shape of the HOMO. The latter effect could be important for the dye regeneration process. Both of the investigated axial ligands produced many dyes with a high level alignment quality and thus the use of a Ti4+ center with axial ligands introduces more flexibility in the design of porphyrin based dyes. By fluorinating the standard zinc porphyrin based dyes we found a dramatic impact on the LUMO energy and, for dyes without very donating side groups, also on the HOMO energy. This suggests fluorination as an effective method to control the electronic structure of the porphyrins. For all types of structural modifications we generally found a large number of dye candidates with a high level alignment quality, exceeding those of well known high efficiency dyes. These results suggest that there is plenty of room for improving dye sensitized solar cells by optimization of the porphyrin dyes. Despite the observed qualitative trends, we do not observe any simple additive quantitative relation between the structure and energy levels. We are currently investigating whether this relation between orbital energies and structural changes can be predicted using a model based on perturbation theory. In parallel with this we also plan to include the alignment with the redox mediator in the definition of the level alignment quality in a future study.
Acknowledgements
The authors would like to thank A. Rubio and F. J. Himpsel for inspiring discussions and J. J. Mortensen for help with setting up an efficient database. KBØ and KST would further like to thank the Danish Council for Independent Research's DFF-Sapere Aude program (grant no. 11-1051390) for financial support. JMGL acknowledges support from the Spanish Ministry of Economy and Competitiveness under Projects FIS2009-07083, FIS2010-21282-C02-01 and FIS2012-30996 and through Ramon y Cajal grant RYC-2011-07782.
References
- B. O'Regan and M. Grätzel, Nature, 1991, 353, 737–740 CrossRef.
- A. Hagfeldt, G. Boschloo, L. Sun, L. Kloo and H. Pettersson, Chem. Rev., 2010, 110, 6595–6663 CrossRef CAS PubMed.
- H. S. Jung and J.-K. Lee, J. Phys. Chem. Lett., 2013, 4, 1682–1693 CrossRef CAS.
- L.-L. Li and E. W.-G. Diau, Chem. Soc. Rev., 2013, 42, 291–304 RSC.
- W. M. Campbell, A. K. Burrell, D. L. Officer and K. W. Jolley, Coord. Chem. Rev., 2004, 248, 1363–1379 CrossRef CAS.
- T. Bessho, S. M. Zakeeruddin, C.-Y. Yeh, E. W.-G. Diau and M. Grätzel, Angew. Chem., Int. Ed., 2010, 49, 6646–6649 CrossRef CAS PubMed.
- G. F. Moore, S. J. Konezny, H. Song, R. L. Milot, J. D. Blakemore, M. L. Lee, V. S. Batista, C. A. Schmuttenmaer, R. H. Crabtree and G. W. Brudvig, J. Phys. Chem. C, 2012, 116, 4892–4902 CAS.
- B. Liu, W. Zhu, Y. Wang, W. Wu, X. Li, B. Chen, Y.-T. Long and Y. Xie, J. Mater. Chem., 2012, 22, 7434–7444 RSC.
- S. Rangan, S. Coh, R. A. Bartynski, K. P. Chitre, E. Galoppini, C. Jaye and D. Fischer, J. Phys. Chem. C, 2012, 116, 23921–23930 CAS.
- M.-J. Lee, M. P. Balanay and D. H. Kim, Theor. Chem. Acc., 2012, 131, 1–12 CAS.
- N. Masi Reddy, T.-Y. Pan, Y. Christu Rajan, B.-C. Guo, C.-M. Lan, E. Wei-Guang Diau and C.-Y. Yeh, Phys. Chem. Chem. Phys., 2013, 15, 8409–8415 RSC.
- N. Santhanamoorthi, C.-M. Lo and J.-C. Jiang, J. Phys. Chem. Lett., 2013, 4, 524–530 CrossRef CAS.
- J. Luo, M. Xu, R. Li, K.-W. Huang, C. Jiang, Q. Qi, W. Zeng, J. Zhang, C. Chi, P. Wang and J. Wu, J. Am. Chem. Soc., 2013, 136, 265–272 CrossRef PubMed.
- H. He, A. Gurung, L. Si and A. G. Sykes, Chem. Commun., 2012, 48, 7619–7621 RSC.
- Y. Liu, H. Lin, J. Li, J. T. Dy, K. Tamaki, J. Nakazaki, D. Nakayama, C. Nishiyama, S. Uchida, T. Kubo and H. Segawa, Phys. Chem. Chem. Phys., 2012, 14, 16703–16712 RSC.
- A. Yella, H.-W. Lee, H. N. Tsao, C. Yi, A. K. Chandiran, M. K. Nazeeruddin, E. W.-G. Diau, C.-Y. Yeh, S. M. Zakeeruddin and M. Grätzel, Science, 2011, 334, 629–634 CrossRef CAS PubMed.
- G. H. Johannesson, T. Bligaard, A. V. Ruban, H. L. Skriver, K. W. Jacobsen and J. K. Nørskov, Phys. Rev. Lett., 2002, 88, 255506 CrossRef CAS.
- A. Franceschetti and A. Zunger, Nature, 1999, 402, 60–63 CrossRef CAS PubMed.
- G. Ceder, Y.-M. Chiang, D. R. Sadoway, M. K. Aydinol, Y.-I. Jang and B. Huang, Nature, 1998, 392, 694–696 CrossRef CAS PubMed.
- W. Setyawan, R. M. Gaume, S. Lam, R. S. Feigelson and S. Curtarolo, ACS Comb. Sci., 2011, 13, 382–390 CrossRef CAS PubMed.
- J. Hachmann, R. Olivares-Amaya, S. Atahan-Evrenk, C. Amador-Bedolla, R. S. Snchez-Carrera, A. Gold-Parker, L. Vogt, A. M. Brockway and A. Aspuru-Guzik, J. Phys. Chem. Lett., 2011, 2, 2241–2251 CrossRef CAS.
- R. Olivares-Amaya, C. Amador-Bedolla, J. Hachmann, S. Atahan-Evrenk, R. S. Sanchez-Carrera, L. Vogt and A. Aspuru-Guzik, Energy Environ. Sci., 2011, 4, 4849–4861 CAS.
- N. M. O'Boyle, C. M. Campbell and G. R. Hutchison, J. Phys. Chem. C, 2011, 115, 16200–16210 Search PubMed.
- I. Y. Kanal, S. G. Owens, J. S. Bechtel and G. R. Hutchison, J. Phys. Chem. Lett., 2013, 4, 1613–1623 CrossRef CAS.
- J. Hachmann, R. Olivares-Amaya, A. Jinich, A. L. Appleton, M. A. Blood-Forsythe, L. R. Seress, C. Roman-Salgado, K. Trepte, S. Atahan-Evrenk, S. Er, S. Shrestha, R. Mondal, A. Sokolov, Z. Bao and A. Aspuru-Guzik, Energy Environ. Sci., 2014, 7, 698–704 CAS.
- I. E. Castelli, T. Olsen, S. Datta, D. D. Landis, S. Dahl, K. S. Thygesen and K. W. Jacobsen, Energy Environ. Sci., 2012, 5, 5814–5819 CAS.
- I. E. Castelli, D. D. Landis, K. S. Thygesen, S. Dahl, I. Chorkendorff, T. F. Jaramillo and K. W. Jacobsen, Energy Environ. Sci., 2012, 5, 9034–9043 CAS.
- K. B. Ørnsø, J. M. Garcia-Lastra and K. S. Thygesen, Phys. Chem. Chem. Phys., 2013, 15, 19478–19486 RSC.
- P. L. Cook, W. Yang, X. Liu, J. M. Garcia-Lastra, A. Rubio and F. J. Himpsel, J. Chem. Phys., 2011, 134, 204707 CrossRef.
- J. M. Garcia-Lastra, P. L. Cook, F. J. Himpsel and A. Rubio, J. Chem. Phys., 2010, 133, 151103 CrossRef CAS.
- D. G. de Oteyza, A. El-Sayed, J. M. Garcia-Lastra, E. Goiri, T. N. Krauss, A. Turak, E. Barrena, H. Dosch, J. Zegenhagen, A. Rubio, Y. Wakayama and J. E. Ortega, J. Chem. Phys., 2010, 133, 214703 CrossRef CAS PubMed.
- D. F. Pickup, I. Zegkinoglou, B. Ballesteros, C. R. Ganivet, J. M. Garca-Lastra, P. L. Cook, P. S. Johnson, C. Rogero, F. de Groot, A. Rubio, G. de la Torre, J. E. Ortega and F. J. Himpsel, J. Phys. Chem. C, 2013, 117, 4410–4420 CAS.
- W. Kohn and L. J. Sham, Phys. Rev., 1965, 140, A1133–A1138 CrossRef.
- J. P. Perdew, K. Burke and M. Ernzerhof, Phys. Rev. Lett., 1996, 77, 3865–3868 CrossRef CAS.
- J. Enkovaara, C. Rostgaard, J. J. Mortensen, J. Chen, M. Dulak, L. Ferrighi, J. Gavnholt, C. Glinsvad, V. Haikola, H. A. Hansen, H. H. Kristoffersen, M. Kuisma, A. H. Larsen, L. Lehtovaara, M. Ljungberg, O. Lopez-Acevedo, P. G. Moses, J. Ojanen, T. Olsen, V. Petzold, N. A. Romero, J. Stausholm-Møller, M. Strange, G. A. Tritsaris, M. Vanin, M. Walter, B. Hammer, H. Häkkinen, G. K. H. Madsen, R. M. Nieminen, J. K. Nørskov, M. Puska, T. T. Rantala, J. Schiøtz, K. S. Thygesen and K. W. Jacobsen, J. Phys.: Condens. Matter, 2010, 22, 253202 CrossRef CAS PubMed.
- A. H. Larsen, M. Vanin, J. J. Mortensen, K. S. Thygesen and K. W. Jacobsen, Phys. Rev. B: Condens. Matter Mater. Phys., 2009, 80, 195112 CrossRef.
- S. Bahn and K. W. Jacobsen, Comput. Sci. Eng., 2002, 4, 56–66 CrossRef CAS.
- C. E. Patrick and F. Giustino, Phys. Rev. Lett., 2012, 109, 116801 CrossRef.
- J. M. Garcia-Lastra, C. Rostgaard, A. Rubio and K. S. Thygesen, Phys. Rev. B: Condens. Matter Mater. Phys., 2009, 80, 245427 CrossRef.
- A. Allegrucci, N. A. Lewcenko, A. J. Mozer, L. Dennany, P. Wagner, D. L. Officer, K. Sunahara, S. Mori and L. Spiccia, Energy Environ. Sci., 2009, 2, 1069–1073 CAS.
- N. Martsinovich and A. Troisi, Phys. Chem. Chem. Phys., 2012, 14, 13392–13401 RSC.
- E. Ronca, M. Pastore, L. Belpassi, F. Tarantelli and F. De Angelis, Energy Environ. Sci., 2013, 6, 183–193 CAS.
- M. Gouterman, J. Mol. Spectrosc., 1961, 6, 138–163 CrossRef CAS.
- M.-S. Liao and S. Scheiner, J. Chem. Phys., 2002, 117, 205–219 CrossRef CAS PubMed.
- C. Bauer, G. Boschloo, E. Mukhtar and A. Hagfeldt, J. Phys. Chem. B, 2002, 106, 12693–12704 CrossRef CAS.
- J. N. Clifford, E. Palomares, M. K. Nazeeruddin, M. Grätzel and J. R. Durrant, J. Phys. Chem. C, 2007, 111, 6561–6567 CAS.
- D. Kuciauskas, M. S. Freund, H. B. Gray, J. R. Winkler and N. S. Lewis, J. Phys. Chem. B, 2000, 105, 392–403 CrossRef.
- J.-H. Yum, E. Baranoff, F. Kessler, T. Moehl, S. Ahmad, T. Bessho, A. Marchioro, E. Ghadiri, J.-E. Moser, C. Yi, M. K. Nazeeruddin and M. Grätzel, Nat. Commun., 2012, 3, 631 CrossRef PubMed.
- W. Shockley and H. J. Queisser, J. Appl. Phys., 1961, 32, 510–519 CrossRef CAS PubMed.
Footnotes |
| † Electronic supplementary information (ESI) available: Detailed figures showing the calculated level alignment quality, orbital visualizations, figures giving the trends in frontier orbital energies of all anchor groups and details of dyes with the highest/lowest values of the different properties investigated. See DOI: 10.1039/c4cp01289e |
| ‡ Note that EHOMO and ELUMO of ZnP differ slightly from the previously published values as those values were calculated using a different basis set. |
|
| This journal is © the Owner Societies 2014 |
Click here to see how this site uses Cookies. View our privacy policy here.  Open Access Article


