 Open Access Article
Creative Commons Attribution 3.0 Unported Licence
Thermochemical CO2 splitting via redox cycling of ceria reticulated foam structures with dual-scale porosities
Philipp
Furler
a,
Jonathan
Scheffe
a,
Daniel
Marxer
a,
Michal
Gorbar
b,
Alexander
Bonk
bc,
Ulrich
Vogt
bc and
Aldo
Steinfeld
*ad
aDepartment of Mechanical and Process Engineering, ETH Zurich, 8092 Zurich, Switzerland. E-mail: aldo.steinfeld@ethz.ch
bLaboratory for Hydrogen and Energy, Empa, 8600 Dübendorf, Switzerland
cInstitute for Geo- and Life Sciences, Crystallography, Albert-Ludwigs-Universität Freiburg, 79085 Freiburg, Germany
dSolar Technology Laboratory, Paul Scherrer Institute, 5232 Villigen PSI, Switzerland
First published on 8th April 2014
Abstract
Efficient heat transfer of concentrated solar energy and rapid chemical kinetics are desired characteristics of solar thermochemical redox cycles for splitting CO2. We have fabricated reticulated porous ceramic (foam-type) structures made of ceria with dual-scale porosity in the millimeter and micrometer ranges. The larger void size range, with dmean = 2.5 mm and porosity = 0.76–0.82, enables volumetric absorption of concentrated solar radiation for efficient heat transfer to the reaction site during endothermic reduction, while the smaller void size range within the struts, with dmean = 10 μm and strut porosity = 0–0.44, increases the specific surface area for enhanced reaction kinetics during exothermic oxidation with CO2. Characterization is performed via mercury intrusion porosimetry, scanning electron microscopy, and thermogravimetric analysis (TGA). Samples are thermally reduced at 1773 K and subsequently oxidized with CO2 at temperatures in the range 873–1273 K. On average, CO production rates are ten times higher for samples with 0.44 strut porosity than for samples with non-porous struts. The oxidation rate scales with specific surface area and the apparent activation energy ranges from 90 to 135.7 kJ mol−1. Twenty consecutive redox cycles exhibited stable CO production yield per cycle. Testing of the dual-scale RPC in a solar cavity-receiver exposed to high-flux thermal radiation (3.8 kW radiative power at 3015 suns) corroborated the superior performance observed in the TGA, yielding a shorter cycle time and a mean solar-to-fuel energy conversion efficiency of 1.72%.
1. Introduction
Solar thermochemical cycles based on two-step metal oxide redox reactions offer promising paths for solar-driven production of H2 and CO from H2O and CO2.1–3 The resulting syngas mixture can be further converted to liquid hydrocarbon fuels via Fischer–Tropsch or other catalytic processes.4 Among a variety of metal oxides used as intermediates for such two-step redox cycles, nonstoichiometric ceria (CeO2−δ) emerges as an attractive candidate because of its ability to rapidly conduct oxygen through its lattice,5 and of its crystallographic stability over a wide range of oxidation states.6,7 The cycle can be represented by: | (1) |
 | (2a) |
 | (2b) |
The solar-to-fuel energy conversion efficiency of such a H2O/CO2-splitting thermochemical cycle, defined as the ratio of the heating value of the fuel produced to the solar energy input, depends highly on the thermodynamics (δ under given p and T, for example), the reaction kinetics, and the transfer of concentrated solar energy to the reaction site. The first reduction step is usually performed with solar reactors containing porous structures of the redox material that are directly exposed to the high-flux solar irradiation.13–18 Thus, low optical thickness is desired to enable volumetric radiative absorption and uniform heating of the porous structure. On the other hand, the second oxidation step with H2O or CO2 has been shown to be largely surface dependent, and as such large specific surface area (SSA) is desired to enhance reaction kinetics.19,20 However, the porous structure supporting the redox material generally features only one of the two desired properties: either high SSA18–21 or low optical thicknesses,13,22–26 as the former comes at the expense of high radiative opacity while the latter comes at the expense of lower SSA.
Porous structures with void sizes in the μm-range, e.g. felts,21 exhibit high SSA that are favorable for the oxidation step. They also exhibit high opacity for incident thermal radiation and therefore absorb it mainly on their exposed surface, resulting in steep temperature gradients across the structure thickness because of the inherently poor thermal conductivity. Thus, the regions directly below the exposed surface reach temperatures sufficiently high for the reduction step to proceed at reasonable rates, whereas the deeper regions reach lower temperatures where reaction rates are diminishingly low. In contrast, porous structures with void sizes in the mm-range, e.g. reticulated foams22–26 or honeycombs,13 can absorb incident thermal radiation more homogeneously. Because of their relatively low optical thicknesses, radiation can penetrate and be absorbed volumetrically, which in turn leads to more uniform temperature profiles across the structure thickness. However, because of their low SSA, the reaction rates of the oxidation step are slower compared to those obtained with the aforementioned μm-range porous materials.22
In light of the apparent tradeoffs between rapid reaction kinetics and efficient radiation heat transfer, we have engineered ceria reticulated porous ceramic (RPC) structures which are capable of combining both of the desired properties, namely; low optical thickness for volumetric radiative absorption during reduction, and high SSA for rapid reaction rates during oxidation. In the present study we report on the synthesis, characterization, and experimental assessment of such ceria RPC structures. Void sizes on two scales – dual-scale porosity – have been incorporated within the structure: one in the mm-range to achieve relatively low optical thickness for volumetric absorption of concentrated solar radiation, and a second smaller void size within the struts in the μm-range to increase SSA for fast oxidation rates with H2O and CO2. As it will be shown in the analysis that follows, these dual-scale porosity RPC structures are morphologically stable when cycling at reduction temperatures of 1773 K and are capable of increasing oxidation rates by roughly 10 times compared to analogous RPC structures without the implementation of μm-size porosity in the struts.
2. Results and discussion
Characterization of structures
Fig. 1 shows a photograph of a representative RPC ceria sample produced with 50 vol% pore-forming agent (RPC-50), alongside a SEM micrograph (inset) of one of its struts. The RPC structure is composed of a network of large voids with a mean diameter dmean = 2.5 mm that are bounded by struts and, within the struts, a sub-network of small voids with dmean = 10 μm. Visually, there is no observable difference between this RPC and those produced without pore forming agents, i.e. without μm-range porosity in the struts. Samples ranging from 0 to 50 vol% pore-forming agents have been produced and are denoted by RPC-0…50. Their porosity and surface area are listed in Table 1. Evidently, increasing the amount of pore-forming agent into the struts leads to a more porous structure and higher SSA. The total sample porosity, εsample, defined as the fraction of all void spaces divided by the overall volume of the sample, remained relatively constant in the range 0.8–0.82. In contrast, the effective strut porosity, εstrut, defined as the volume of the open μm-voids of a control volume inside a strut divided by the control volume, increased significantly from 0.03 to 0.44 when the amount of pore-forming agent introduced increased from 10 to 50 vol%. As it will be verified by SEM, RPC-10, and RPC-20 are comprised of closed pores in the struts, while higher amounts of pore-forming agent result in an interconnected pore network. Thus, those with 30 vol% pore-forming agent and greater have considerably higher εstrut and SSA. For example, for RPC-30 εstrut = 0.18 and SSA = 0.066 m2 g−1, values which are roughly four times larger than those corresponding to RPC-20. The marginal increase in εsample with an increasing amount of pore-forming agent is due to the larger strut thickness as a result of the slurry viscosity increasing with a higher amount of carbon particles added. For all samples, εstrut was lower than the pre-fired volume fraction of carbon particles added because of closed pores and shrinkage of the RPC structure during the sintering process.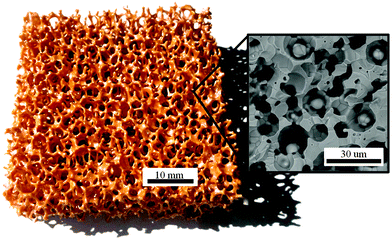 | ||
| Fig. 1 Photograph of an RPC ceria sample with dual-scale porosity produced with 50 vol% of pore-forming agent. Inset: SEM micrograph of a break plane of its struts. | ||
| Name | Pore-forming agent (vol%) | ε sample | ε strut | SSAb (m2 g−1) |
|---|---|---|---|---|
| a Determined by measurement of sample mass and volume. b Determined by mercury porosimetry. c Determined based on tomographic scans.22 | ||||
| RPC-0 | 0 | 0.80 ± 0.03 | Below detectable range | 0.000145c |
| RPC-10 | 10 | 0.79 ± 0.03 | 0.03 | 0.0097 |
| RPC-20 | 20 | 0.80 ± 0.03 | 0.05 | 0.019 |
| RPC-30 | 30 | 0.76 ± 0.03 | 0.18 | 0.066 |
| RPC-50 | 50 | 0.82 ± 0.03 | 0.44 | 0.095 |
Microscopically, the effect of the amount of pore-forming agent on the porous network can be seen in Fig. 2. Here we show SEM images of surface/break-planes (top) and polished cross sections (bottom) of the struts for the RPC samples listed in Table 1. For all cases, the strut surface appears less porous than the bulk, but there are no obvious gradients or regions of varying porosity throughout the bulk. Before cross sectional cutting, samples were immersed into organic resin that penetrated through all available open (connecting) pores. The contrast in color between filled and unfilled pores indicates the open and closed pores, respectively. For RPC-0, RPC-10, and RPC-20, most of the pores are closed. For RPC-30 and RPC-50, almost all pores are open, i.e. interconnected. These observations are consistent with the measurements listed in Table 1. In addition to pores resulting from pore-forming agents, all samples contained small intrinsic pores with a diameter of around 2 μm due to incomplete sintering or gas encapsulations during the sintering process.
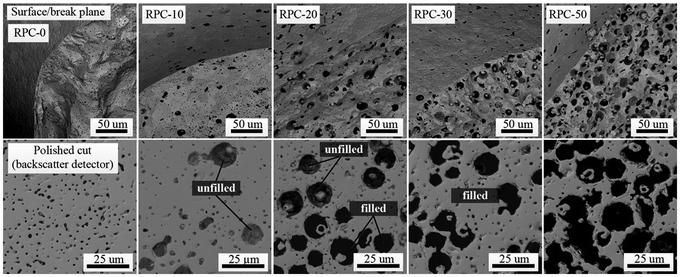 | ||
| Fig. 2 Top: SEM micrographs of the surface and break plane of RPC samples produced with varying amounts of pore-forming agent in the range 0 to 50 vol%. Bottom: SEM micrographs taken using a back-scattered electron detector of polished cuts through a single strut of the different samples. Samples were filled with an organic resin prior to cutting for examining pore interconnectivity. Table 1 lists the morphological characteristics of the RPC samples. | ||
Thermogravimetric analysis
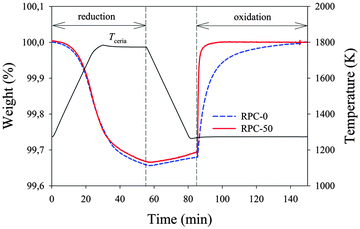
Samples were subjected to thermochemical redox cycling in a thermogravimetric analyzer. Samples were reduced at 1773 K under an Ar atmosphere with a background pO2 of 1.8 × 10⁻⁴ atm, measured by gas chromatography. Fig. 3 shows the relative weight change and temperature as a function of time during a single CO2-splitting redox cycle with RPC-0 (dashed line) and RPC-50 (solid line). The reduction step (eqn (1)) was performed at 1773 K and pO2 < 1.8 × 10⁻⁴ atm in Ar(g); the oxidation step (eqn (2b)) was performed at 1273 K and pCO2 = 0.385 atm. Total gas flow rates during reduction and oxidation were 260 mL min−1. It is found that εstrut did not have an observable influence on the reduction extents. Both samples began to noticeably reduce at around 1273 K and reached roughly the same reduction extents. The nonstoichiometry δ was 0.037 and 0.038 for RPC-50 and RPC-0, respectively, in agreement with the thermodynamic equilibrium values predicted from Panlener et al.27 The small difference in δ is attributed to measurement accuracy.After reduction, samples were cooled to 1273 K. The increase in weight during the cooling period (55 to 85 min in the x-axis) was due to partial re-oxidation with residual O2 in the system. The oxidation step was initiated at 1273 K by supplying CO2. Shortly afterwards, a rapid increase in weight for both samples, accompanied by CO evolution, indicated the onset of oxidation. The oxidation of RPC-50 was noticeably more rapid than that of RPC-0: 90% of the initial oxidation state was reached after 3 min for RPC-50 as compared to 28 min for RPC-0. Additionally, the average CO production rate to attain 90% of the initial oxidation state was roughly one order of magnitude higher: 2.22 ± 0.19 mL min−1 g−1 CeO2 for RPC-50 versus 0.22 ± 0.06 mL min−1 g−1 CeO2 for RPC-0. These remarkable differences are attributed to the difference in available SSA of the two samples (see Table 1), as confirmed by mercury porosimetry measurements.7,19,20,22
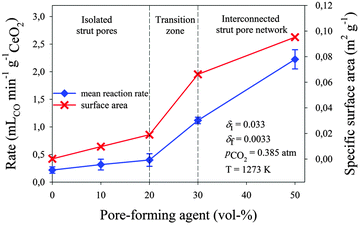
Fig. 4 shows the mean CO evolution rate during the oxidation step (to attain 90% of the initial oxidation state) and the SSA as a function of pore-forming agent vol% for all RPC samples following thermal reduction at 1773 K. Error bars indicate the standard deviation from the experimentally measured average values. For all cases, the rate scales well with measured SSA. For samples with closed pores RPC-0, RPC-10 and RPC-20, the CO production rate increased only marginally with a pore-forming agent, from 0.22 ± 0.06 mL min−1 g−1 CeO2 to 0.40 ± 0.13 mL min−1 g−1 CeO2. For samples with open (interconnected) pores RPC-30 and RPC-50, the rates increased substantially to 1.12 ± 0.06 mL min−1 g−1 CeO2 and 2.22 ± 0.19 mL min−1 g−1 CeO2, respectively. These rates are comparable to those obtained with porous monolithic ceria of SSA of 0.1 m2 g−1 under similar conditions.18 The beneficial effect of an interconnected pore network on the fuel production kinetics was also reported by Venstrom et al.19 for ceria structures in a fixed bed reactor. Based on their results with highly porous, 3D-ordered ceria structures with SSA > 10 m2 g−1, it is expected that further increasing the SSA of the RPC would result in even higher rates than presently reported. On the other hand, increasing SSA implies reducing the specific mass [kg m−3]. For solar reactors containing a fixed volume of ceria (without continuous feeding or removal of ceria),13,18,21,22,28–30 increasing SSA effectively lowers the total mass of reactive material and, consequently, lowers the fuel output per cycle. Thus, optimization of porosity is only one of the several factors to consider when maximizing the solar-to-fuel conversion efficiency.
Fig. 5 shows the mean CO evolution rates and CO production yields per cycle as a function of the cycle number for 20 consecutive redox cycles with RPC-50. The reduction step was performed at 1773 K and pO2 < 1.8 × 10⁻⁴ atm for 30 min; the oxidation step was performed at 1273 K and pCO2 = 0.385 atm for 60 min. The total gas flow rate during reduction and oxidation steps was 260 mL min−1. The CO production yield per cycle, calculated from the initial nonstoichiometry δi = 0.033 to the final nonstoichiometry δf = 0.0033, was roughly constant for all 20 cycles at 4.47 ± 0.06 mL g−1 CeO2 per cycle. This indicates stable performance over time. However, a slight and linear decrease in the oxidation rates (to attain 90% reaction extent) was observed over the cycles: from 2.01 mL min−1 g−1 CeO2 in cycle #1 to 1.76 mL min−1 g−1 CeO2 in cycle #20, which corresponds to an average increase in oxidation time of 0.9 seconds per cycle. Also shown in Fig. 5 are the SEM micrographs before (left) and after (right) the 20 cycles. No obvious changes in morphology were observed, but SSA decreased slightly from initially 0.098 m2 g−1 CeO2 to 0.089 m2 g−1 CeO2.
To further assess the morphological stability, RPC-50 samples were placed in a furnace under atmospheric air for 120 h at 1773 K and 1873 K. Fig. 6 shows the SEM micrographs of the strut's cross section for: (a) the unreacted sample; (b) after 120 h at 1773 K; and (c) after 120 h at 1873 K. The integrity of the strut was maintained. Although there was some grain growth, the interconnected network was not affected. However, SSA decreased from initially 0.095 m2 g−1 CeO2 to 0.056 m2 g−1 CeO2 (120 h at 1773 K) and 0.036 m2 g−1 CeO2 (120 h 1873 K). More extensive long-term cycling tests are required to evaluate the effect of such grain growth. Chueh et al.7 reported a strong decrease in reaction rates over the first 100 cycles when using porous monolithic ceria as a result of sintering, but constant rates were achieved during the following 400 cycles. In general, structures with nm-range pores are more likely to sinter, thereby losing a substantial amount of SSA over the initial cycles.19–21 We attribute the better morphological stability observed here to the larger pores (dmean = 10 μm in the struts) and to pre-sintering at temperatures higher than the maximum temperature during cycling (1873 versus 1773 K).
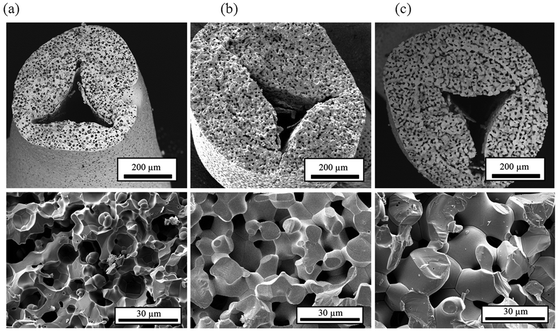 | ||
| Fig. 6 SEM micrographs of a strut's cross section of RPC-50: (a) unreacted; (b) after 120 h at 1773 K; and (c) after 120 h at 1873 K. | ||
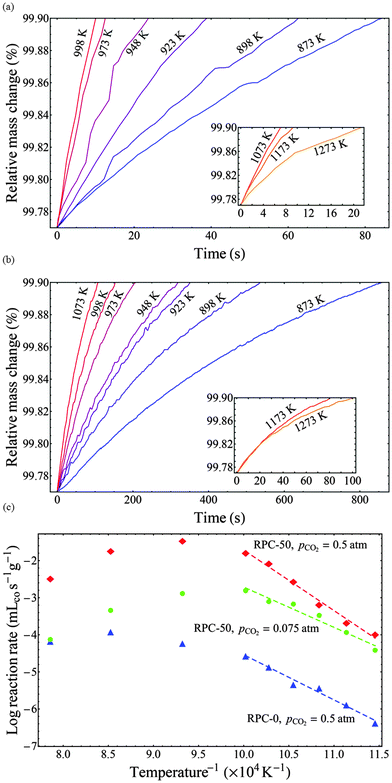
It is generally accepted that oxidation of ceria with CO2 is a surface-limited process.19,31 Observations in this study confirmed that the oxidation rate is strongly linked to the SSA (see Fig. 4). Further confirmation that the rates for RPCs with and without dual-scale porosity were limited by the same rate controlling mechanism was accomplished by performing isothermal thermogravimetric studies with RPC-0 (without porosity in the struts) and RPC-50 (with dual porosity). Fig. 7(a and b) shows the relative mass change as a function of time during the oxidation step at temperatures ranging from 873–1273 K and pCO2 = 0.5 atm for RPC-50 (a) and RPC-0 (b). Insets indicate the relative mass change vs. time at elevated temperatures (>1073 K) where the oxidation rate is inversely related to temperature. The oxidation rates increased with temperature between 873 and 1073 K, but the opposite is true for higher temperatures due to the reverse reaction (eqn (2b)) becoming thermodynamically favorable. Additionally, the influence of thermal reduction cannot be discounted and may also influence the observed rates.
Arrhenius plots derived from such data are shown in Fig. 7(c) for RPC-50 at pCO2 = 0.075 and 0.5 atm, and for RPC-0 at pCO2 = 0.5 atm. Here, the reaction rate at δ = 0.015 is shown as a function of the inverse temperature. The rates between RPC-0 and RPC-50 differ by 2 to 3 orders of magnitude. Qualitatively, both samples display the same trend with increasing temperature, namely an Arrhenius-type temperature dependence at low temperatures in which the forward reaction (eqn (2b)) is thermodynamically favored, and a region at higher temperatures deviating from a typical Arrhenius-type temperature dependence due to the influence of the reverse reaction (eqn (2b)) and/of thermal reduction. Apparent activation energies (Ea) were determined from the slope of the linear fits over the range of temperatures indicated in the figure. Corresponding values were: Ea = 135.7 kJ mol−1 for RPC-50 at pCO2 = 0.5 atm, Ea = 90.3 kJ mol−1 for RPC-50 at pCO2 = 0.075 atm; and Ea = 101.2 kJ mol−1 for RPC-0 at pCO2 = 0.5 atm. The higher Ea for RPC-50 is attributed to the reaction exothermicity, resulting in temperature measurements deviating from the actual sample temperature. Assuming no heat is dissipated during oxidation, the maximum temperature increase can reach:
 | (3) |
High-flux radiation experimentation
For the purpose of corroborating the superior performance of the dual-scale RPC under realistic solar operating conditions, tests were carried out using a solar cavity-receiver directly exposed to 3.8 kW of radiation power at a mean solar flux concentration of 3015 suns over the aperture. Results of a single redox cycle using RPC-30 are shown in Fig. 8. During the solar reduction step, the temperature rose rapidly at a peak heating rate of 184 K min−1 and reached a maximum temperature of 1847 K. Above 1200 K O2 evolution began and reached peak and average rates of 0.27 ± 0.05 mL min−1 g−1 CeO2 and 0.17 ± 0.05 mL min−1 g−1 CeO2, respectively. The total O2 evolution was 2.52 ± 0.09 mL g−1 CeO2 corresponding to δ = 0.039. After 15 min, the radiative power input was stopped, resulting in the immediate interruption of the reduction reaction and a decrease in reactor temperature. During the non-solar oxidation step, shortly after injection of CO2, rapid production of CO at peak and average rates of 1.13 ± 0.11 mL min−1 g−1 CeO2 and 0.63 ± 0.04 mL min−1 g−1 CeO2 was observed. Total CO production was 5.02 ± 0.33 mL g−1 CeO2 resulting in a fuel to oxygen ratio of 1.99 ± 0.21 implying that δ was fully exploited for fuel production.As expected, the behavior of RPC-30 during the reduction step is similar to the previously tested RPC-0.22 We attribute this to heat transfer limitations rather than chemical kinetics22 and therefore the strut porosity did not affect these rates. In contrast, the peak oxidation rate of RPC-30 was more than twice that of RPC-0,22 and complete oxidation was achieved within 10 min instead of around 30 min with RPC-0. While the oxidation time is 3 times faster and not 5 times faster as obtained with the TGA (see Fig. 4), a direct comparison between TGA and solar runs is difficult because temperatures and gas compositions within the solar reactor vary greatly in both space and time. Thus, anything beyond a qualitative agreement is not expected.
The solar-to-fuel energy conversion efficiency (ηsolar-to-fuel) is defined as the ratio of the heating value of the CO produced to the solar energy input. Any additional energy input should be accounted for; in our case we account for the energy penalty associated with the use of inert gas to promote the reduction step. ηsolar-to-fuel is calculated by integration of the CO production and energy consumption over the complete redox cycle as:
 | (4) |
3. Summary and conclusions
We have fabricated novel RPC structures made of ceria containing dual-scale porosity for application in solar thermochemical redox cycles for splitting H2O and CO2. The mm-size porosity enables volumetric absorption of concentrated solar radiation and uniform heating during reduction, while the μm-size porosity within the struts increases the SSA for enhanced reaction kinetics during oxidation. The dual-scale porosity caused a remarkable increase in the CO evolution rate by an order of magnitude, from 0.22 ± 0.06 mL min−1 g−1 CeO2 (RPC-0) to 2.22 ± 0.19 mL min−1 g−1 CeO2 (RPC-50), and consequently a significant decrease in the duration of the oxidation step from 28 min to 3 min. Oxidation rates scaled with SSA, which strongly increased when interconnection of the strut pores was achieved. Measurements of the apparent activation energy for RPC with dual-scale porosity (RPC-50) and without (RPC-0) further confirmed the surface-controlling mechanism. The strut porosity did not have a measurable effect on the observed O2 evolution during the reduction step. Stable CO production yields were obtained for 20 consecutive redox cycles, but a slight decrease in the oxidation rates was observed over time. SEM images before and after the 20 cycles did not show any obvious morphological changes, but a slight decrease in SSA was measured. SEMs taken after 120 h at 1773 and 1873 K revealed moderate grain growth. Nevertheless, the integrity of the struts and the interconnectivity of the strut network were preserved.Testing of the dual-scale RPC-30 in a solar cavity-receiver exposed to concentrated thermal radiation corroborated the TGA results. The duration of the oxidation step was decreased to one third compared to solar tests with RPC-0, thus increasing overall fuel production yield per unit time. Further improvement in overall solar-to-fuel conversion efficiency is expected through optimization of the hierarchical pore structure with the aid of direct pore-level numerical simulations.36,37
4. Experimental setup and methods
Synthesis of ceria RPC
Samples were manufactured by the replication method.38 Cerium(IV)-oxide powder (particle size < 5 μm, 99.9% purity, Sigma Aldrich) and spherical carbon pore-forming agent particles (particle size 0.4–12 μm, HTW Hochtemperatur-Werkstoffe GmbH) were mixed with water in a 5![[thin space (1/6-em)]](https://www.rsc.org/images/entities/char_2009.gif) :
:![[thin space (1/6-em)]](https://www.rsc.org/images/entities/char_2009.gif) 1 mass ratio, based on a previously published recipe.39 Organic deflocculating agent Dolapix CE 64 (Zimmer & Schwartz) was added in a ratio of 0.83 wt% of solid load. Mixing and deagglomeration were achieved by ball milling with ZrO2 grinding media for 24 hours. A polyvinyl alcohol binder (Optapix RA 4G, Zimmer & Schwartz) was dissolved while stirring the solution at 85 °C. The slurry was then cooled to ambient temperature and an antifoaming agent (Contraspum KWE, Zimmer & Schwartz) was added. Organic polyurethane sponges of 10 ppi (Foam-Partner, Fritz Nauer AG) were then immersed into the slurry. The coated foams were dried in air and finally sintered in an electrically heated furnace (Nabertherm GmbH) at 1873 K to remove the organic polyurethane matrix and carbon pore-forming agent particles and sinter the ceramic body.39
1 mass ratio, based on a previously published recipe.39 Organic deflocculating agent Dolapix CE 64 (Zimmer & Schwartz) was added in a ratio of 0.83 wt% of solid load. Mixing and deagglomeration were achieved by ball milling with ZrO2 grinding media for 24 hours. A polyvinyl alcohol binder (Optapix RA 4G, Zimmer & Schwartz) was dissolved while stirring the solution at 85 °C. The slurry was then cooled to ambient temperature and an antifoaming agent (Contraspum KWE, Zimmer & Schwartz) was added. Organic polyurethane sponges of 10 ppi (Foam-Partner, Fritz Nauer AG) were then immersed into the slurry. The coated foams were dried in air and finally sintered in an electrically heated furnace (Nabertherm GmbH) at 1873 K to remove the organic polyurethane matrix and carbon pore-forming agent particles and sinter the ceramic body.39
Characterization
Sample morphology and interconnectivity of the μm-scale pores were analyzed via scanning electron microscopy (SEM, Hitachi TM-1000 and ESEM XL30 with back-scattered electron detector). Interconnectivity was investigated by penetration of an organic resin into the porous network. Samples were first immersed in organic resin (Araldite BY 158 epoxy mixed with aliphatic polyamine Aradur 21 in a 4![[thin space (1/6-em)]](https://www.rsc.org/images/entities/char_2009.gif) :
:![[thin space (1/6-em)]](https://www.rsc.org/images/entities/char_2009.gif) 1 vol ratio) at a total pressure of 25 mbar. Complete penetration of resin into the pores was ensured by subsequent exposure to an overpressure of 2 bar. After hardening, the specimens were polished and a Pd/Au sputtering was applied to the surface to ensure electron conductivity during SEM analysis. Pore size distribution and SSA were analyzed using mercury intrusion porosimetry (Quantachrome Poremaster 60-GT, Quantachrome GmbH, Germany) assuming a cylindrical pore model.
1 vol ratio) at a total pressure of 25 mbar. Complete penetration of resin into the pores was ensured by subsequent exposure to an overpressure of 2 bar. After hardening, the specimens were polished and a Pd/Au sputtering was applied to the surface to ensure electron conductivity during SEM analysis. Pore size distribution and SSA were analyzed using mercury intrusion porosimetry (Quantachrome Poremaster 60-GT, Quantachrome GmbH, Germany) assuming a cylindrical pore model.
Experimental methodology with TGA
RPC samples were cycled in a thermogravimetric analyzer (TGA, Netzsch STA 409 SD). Samples with a mass of 1158 ± 12 mg were placed on a flat 17 mm diameter Al2O3 crucible. Gases were delivered using a mechanical mass flow controller (Voegtlin Q-Flow 140), and gas composition was analyzed by gas chromatography (GC, Varian 490). Thermal reduction was performed at 1773 K for 30 min under an Ar atmosphere with a background pO2 of 1.8 × 10⁻⁴ atm. Ar (99.999% purity) was delivered at a flow rate of 260 mL min−1 (SLPM; mass flow rates calculated at 273.15 K and 1 atm). Oxidation with CO2 (99.995% purity) was performed at temperatures ranging from 873 to 1273 K for 60 min. Unless otherwise stated, 160 mL min−1 of Ar(g) and 100 mL min−1 of CO2(g) were delivered during oxidation, resulting in a CO2 concentration of 0.385 atm inside the TGA furnace. Heating and cooling rates of 20 K min−1 were applied in all runs. To account for buoyancy effects, blank runs were performed with an inert ZrO2-made RPC of similar mass to the ceria-made RPC. Residual O2 during oxidation was accounted for by replacing CO2 with Ar and subtracting the observed mass increase.Experimental methodology using a solar reactor
RPC-30 (total mass = 948 g) was loaded in a solar cavity-receiver in the form of a cylinder composed of four 20 mm-thick, 60 mm-i.d., 100 mm-o.d. rings, and a single 20 mm-thick, 100 mm-o.d. disk. The solar reactor and peripheries were previously described in detail.22 Temperatures were measured at the outer surface of the RPC using B-type thermocouples. Argon (99.999% purity) and CO2 (99.998% purity) flow rates were regulated by electronic mass flow controllers (Bronkhorst F-201 C). Product gas composition was monitored by gas chromatography (Varian 490), supplemented by a paramagnetic alternating pressure based O2 detector (Siemens Oxymat 6) and infrared detectors for CO and CO2 (Siemens Ultrama). Experimentation was carried out at the High-Flux Solar Simulator (HFFSS) of ETH Zurich. An array of seven Xe-arcs, close-coupled to truncated ellipsoidal reflectors, provided an external source of intense thermal radiation that closely approximated the heat transfer characteristics of highly concentrating solar systems. During reduction, the solar power input (Psolar) was 3.8 kW and the Ar flow rate was 6 L min−1. During oxidation Psolar = 0 and the CO2 flow rate was 6 L min−1.Nomenclature
| C p | Heat capacity (J mol−1 K−1) |
| d mean | Mean pore size (m) |
| E a | Apparent activation energy (J mol−1) |
| E inert | Energy required to separate the inert gas from the air (J mol−1) |
| ΔHCO | Heating value of carbon monoxide (J mol−1) |
| h rxn | Reaction enthalpy (J mol−1) |
| P solar | Radiation power input (W) |
| p | Pressure (atm) |
| p O2 | Partial pressure of oxygen (atm) |
| p CO2 | Partial pressure of carbon dioxide (atm) |
| ppi | Pores per inch |
| r | Molar rate (mol s−1) |
| T | Temperature (K) |
| t | Time (s) |
Greek letters
| δ | Nonstoichiometry |
| δ i | Initial nonstoichiometry |
| δ f | Final nonstoichiometry |
| ε sample | Sample porosity |
| ε strut | Strut porosity |
| η solar-to-fuel | Solar-to-fuel energy conversion efficiency |
Abbreviations
| BET | Brunauer–Emmett–Teller theory |
| GC | Gas chromatography |
| RPC | Reticulated porous ceramic |
| SLPM | Standard liters per minute, calculated at 273.15 K and 1 atm |
| SEM | Scanning electron microscope |
| SSA | Specific surface area |
| TGA | Thermogravimetric analyzer |
Acknowledgements
Financial support from the Swiss Competence Center Energy & Mobility and from the European Research Council under the European Union's ERC Advanced Grant (SUNFUELS – no. 320541) is gratefully acknowledged.References
- A. Steinfeld, Sol. Energy, 2005, 78, 603–615 CrossRef CAS.
- C. Perkins and A. W. Weimer, Int. J. Hydrogen Energy, 2004, 29, 1587–1599 CrossRef CAS.
- G. P. Smestad and A. Steinfeld, Ind. Eng. Chem. Res., 2012, 51, 11828–11840 CrossRef CAS.
- C. Graves, S. D. Ebbesen, M. Mogensen and K. S. Lackner, Renewable Sustainable Energy Rev., 2011, 15, 1–23 CrossRef CAS.
- W. C. Chueh, A. H. McDaniel, M. E. Grass, Y. Hao, N. Jabeen, Z. Liu, S. M. Haile, K. F. McCarty, H. Bluhm and F. El Gabaly, Chem. Mater., 2012, 24, 1876–1882 CrossRef CAS.
- O. T. Sørensen, J. Solid State Chem., 1976, 18, 217–233 CrossRef.
- W. C. Chueh and S. M. Haile, Philos. Trans. R. Soc. London, Ser. A, 2010, 368, 3269–3294 CrossRef CAS PubMed.
- M. Zinkevich, D. Djurovic and F. Aldinger, Solid State Ionics, 2006, 177, 989–1001 CrossRef CAS.
- G. Zhou, P. R. Shah, T. Montini, P. Fornasiero and R. J. Gorte, Surf. Sci., 2007, 601, 2512–2519 CrossRef CAS.
- R. Bader, L. J. Venstrom, J. H. Davidson and W. Lipiński, Energy Fuels, 2013, 27, 5533–5544 CrossRef CAS.
- C. L. Muhich, B. W. Evanko, K. C. Weston, P. Lichty, X. Liang, J. Martinek, C. B. Musgrave and A. W. Weimer, Science, 2013, 341, 540–542 CrossRef CAS PubMed.
- Y. Hao, C.-K. Yang and S. M. Haile, Phys. Chem. Chem. Phys., 2013, 15, 17084–17092 RSC.
- M. Roeb, C. Sattler, R. Klüser, N. Monnerie, L. de Oliveira, A. G. Konstandopoulos, C. Agrafiotis, V. T. Zaspalis, L. Nalbandian, A. Steele and P. Stobbe, J. Sol. Energy Eng., 2006, 128, 125 CrossRef CAS.
- R. B. Diver, J. E. Miller, N. P. Siegel, T. A. Moss, ASME Conference Proceedings, 2010, 2010, 97–104.
- L. O. Schunk, P. Haeberling, S. Wepf, D. Wuillemin, A. Meier and A. Steinfeld, Trans. ASME: J. Sol. Energy Eng., 2008, 130, 201009 CrossRef.
- S. Abanades and G. Flamant, Sol. Energy, 2006, 80, 1611–1623 CrossRef CAS.
- T. Kodama, S.-i. Enomoto, T. Hatamachi and N. Gokon, J. Sol. Energy Eng., 2008, 130, 014504 CrossRef.
- W. C. Chueh, C. Falter, M. Abbott, D. Scipio, P. Furler, S. M. Haile and A. Steinfeld, Science, 2010, 330, 1797–1801 CrossRef CAS PubMed.
- L. J. Venstrom, N. Petkovich, S. Rudisill, A. Stein and J. H. Davidson, J. Sol. Energy Eng., 2012, 134, 011005 CrossRef.
- S. G. Rudisill, L. J. Venstrom, N. D. Petkovich, T. Quan, N. Hein, D. B. Boman, J. H. Davidson and A. Stein, J. Phys. Chem. C, 2012, 117, 1692–1700 Search PubMed.
- P. Furler, J. R. Scheffe and A. Steinfeld, Energy Environ. Sci., 2012, 5, 6098 CAS.
- P. Furler, J. R. Scheffe, M. Gorbar, L. Moes, U. Vogt and A. Steinfeld, Energy Fuels, 2012, 26, 7051–7059 CrossRef CAS.
- N. Gokon, T. Kodama, N. Imaizumi, J. Umeda and T. Seo, Int. J. Hydrogen Energy, 2011, 36, 2014–2028 CrossRef CAS.
- T. Kodama, T. Hasegawa, A. Nagasaki and N. Gokon, J. Sol. Energy Eng., 2009, 131, 021008 CrossRef.
- J. F. Muir, R. E. Hogan Jr, R. D. Skocypec and R. Buck, Sol. Energy, 1994, 52, 467–477 CrossRef CAS.
- N. Siegel, R. Diver, J. E. Miller, T. Garino, S. Livers, ASME Conference Proceedings, 2009, 2009, 431–437.
- R. J. Panlener, R. N. Blumenthal and J. E. Garnier, J. Phys. Chem. Solids, 1975, 36, 1213–1222 CrossRef CAS.
- R. B. Diver, J. E. Miller, M. D. Allendorf, N. P. Siegel and R. E. Hogan, J. Sol. Energy Eng., 2008, 130, 041001 CrossRef.
- J. Lapp, J. H. Davidson and W. Lipiński, J. Sol. Energy Eng., 2013, 135, 031004 CrossRef.
- H. Kaneko, T. Miura, A. Fuse, H. Ishihara, S. Taku, H. Fukuzumi, Y. Naganuma and Y. Tamaura, Energy Fuels, 2007, 21, 2287–2293 CrossRef CAS.
- W. C. Chueh and S. M. Haile, ChemSusChem, 2009, 2, 735–739 CrossRef CAS PubMed.
- M. W. Chase, C. A. Davies, J. R. Downey, D. J. Frurip, R. A. McDonald and A. N. Syverud, Standard Reference Data Program National Institute of Standards and Technology, Gaithersburg, 1986 Search PubMed.
- I. Riess, M. Ricken and J. Noelting, J. Solid State Chem., 1985, 57, 314–322 CrossRef CAS.
- O. Levenspiel, Chemical Reaction Engineering, John Wiley & Sons, 3rd edn, 1999 Search PubMed.
- H.-W. Haering, Industrial Gases Processing, Wiley-VCH Verlag GmbH & Co. KGaA, 2008 Search PubMed.
- S. Haussener, P. Coray, W. Lipinski, P. Wyss and A. Steinfeld, J. Heat Transfer, 2010, 132, 023305 CrossRef.
- S. Haussener and A. Steinfeld, Materials, 2012, 5, 192–209 CrossRef CAS.
- K. Schwartzwalder, H. Somers and V. A. Somers, Method of making porous ceramic articles, U. S. P. Office, US, 1963.
- U. F. Vogt, M. Gorbar, P. Dimopoulos-Eggenschwiler, A. Broenstrup, G. Wagner and P. Colombo, J. Eur. Ceram. Soc., 2010, 30, 3005–3011 CrossRef CAS.
| This journal is © the Owner Societies 2014 |

