 Open Access Article
Creative Commons Attribution 3.0 Unported Licence
Adsorbate induced vacancy formation on silver surfaces
Travis E.
Jones
*abc,
Tulio C. R.
Rocha
c,
Axel
Knop-Gericke
c,
Catherine
Stampfl
b,
Robert
Schlögl
c and
Simone
Piccinin
a
aCNR-IOM Democritos, c/o SISSA, via Bonomea 265 I-34136, Trieste, Italy. E-mail: trjones@mines.edu
bSchool of Physics, The University of Sydney, Sydney, New South Wales 2006, Australia
cDepartment of Inorganic Chemistry, Fritz-Haber-Institut der Max-Planck-Gesellschaft, Faradayweg 4-6, 14195, Berlin, Germany
First published on 25th March 2014
Abstract
The energy required to form and remove vacancies on metal surfaces mediates the rate of mass transport during a wide range of processes. These energies are known to be sensitive to environmental conditions. Here, we use electronic structure density functional theory calculations to show that the surface vacancy formation energy of silver changes markedly in the presence of adsorbed and dissolved oxygen. We found that adsorbed atomic oxygen can reduce the surface vacancy formation energy of the Ag(111) surface by more than 30%, whereas surface vacancy formation becomes exothermic in the presence of pure subsurface oxygen. We went on to show that the total directionality of the topologically defined bond paths can be used to understand these changes. The resulting structure–property relationship was used to predict the behavior of silver in different atmospheres. We show that the surface vacancy formation energy decreases when electronegative elements are adsorbed on the surface, but that it can increase when electropositive elements are adsorbed.
1 Introduction
Vacancies are important defects in fcc metals and are the primary channels for mass transport on metal surfaces.1,2 During processes such as faceting and coarsening, vacancy formation and migration energies determine the rate of mass transport.3–5 The adsorption of gases, or alloying, will change these energies.6–9 By understanding these changes, it may be possible to exploit them in the design of new materials, such as lead free solders,10 creep resistant alloys,11,12 and better catalysts.13,14 To this end, here, we report an investigation of the atmospheric effects on the surface vacancy formation energies of silver.Silver is a classic example of a metal whose surface self-diffusion is dependent on the atmosphere. It has long been known that silver surfaces are etched to show simple crystallographic planes at high temperature in air.15,16 And because silver can be thermally etched in air at standard atmospheric pressure, unlike other metals that require a more restrictive atmosphere, it has been the focus of numerous experimental investigations.15–19
These studies have revealed that the surface self-diffusion of silver increases markedly in an oxygen atmosphere at temperatures above 700 K as compared to an oxygen free atmosphere.17–19 At temperatures below 700 K, an oxygen atmosphere is known to produce a p(4 × 4) surface reconstruction of the Ag(111) surface,20–23 whereas above 700 K the presence of oxygen induces grain boundary grooving and faceting.24–26 However, these temperatures are too low to lead to the formation of sufficient vacancies in vacuo to result in the morphological changes observed under an O2 atmosphere.27 Clearly, oxygen plays an important role in reducing the surface vacancy formation energy of silver, as it does for chromium28 and ruthenium.29
In order to elucidate the effect of oxygen on the vacancy formation energy of silver, the function of a variety of oxygen species must be considered. Surface science studies have revealed that at temperatures above 700 K O2 dissociatively adsorbs onto the Ag(111) surface, resulting in three types of coadsorbed oxygen species.26 The first of these, Oads, is thought to be adsorbed atomic oxygen, which is present at surface coverages up to 1/4 of a monolayer (ML).26,27,30,31 Beyond this concentration, subsurface oxygen becomes energetically favorable32 and is thought to appear as a new species, Oss, that may coexist with Oads.26,33 As the concentration of the subsurface species increases beyond 1/4–1/2 ML at temperatures above 700 K, a substitutional species, Osub, is thought to form. The formation of this species coincides with the disappearance of Oads and Oss, which has prompted researchers to suggest Oads and Oss transformation into Osub.24–26 Large morphological changes are also associated with the formation of the substitutional species.34–37 Thus, Oads and Oss are likely responsible for the change in vacancy formation energy that allows the formation of the Osub species and the subsequent thermal etching.
To investigate the role these species play in vacancy formation, we calculated the surface vacancy formation energy of silver in their presence and absence by way of electronic structure density functional theory (DFT). We went on to develop structure–property relationships by correlating topological and geometric features of the electron charge density, ρ(![[r with combining right harpoon above (vector)]](https://www.rsc.org/images/entities/i_char_0072_20d1.gif) ), with our calculated vacancy formation energies. An advantage of developing structure–property relationships using ρ(
), with our calculated vacancy formation energies. An advantage of developing structure–property relationships using ρ(![[r with combining right harpoon above (vector)]](https://www.rsc.org/images/entities/i_char_0072_20d1.gif) ) is that the charge density is a quantum mechanical observable. And because all ground state properties are a consequence of ρ(
) is that the charge density is a quantum mechanical observable. And because all ground state properties are a consequence of ρ(![[r with combining right harpoon above (vector)]](https://www.rsc.org/images/entities/i_char_0072_20d1.gif) ),38 the gas phase39,40 and the solid state,40–42 processes occurring near the silver surface during vacancy formation in the presence of adsorbates can be described in the same framework. Importantly, in this work, the topological and geometric structure of ρ(
),38 the gas phase39,40 and the solid state,40–42 processes occurring near the silver surface during vacancy formation in the presence of adsorbates can be described in the same framework. Importantly, in this work, the topological and geometric structure of ρ(![[r with combining right harpoon above (vector)]](https://www.rsc.org/images/entities/i_char_0072_20d1.gif) ) has been used to uncover the atomic scale properties that mediate the ideal work of fracture, a process that shares many features with surface vacancy formation.43,44
) has been used to uncover the atomic scale properties that mediate the ideal work of fracture, a process that shares many features with surface vacancy formation.43,44
2 Topological model of bonding
Because ρ(![[r with combining right harpoon above (vector)]](https://www.rsc.org/images/entities/i_char_0072_20d1.gif) ) is a three dimensional scalar field, Morse theory tells us that its topology can be partially characterized by its rank three critical points (CPs).45,46 In a three dimensional field, there are four types of non-degenerate CP: a local maximum, local minimum, and two types of saddle point, which are commonly identified using the (rank, signature) notation. For a non-degenerate critical point the rank of the second derivative matrix, the Hessian, is always equal to the dimensionality of the space, for our cases it is three. The signature is the number of positive curvatures minus the number of negative curvatures. A maximum would then be denoted (3, −3) and a minimum (3, +3). The saddle point with two negative curvatures would be denoted as (3, −1) and the saddle with two positive curvatures a (3, +1) CP.
) is a three dimensional scalar field, Morse theory tells us that its topology can be partially characterized by its rank three critical points (CPs).45,46 In a three dimensional field, there are four types of non-degenerate CP: a local maximum, local minimum, and two types of saddle point, which are commonly identified using the (rank, signature) notation. For a non-degenerate critical point the rank of the second derivative matrix, the Hessian, is always equal to the dimensionality of the space, for our cases it is three. The signature is the number of positive curvatures minus the number of negative curvatures. A maximum would then be denoted (3, −3) and a minimum (3, +3). The saddle point with two negative curvatures would be denoted as (3, −1) and the saddle with two positive curvatures a (3, +1) CP.
Extensive theoretical and experimental studies have demonstrated that the topological properties of ρ(![[r with combining right harpoon above (vector)]](https://www.rsc.org/images/entities/i_char_0072_20d1.gif) ) correlate with elements of solid state structure and bonding.39–42,47–50 In particular, the locations of nuclei coincide with (3, −3) CPs, while a bond path has been shown to coincide with the existence of a ridge of maximum charge density connecting bound nuclei.51–54 A necessary and sufficient condition for the existence of such a ridge in the solid state is the presence of a (3, −1) CP. Thus, this CP is often referred to as a bond CP. The other two types of CP also correlate with features of solid state structure. A cage structure must enclose a single (3, +3) CP, which is often denoted a cage CP, while a (3, +1) CP is topologically required in ring structures, and is denoted a ring CP.54–56
) correlate with elements of solid state structure and bonding.39–42,47–50 In particular, the locations of nuclei coincide with (3, −3) CPs, while a bond path has been shown to coincide with the existence of a ridge of maximum charge density connecting bound nuclei.51–54 A necessary and sufficient condition for the existence of such a ridge in the solid state is the presence of a (3, −1) CP. Thus, this CP is often referred to as a bond CP. The other two types of CP also correlate with features of solid state structure. A cage structure must enclose a single (3, +3) CP, which is often denoted a cage CP, while a (3, +1) CP is topologically required in ring structures, and is denoted a ring CP.54–56
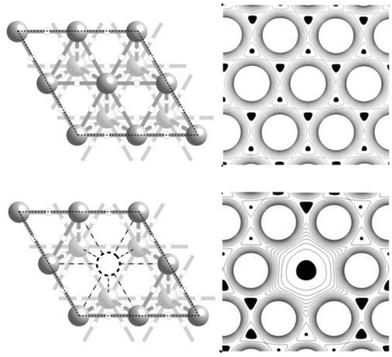
By way of example, Fig. 1 shows the topological bonding features of a Ag(111) surface with and without a surface vacancy. The left panel of the figure shows a traditional ball and stick plot of the surface. A charge density contour plot of this cut plane is shown to the right, with the minima colored black. Inspection of the figure reveals that each surface atom is a maximum in ρ(![[r with combining right harpoon above (vector)]](https://www.rsc.org/images/entities/i_char_0072_20d1.gif) ), corresponding to the nuclear positions in the ball and stick representation. A ridge can be seen to connect nearest neighbor maxima in the contour plot, as evident by the saddle points connecting each maxima to its six nearest neighbors. These saddle points are the (3, −1) bond points, while the ridge is the bond path, shown by way of the gray cylinders connecting atoms in the ball and stick plot. When a surface atom is removed, six of the surface bond paths are lost, as shown in the lower panel of Fig. 1. These topological features allow us to unambiguously uncover the changes in the number and type of bond paths that occur in silver in the presence and absence of adsorbates. However, because the topology has no metric that allows differentiation between Ag–O and Ag–Ag bonding, the number of bond paths alone cannot be used to describe vacancy formation in silver, as will be discussed in Section 5. Bond path properties must also be included.
), corresponding to the nuclear positions in the ball and stick representation. A ridge can be seen to connect nearest neighbor maxima in the contour plot, as evident by the saddle points connecting each maxima to its six nearest neighbors. These saddle points are the (3, −1) bond points, while the ridge is the bond path, shown by way of the gray cylinders connecting atoms in the ball and stick plot. When a surface atom is removed, six of the surface bond paths are lost, as shown in the lower panel of Fig. 1. These topological features allow us to unambiguously uncover the changes in the number and type of bond paths that occur in silver in the presence and absence of adsorbates. However, because the topology has no metric that allows differentiation between Ag–O and Ag–Ag bonding, the number of bond paths alone cannot be used to describe vacancy formation in silver, as will be discussed in Section 5. Bond path properties must also be included.
One potentially useful property is directionality, which has been used to rationalize other processes involving bond breaking in metals, including the cleavage behavior of bcc metals57 and Ir.58 Directionality has been quantified using the quadratic surface constructed from the Hessian of ρ(![[r with combining right harpoon above (vector)]](https://www.rsc.org/images/entities/i_char_0072_20d1.gif) ) at the bond CPs.57–61 This surface is the elliptic cone shown in Fig. 2 whose extreme angles are given by:
) at the bond CPs.57–61 This surface is the elliptic cone shown in Fig. 2 whose extreme angles are given by:
 | (1) |
![[r with combining right harpoon above (vector)]](https://www.rsc.org/images/entities/i_char_0072_20d1.gif) ) along the bond path.
) along the bond path.
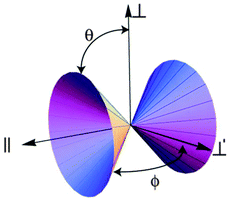 | ||
| Fig. 2 The elliptic cone formed by the locus of directions of zero curvature at a bond point. The angles θ and ϕ are defined in eqn (1). | ||
To facilitate visualization the elliptic cone formed by the locus of directions of zero curvature at a bond point on the Ag(111) surface is shown in Fig. 3. It has been projected into the plane containing the directions of principal curvature of the charge density parallel and normal to the bond path, those used to define ρ∥∥ and ρ⊥⊥ in Fig. 3a. The angle of the cone with respect to the ⊥ direction is θ. A similar representation of ϕ is shown in Fig. 3b, in which case the charge density cut plane again contains the direction of principal curvature parallel and normal to the bond path. However, in this case, the normal direction is taken as that used to define ρ⊥′⊥′. The angle the cone makes with the ⊥′ direction is ϕ.
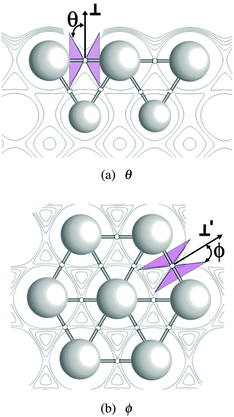 | ||
| Fig. 3 The elliptic cone formed by the locus of directions of zero curvature at a bond point in a Ag(111) surface viewed from the directions of principal curvature normal to the bond path. | ||
This definition offers a measure of the distance to bond breaking. Bond points can only be destroyed through a topological catastrophe in which one, or both, of the curvatures perpendicular to the bond path vanish.55,62–65 Such a catastrophe will occur when the elliptic cone at the bond CP transforms into intersecting planes. The angle of the elliptic cone formed by the locus of directions of zero curvature at a bond point will go to zero as the cone collapses. The cone will preferentially collapse in the direction of the smaller angle at a rate proportional to the value of the charge density at the bond CP, ρ0.61,66,67 Thus, the perturbation required to cause the topological catastrophe is proportional to the lower of the two values: ρ0![[thin space (1/6-em)]](https://www.rsc.org/images/entities/char_2009.gif) tan
tan![[thin space (1/6-em)]](https://www.rsc.org/images/entities/char_2009.gif) θ and ρ0
θ and ρ0![[thin space (1/6-em)]](https://www.rsc.org/images/entities/char_2009.gif) tan
tan![[thin space (1/6-em)]](https://www.rsc.org/images/entities/char_2009.gif) ϕ, which we will report as (ρ0
ϕ, which we will report as (ρ0![[thin space (1/6-em)]](https://www.rsc.org/images/entities/char_2009.gif) tan
tan![[thin space (1/6-em)]](https://www.rsc.org/images/entities/char_2009.gif) θ [e Å−3], ρ0
θ [e Å−3], ρ0![[thin space (1/6-em)]](https://www.rsc.org/images/entities/char_2009.gif) tan
tan![[thin space (1/6-em)]](https://www.rsc.org/images/entities/char_2009.gif) ϕ [e Å−3]) for brevity.
ϕ [e Å−3]) for brevity.
As we will show below, using the topology of the charge density to define bond paths and the geometry ρ(![[r with combining right harpoon above (vector)]](https://www.rsc.org/images/entities/i_char_0072_20d1.gif) ) to define directionality allows us to uncover structure–property relationships that describe vacancy formation in silver using different adsorbates and the role of alloying. Once identified, these relationships can be used to develop strategies to modify the vacancy formation energy.
) to define directionality allows us to uncover structure–property relationships that describe vacancy formation in silver using different adsorbates and the role of alloying. Once identified, these relationships can be used to develop strategies to modify the vacancy formation energy.
3 Methods
We performed spin-restricted DFT calculations using the Quantum Espresso (QE) package68 and ultrasoft pseudopotentials with a kinetic energy cutoff of 30 Ry for the wavefunctions and 300 Ry for the charge density. The generalized gradient approximation (GGA) developed by Perdew, Burke, and Ernzerhof69 was employed on a (12 × 12 × 1) Monkhorst–Pack k-point mesh70 for the (1 × 1) surface unit cell. Marzari–Vanderbilt cold smearing with a width of 0.02 Ry was used to improve convergence.71 The charge density analysis was done using the TECD software package.72All calculations were performed on a five layer Ag(111) slab that was separated from its periodic images with approximately five layers of vacuum. The in-plane dimensions of the (1 × 1) surface unit cell were fixed at 2.93 Å using the bulk silver lattice constant we calculated within QE, which is within 2% of the experimentally measured value.73 The atomic coordinates were allowed to relax, except the bottom layer of silver, which was held fixed. And because the minimum concentration of Oads needed to form the subsurface species is thought to be 1/4 ML, we chose to employ a (2 × 2) surface for all of the calculations.
Surface vacancy formation energies of both pure silver and silver with the different adsorbates were calculated as:
| Evac = (EbulkAg + EvacAg) − Esurf, | (2) |
The projected density of states (PDOS) were calculated as:
 | (3) |
4 Results
4.1 Clean surface
Table 1 summarizes the vacancy formation energies associated with the various oxygen species on the Ag(111) surface. Inspection of the table reveals that Evac of a clean Ag(111) surface is 0.48 eV without ionic relaxation and is 0.46 eV with relaxation, in good agreement with Li et al.'s value of 0.44 eV.27,30 As expected, the surface vacancy formation energy is substantially lower than the bulk vacancy formation energy, which we calculated to be 0.84 eV without relaxation and 0.81 eV with relaxation, in agreement with previous theoretical work, 0.80 eV74 and 0.86 eV,75 but approximately 0.2 eV below the vacancy formation energies derived from positron annihilation, 0.99–1.10 eV,76,77 quenching, 1.10 eV,1,78 and length change experiments, 1.09 eV.79| Surface | Vacancy | E unrelaxvac | E relaxvac | BCPs |
|---|---|---|---|---|
| Clean | Ag | 0.48 | 0.46 | 9 |
| Oads | AgO | 1.07 | — | 8 |
| Oads | AgAg | 0.16 | 0.14 | 9 |
| Oads & Oss | AgO | 1.12 | — | 6 |
| Oads & Oss | AgAg | 0.26 | 0.21 | 9 |
| Oss | AgO | 0.53 | −0.16 | 7 |
| Oss | AgAg | 0.15 | 0.11 | 9 |
On the pristine surface, the ionic relaxation is small as suggested by the small reduction in surface vacancy formation energy that accompanies relaxation which principally serves to reduce the interlayer spacing in the [111] direction upon formation of the surface vacancy. We found that while the distance between nearest neighbor surface atoms remains unchanged after surface vacancy formation, the interlayer spacing drops from 2.39 Å on the defect free surface to 2.33 Å upon relaxation with the surface vacancy present. This contraction of the top layer of silver serves to compensate for the loss of bonding associated with the formation of the surface vacancy shown in Fig. 1.
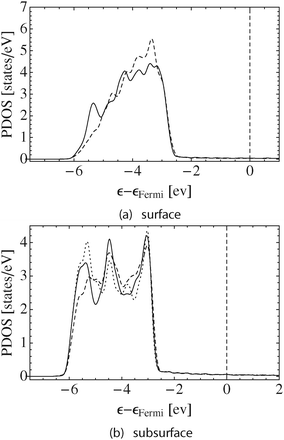
This loss in bonding associated with vacancy formation is also manifested in the PDOS. The solid lines in Fig. 4a and b show the d-states of the silver atoms on the pristine surface in the topmost layer and in the first subsurface layer, respectively. For comparison, the dotted line in Fig. 4b shows the d-states on a bulk fcc silver atom. In all cases the d-states appear between 2.5–6 eV below the Fermi energy, εF, which is set to zero and shown by way of the vertical dashed line in Fig. 4.
The PDOS on the surface atoms is narrower than in the bulk. This narrowing is due to both the reduction in the number of bond paths terminating at the surface atoms from 12 in the bulk to 9 on the surface, and the fact that the directionality of the bond paths connecting nearest neighbor surface atoms, (0.047, 0.068), is less than the directionality of the bond paths in the bulk, (0.079, 0.087).
The directionality of the bond paths connecting surface and subsurface atoms, (0.071, 0.088), is close to that found in the bulk. Furthermore, the full complement of 12 bond paths terminate at the subsurface atoms. As a result, the d-states on the subsurface silver atoms can be seen to strongly resemble those in bulk silver, Fig. 4b.
Fig. 4 also shows that further narrowing of the surface silver d-states relative to the bulk is observed when a surface vacancy is introduced, the dashed line in Fig. 4a. In this case, the response of d-states of the silver surface atoms at the vacancy edge is due to the reduction in the number of bond paths terminating at those atoms, from nine to eight bond paths, as the directionality of the remaining bond paths connecting surface atoms remains almost unchanged, (0.051, 0.068), from those on the pristine surface. While the same effect can also be seen in the subsurface, the dashed line in Fig. 4b, the subsurface atoms at the vacancy edge retain 11 bond paths. As such, the d-states on these atoms still resemble those of bulk fcc silver more than the d-states on the surface atoms.
4.2 Adsorbed oxygen
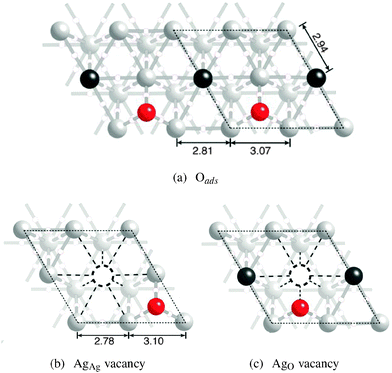
When 1/4 ML adsorbed oxygen is introduced, it preferentially adsorbs on the fcc hollow site,27 causing changes in the bonding on the silver surface. Fig. 5a shows a ball and stick model of a Ag(111) surface with 1/4 ML adsorbed oxygen. The black dashed line represents the surface unit cell, each of which contains a single adsorbed oxygen atom, shown by way of a red sphere.Inspection of Fig. 5a reveals that the presence of adsorbed oxygen lowers the symmetry of the surface, resulting in two symmetry unique surface silver atoms. One is bound to other silver atoms only. It is denoted AgAg in Table 1 and represented by black spheres in Fig. 5a. As indicated in Table 1 the bonding topology associated with the AgAg atoms is unchanged from the clean surface, with nine bond paths terminating at the AgAg atoms. The second type of silver surface atom is bound to oxygen and silver. It is denoted AgO in Table 1 and represented by light gray spheres in Fig. 5a. Unlike the atoms on the clean surface only eight bond paths terminate at the AgO atoms because each AgO atom is not bound to all six nearest neighbor surface silvers. In particular, each AgO atom sacrifices two AgO–AgO bond paths to form a single AgO–O bond path. These changes in bonding are accompanied by changes in the atomic structure.
The internuclear distances between nearest neighbor atoms are shown in Fig. 5. The distance between the bound AgO atoms is 2.81 Å, somewhat less than the 2.94 Å seen on the clean Ag(111) surface. The decrease in the distance between bound AgO atoms is accompanied by a compensatory increase in the internuclear separation between the nearest neighbor unbound AgO atoms to 3.07 Å. The AgO–AgAg distance remains unchanged from that seen on the clean surface, 2.94 Å. Adsorbed oxygen tends to pull the AgO atoms away from the underlying Ag(111) subsurface, thereby increasing the interlayer spacing in the [111] direction from the 2.39 Å found for the clean surface to 2.46 Å. There is a concomitant reduction in the AgAg interlayer separation to 2.30 Å.
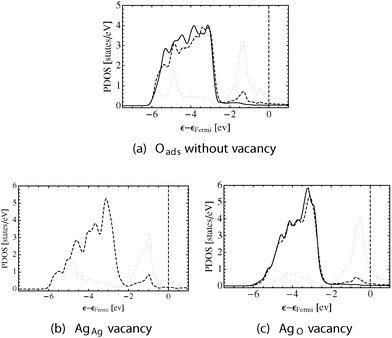
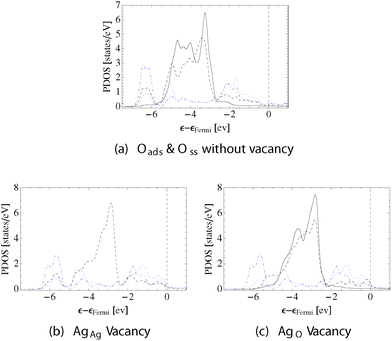
Like in the case of the pristine surface, the changes in bonding seen in the topology of ρ(![[r with combining right harpoon above (vector)]](https://www.rsc.org/images/entities/i_char_0072_20d1.gif) ) that drive the observed changes in geometry are also apparent in the PDOS. Fig. 6 shows the silver d-states on the AgAg and the AgO atoms by way of solid and dashed black lines, respectively. The oxygen p-states are shown using a dotted blue line.
) that drive the observed changes in geometry are also apparent in the PDOS. Fig. 6 shows the silver d-states on the AgAg and the AgO atoms by way of solid and dashed black lines, respectively. The oxygen p-states are shown using a dotted blue line.
On the defect free surface, Fig. 6a, the oxygen p-states can be seen to hybridize strongly with the AgO d-states leading to very directional AgO–O bond paths, (0.218, 0.300). The AgAg d-states do not mix appreciably with the oxygen p-states. As such, the changes in the AgAg d-states relative to the clean surface are instead due to oxygen induced differences in AgAg–AgO bonding, which cause a decrease in the directionality of the AgAg–AgO bond paths and an increase in that of the AgO–AgO bond paths, resulting in (0.044, 0.064) and (0.065, 0.086), respectively. The influence of oxygen is also apparent in the subsurface. The directionality of the bond paths originating in the subsurface and terminating at the surface AgO atoms is (0.065, 0.094), and the directionality of those terminating at the AgAg atoms is (0.045, 0.064).
These differences in bonding have a dramatic effect on the surface vacancy formation energy. The presence of adsorbed oxygen decreases the unrelaxed surface vacancy formation energy of AgAg to 0.16 eV and increases that of AgO to 1.07 eV.
The bonding topologies associated with AgAg and AgO vacancy structures are shown in Fig. 5b and c, respectively. In these figures, the position of the surface vacancy is indicated by way of a dashed circle and the bond paths lost upon vacancy formation are shown by way of dashed lines. Formation of the AgAg vacancy can be seen to result in the loss of Ag–Ag bonding, whereas formation of the AgO vacancy leads to a loss in both Ag–Ag and Ag–O bonding.
The different bonding topologies are mirrored in the PDOS. Fig. 6b shows that when the AgAg vacancy is formed the AgO d-states become narrower, as was observed on the clean surface, but still hybridize strongly with the oxygen p-states. Note that in this case there are no AgAg d-states because the AgAg atoms have been removed. Conversely, when the AgO vacancy is formed both types of surface silver atoms remain. The PDOS on both types of surface silver becomes narrower, and the mixing between the oxygen p-states and AgO d-states is greatly reduced, confirming the loss in Ag–O bonding seen in Fig. 5c.
As the surface vacancy formation energies indicate, the loss of the very directional Ag–O bond paths that occur when the AgO vacancy is formed is energetically unfavorable with respect to the loss of Ag–Ag bonding associated with the AgAg vacancy. When ionic relaxations are allowed, both types of surface vacancies relax into the bonding topology associated with the AgAg vacancy shown in Fig. 5b with the corresponding PDOS shown in Fig. 6b. Table 1 shows that when ionic relaxations are allowed after an AgAg vacancy has been formed Evac stays nearly constant. The minor role of ionic relaxation on the AgAg vacancy formation energy is a consequence of the fact there is little atomic rearrangement and, hence, little change in bonding upon relaxation. Like in the case of the clean surface, the primary mode of atomic relaxation is a 0.11 Å reduction in the interlayer spacing between the AgO atoms and the subsurface silver, with the distance between nearest neighbor unbound AgO atoms increasing by 0.03 Å. If, however, the AgO vacancy system is allowed to relax, the system adopts the atomic configuration associated with the AgAg vacancy. That is, with relaxation, the structure shown in Fig. 5c transforms into the topologically inequivalent structure shown in Fig. 5b. Thus, the Ag(111) surface with adsorbed O always prefers to form a AgAg vacancy.
4.3 Adsorbed and dissolved oxygen
When subsurface oxygen is introduced into the Oads system we find that the subsurface species preferentially dissolves into the tetrahedral holes to form the oxide-like structure shown in Fig. 7a, in agreement with ref. 32. This geometry preserves the two types of surface silver atoms, AgAg and AgO. However, in this case the AgO atom is bound to oxygen adsorbed on the surface and dissolved in the subsurface, the latter of which is labeled Oss in the figure. The additional bonding between silver and subsurface oxygen leads to the loss of all AgO–AgO bond paths. As a result, only six bond paths terminate at each AgO atom. The bonding topology associated with the AgAg atoms remains unchanged from the clean surface and the Ag(111) with Oads only.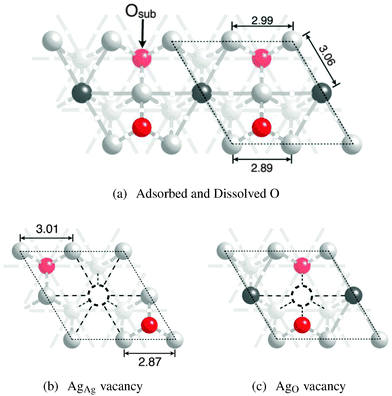 | ||
| Fig. 7 Ball and stick model of a Ag(111) surface with adsorbed and dissolved oxygen (a) using the coloring described in Fig. 5. The subsurface oxygen is labeled Oss. The surface AgAg (b) and AgO vacancies (c) are also shown. | ||
The changes in bonding topology associated with introducing Oss are manifested in changes to the atomic structure, which are indicated in Fig. 7a. The internuclear separation between nearest neighbor AgO–AgO atoms bound to the same Oads reduces from 3.07 Å when no subsurface oxygen is present to 2.89 Å in the presence of both Oads and Oss. This compression is due to the expansion of the silver atoms around the subsurface oxygen species, which increases the nearest neighbor AgO–AgO distance between silver atoms bound to a common Oss atom to 2.99 Å. The additional subsurface oxygen also increases the interlayer separation between the silver surface and subsurface atoms, with the AgO atoms lying 3.20 Å above the subsurface plane in the [111] direction and the AgAg at 2.32 Å, compared to 2.46 Å and 2.30 Å when only adsorbed oxygen is present. The expansion in the [111] direction also increases the AgO–AgAg distance to 3.06 Å, as compared to 2.94 Å without the subsurface oxygen.
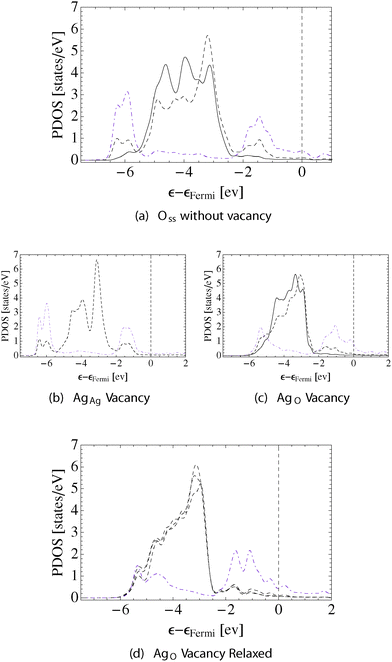
These differences in bonding topology and atomic structure give rise to changes in the PDOS and the bond path directionality. Fig. 8a shows the d-states on AgAg and AgO with a solid and dashed black line, respectively. The p-states on the adsorbed oxygen are shown with a dotted (blue online) line, and the p-states on the subsurface oxygen are shown by way of a dashed-dotted line (purple online). As is expected from the bonding topology, and as was observed when only adsorbed oxygen is present, appreciable mixing between the oxygen p-states and silver d-states is only seen with AgO. Unlike the previous example, however, the addition of subsurface oxygen can be seen to introduce states at approximately 6.5 eV below εF that are formed by a mixture of Oads and Oss p-states with AgO d-states. The change in bonding induced by Oss increases the directionality of the AgO–Oads bond paths to (0.256, 0.357), as compared to the (0.218, 0.300) seen in the absence of subsurface oxygen, and leads to the formation of very directional AgO–Oss bond paths (0.239, 0.328). Oss also modifies the AgAg states by reducing the AgO–AgAg bond path directionality to (0.039, 0.059).
Despite the differences observed between the silver surface with only adsorbed oxygen and that with both adsorbed and subsurface oxygen, the surface vacancy formation energies are similar. The unrelaxed AgAg vacancy formation energy in the presence of both Oads and Oss is 0.26 eV, and the unrelaxed AgO surface vacancy formation energy is 1.12 eV.
Comparing Fig. 7b and c suggests that formation of the AgAg vacancy is preferred over the AgO due to the fact that the former does not lead to a loss in the directional AgO–O bonding. The PDOS supports this conclusion. Fig. 8b shows that the mixing between the AgO d- and oxygen p-states is not strongly perturbed by the presence of the AgAg vacancy. However, Fig. 8c reveals that formation of the AgO vacancy leads to a substantial loss in AgO–O bonding.
When the AgAg and AgO vacancies are allowed to relax, both adopt the topology associated with the lower energy AgAg vacancy. Like in the previous example, ionic relaxation has a small effect on the AgAg surface vacancy formation energy, reducing it by 0.05 eV. The principle result of the relaxation of the AgAg vacancy when both Oads and Oss are present is a reduction in the interlayer spacing between the surface and subsurface silver in the [111] direction from 3.20 Å to 2.94 Å. The nearest neighbor AgO–AgO internuclear separations remain within 0.03 Å of the unrelaxed distances, with the relaxation leading to a minor expansion in the distances around the subsurface oxygen, Fig. 7b.
4.4 Dissolved oxygen
If the adsorbed oxygen is removed from the system, leaving only subsurface oxygen, the bonding topology is similar to what was found when only adsorbed oxygen is present. Two symmetry unique surface silver atoms can still be seen, Fig. 9a. And, as in the other cases, nine bond paths terminate at the AgAg atoms. Here, however, only seven bond paths terminate at the AgO atoms because of the loss of bonding between, not only the nearest neighbor AgO atoms, but the additional loss of a bond path connecting the AgO atoms to the subsurface silver.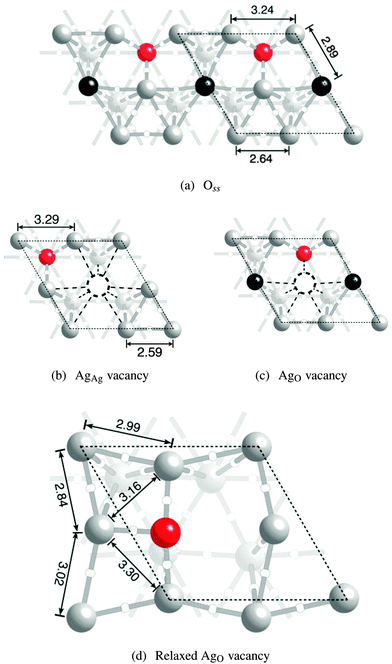 | ||
| Fig. 9 Ball and stick model of an Ag(111) surface with dissolved oxygen (a) using the coloring described in Fig. 5. The surface is also shown with a AgAg vacancy (b) and a AgO vacancy before (c) and after (d) relaxation. | ||
Inspection of Fig. 9a further reveals that the changes in internuclear separation that occur when going from the clean surface to the surface with subsurface oxygen are similar to the changes observed when going from the clean surface to oxygen adsorbed on the fcc hollow site. When Oss is present the distance between unbound nearest neighbor AgO atoms increases from the 2.94 Å seen on the clean surface to 3.24 Å, somewhat larger than the 3.07 Å seen for the case of Oads. This expansion reduces the internuclear separation between bound AgO atoms to 2.64 Å. The interlayer spacing between the AgO atoms and the subsurface silver in the [111] direction increases relatively to the clean surface, while the interlayer spacing between the AgAg atoms and the subsurface decreases, resulting in dAgO = 2.89 Å and dAgAg = 2.35 Å.
While the bonding topology and internuclear distances for the system with only subsurface oxygen present resembled the Oads system, the PDOS and bond path directionalities of the Oss system share characteristics of the system with both Oads and Oss. The black solid and dashed lines in Fig. 10 show the AgAg and AgO d-states, respectively. The dashed-dotted line (purple online) shows the oxygen p-states. In agreement with the bonding topology, little mixing can be seen between the AgAg d-states and Oss p-states, whereas the strong p–d hybridization between the subsurface oxygen and the AgO gives rise to features at 1.5 eV and 6.0 eV below the Fermi energy. Though the former feature is seen when only adsorbed oxygen is present, the latter is only observed after Oss had been introduced. The resulting AgO–O bond path directionality in this system remains high (0.216, 0.239). The changes in mixing between silver d-states induced by Oss result in a AgO–AgO bond path directionality of (0.077, 0.112), which is more directional than what we found on the other surfaces. Following the trend we have observed in the other cases, the increase in AgO–AgO bond path directionality is accompanied by a decrease in the AgAg–AgO bond path directionality, in this case to (0.036, 0.052), which is close to the directionality of the AgAg–AgO when both Oads and Oss are present.
These differences in bonding lead to a striking difference in vacancy formation energies between the surface with only subsurface oxygen present and those with adsorbed oxygen. In the current case, though the unrelaxed AgAg vacancy formation energy of 0.15 eV is nearly equal to the 0.16 eV found in the Oads system, the unrelaxed AgO vacancy formation energy of 0.53 eV is only marginally larger than the 0.48 eV found on the clean surface, Table 1. Moreover, unlike in the previous examples, both the AgAg and AgO relax into inequivalent structures with unique bonding topologies.
The ionic relaxations associated with the AgAg vacancy mirror are those seen in the other examples, Fig. 9b. The unbound nearest neighbor AgO–AgO distance increases by 0.05 Å and the interlayer spacing between the AgO atoms and the subsurface silver in the [111] direction decreases to 2.74 Å. The bonding topology shown in Fig. 9b reveals that, as in the previous examples, forming the AgAg vacancy does not result in the loss of AgO–O bonding. This view is supported by the PDOS shown in Fig. 10, which indicates that the mixing between the AgO d-states and the Oss p-states is not changed appreciably by the introduction of the AgAg vacancy.
Large atomic relaxations are associated with the AgO vacancy. Fig. 9c shows the system with a AgO vacancy before ionic relaxation, while Fig. 9d shows the same system after relaxation. Comparison of the figures reveals that relaxation leads to the formation of a new AgO–O bond path, resulting in a substitutional oxygen atom that is bound to all of the remaining surface silver atoms and reducing Evac to −0.16 eV, i.e. forming a vacancy becomes energetically favorable. The AgO–O internuclear distances are all roughly similar, and the oxygen lies in the plane of the surface silver atoms, allowing the interlayer spacing between the surface and subsurface silver in the [111] direction to drop below 2.45 Å. The changes in bonding associated with the relaxation that are seen in the topology of ρ(![[r with combining right harpoon above (vector)]](https://www.rsc.org/images/entities/i_char_0072_20d1.gif) ) are also reflected in the PDOS.
) are also reflected in the PDOS.
Comparing Fig. 10a and c supports the conclusion drawn from the topology of the electron charge density that upon formation of the AgO vacancy silver–oxygen bonding is lost. Furthermore, both the AgO and AgAg atoms can still be seen to be present in distinct chemical environments, with only the d-states on the AgO atom mixing appreciably with the oxygen p-states. When the system relaxes, however, all of the surface silver atoms become nearly equivalent and show mixing between the silver d- and oxygen p-states, Fig. 10d. The PDOS in this relaxed geometry can be seen to be distinct from that seen for Oss or Oads due to the fact the oxygen has become a surface substitutional species.
In summary, atomic oxygen can significantly alter the surface vacancy formation of silver. The magnitude and direction of these changes depend on the atomic structure of the Ag–O system. We will now turn to the origin of this behavior.
5 Discussion
5.1 Descriptor of vacancy formation energy
In order to gain more quantitative insight into oxygen's effect on the surface vacancy formation energy of silver, we can turn to the oxygen induced changes in bonding. The simplest strategy is to employ a bond path cutting model, i.e. the fewer the bond paths terminating at an atom, the lower its Evac. However, inspection of Table 1 reveals that there is no correlation between the total number of bond paths and Evac. For instance, nine bond paths terminate at every AgAg atom, yet the surface vacancy formation energies associated with these atoms is markedly different in the various systems. The problem becomes more apparent if we restrict ourselves to comparing unrelaxed surface vacancy formation energies, in which case even a reduction in the number of bond paths can coincide with an increase in Evac. Clearly, the number of bond paths alone is not a good predictor of the vacancy formation energy, and bond path properties must also be included. To begin, consider the differences between silver atoms in the bulk and on an ideal Ag(111) surface.We can first imagine a situation in which the surface and bulk bond paths are equivalent, which is a simple bond cutting model. This model would predict that the energy required to remove a surface atom would be 9/12, or 75%, of that in the bulk, because 12 bond paths must be broken to form a bulk vacancy and, as we saw in Section 2, only 9 bond paths are lost when a surface vacancy is formed. However, our calculated surface vacancy formation energy is only 57% of the bulk value, demonstrating that we must account for the inequivalence of the bond paths.
This inequivalence can be seen in the differences in internuclear separation between bound atoms discussed in Section 4. Internuclear separation, d, is often viewed as a measure of bond strength and has been shown to correlate with the magnitude of the electron charge density at the bond point connecting bound atoms, ρ0, in molecules80–83 and transition metal oxides.82,84 In agreement with these studies we see the expected power law dependence of ρ0 on internuclear separation between bound atoms, Fig. 11. Furthermore, the regression coefficients of ρ0 = αd−β are α = 6.489 and β = 3.293, which are close to the α = 6.795 and β = 3.483 found for O–O bonds in molecules,83 suggesting that the correlation may hold on surfaces.
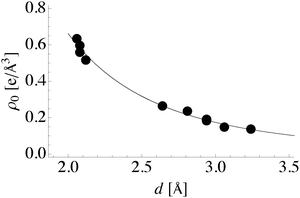 | ||
| Fig. 11 Charge density at the bond critical point versus internuclear separation. The fit line is given by ρ0 = 6.489d−3.293. | ||
However, though ρ0 correlates with internuclear separation, introducing this property into the bond cutting model by defining the total bonding associated with a nuclear site as:
 | (4) |
 | (5) |
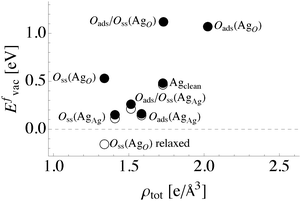 | ||
| Fig. 12 Total bonding at an atom site defined using the magnitude of the charge density as in eqn (4)versus surface vacancy formation energy in the presence of different oxygen species. The filled (unfilled) circles represent unrelaxed (relaxed) vacancy formation energies. | ||
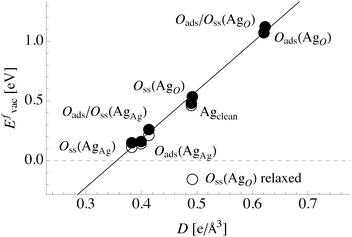
Comparing the total directionality of the bond paths terminating at a silver atom in the bulk to one on the clean (111) surface yields a Dsurface/Dbulk ratio of 52%. Thus, the ratio of total directionality is a more accurate predictor of differences in vacancy formation energies than the ratio of the number of bond paths alone. In fact, we found that the unrelaxed vacancy formation energy changes linearly with total directionality, Fig. 13. To understand this relationship in more detail, we will now turn to how the bonding in the Ag–O system changes in the presence of oxygen.
As we saw in Section 4, when 1/4 ML oxygen adsorbs on the Ag(111) surface to form Oads the bonding topology changes from that found on a clean silver surface. Each AgO gains a directional Ag–O bond path at the expense of two less directional Ag–Ag surface bond paths. The adsorbed oxygen also perturbs the neighboring bond paths, making the AgO–AgO bond paths more directional than those on a clean Ag(111) surface and the AgAg–AgO bond paths less directional. Thus, despite the fact that nine bond paths terminate at the AgAg atoms and only eight bond paths terminate at the AgO atoms, the total directionality of the former is 0.40, while D of AgO is 0.62. When these results are compared to the total directionality of a silver atom on the clean surface, D = 0.45, we would expect that adsorbed oxygen increases the vacancy formation energy of AgO but decreases that of AgAg, as we saw in Table 1. When ionic relaxations are included, both vacancies relax to the AgAg vacancy structure to maximize the number of Ag–O bond paths. However, because the bonding topology in the relaxed structure is identical to that of the unrelaxed AgAg vacancy, the change in energy between the unrelaxed and relaxed AgAg vacancy structures is small.
The fact that introducing subsurface oxygen into the system with Oads leads only to a small change in surface vacancy formation energy can also be rationalized in terms of oxygen induced differences in bond path directionality. When both Oss and Oads are present the AgAg atoms are again bound to nine atoms and have a total directionality of 0.41. And though the total number of bond paths terminating at the AgO drops from eight to six their total directionality remains at approximately 0.63 because an additional directional AgO–O bond path is formed at the expense of two less directional AgO–AgO bond paths. These slight increases in directionality are manifested as small increases in the surface vacancy formation energies shown in Table 1.
This trend of directional Ag–O bonding increasing the AgO and decreasing the AgAg surface vacancy formation energy continues when dissolved oxygen is present in the absence of adsorbed oxygen. Like in the previous cases, the AgAg atoms in this system are bound to the nine nearest neighbor Ag atoms. However, the total directionality of the bond paths terminating at the AgAg atoms is only 0.38 because the subsurface oxygen perturbs the Ag–Ag bonding more strongly than Oads, as shown in Section 4. The total directionality of the seven bond paths terminating at each AgO atom is 0.49. While these total directionalities recover the unrelaxed surface vacancy formation energies shown in Table 1, the effect of ionic relaxations reduces the relaxed AgO vacancy formation energy.
As was shown in Section 4, the AgAg and AgO vacancies relax to different structures when Oss is present without Oads, where we saw that, while the ionic relaxation associated with the AgAg vacancy results in no change in bonding and a minor reduction in Evac, relaxation of the AgO vacancy leads to the formation of an additional Ag–O bond path, which makes vacancy formation exothermic. Thus, pure subsurface oxygen will induce a restructuring of the Ag(111) surface wherein vacancies spontaneously form, allowing the subsurface oxygen to become a surface substitutional, which could help explain the increase in surface self-diffusion of silver in an oxygen atmosphere above 700 K, as compared to an oxygen free atmosphere.17–19
These trends are summarized graphically in the plot of surface vacancy formation energy versus total directionality in Fig. 13. The dashed horizontal line shows Evac = 0 eV. The filled circles are the values of Evac without ionic relaxation and the unfilled circles show Evac with ionic relaxation. The total directionality correlates with the unrelaxed surface vacancy formation energy. When there are no topological changes associated with relaxation D also correlates well with the relaxed surface vacancy formation energy.
5.2 Chemical trends in surface vacancy formation
This structure–property relationship between total directionality and surface vacancy formation energy allows us to use simple chemical concepts to predict how the surface vacancy formation energy will change under different atmospheres or with alloying. Such changes could modify the directionality of the surface–adsorbate bond paths or the surface–surface bond paths.We would expect, for instance, that the silver surface vacancy formation energy would be decreased further by introducing an element that can form more directional bonds with the silver surface than oxygen, such as sulfur, which adsorbs on the fcc hollow site of the Ag(111) surface at 1/4 ML coverage,85 resulting in a reduction in the unrelaxed Evac of the AgAg to 0.22 eV. As we found in the case of adsorbed oxygen, ionic relaxations play a minor role, reducing Evac to 0.18 eV. This pronounced reduction in the surface vacancy formation energy of silver in the presence of sulfur may help explain the experimentally observed increase in surface self-diffusion seen in this system.86
An adsorbate that is more electronegative than oxygen, such as a halogen, can reduce the surface vacancy formation energy below what we found in the presence of oxygen by withdrawing more density from the silver surface bonds. Cl, for instance, adsorbs on the fcc hollow site of the Ag(111) surface at 1/4 ML coverage.87,88 We found that it reduces Evac of the AgAg atoms to 0.20 eV, significantly lower than the 0.34 eV found in the presence of 1/4 ML adsorbed oxygen. Because chlorine does not form a substitutional species on the Ag(111) surface87 the effect of ionic relaxations are minor, reducing Evac to 0.16 eV.
In contrast to the previous examples, when an electropositive element adsorbs on silver we would expect it to increase the surface vacancy formation energy. Take sodium for example, it will not form directional bonds with the silver surface because its valence density is a consequence of its s-character. Because its electronegativity is less than that of silver's, sodium will donate density to the surface, thereby increasing the directionality of the Ag–Ag surface bonds. As expected, when 1/4 ML sodium is adsorbed on the fcc hollow sites of the Ag(111) surface, we found that the unrelaxed surface vacancy formation increases to 0.59 eV for the AgNa and 0.58 eV for the AgAg atoms. Note that these effects are not specific to the silver system, as evidenced by the fact that sodium has also been shown to increase the vacancy formation energy on a ruthenium surface.29 Because of this fact, we can also consider the effect of alloying.
Take Cu/Ag alloys, for example, which are known to have a tendency to segregate.89 In the presence of oxygen, copper moves to the Ag(111) surface due to the fact that copper and oxygen form very directional bonds.90–93 This directional Cu–O bonding will result in a large Evac of copper, but will reduce that of any surface silver atoms. We found that when 1/4 of the Ag(111) surface atoms are substituted with copper, the work required to remove the surface silver atom drops to 0.09 eV. This large drop in Evac is in agreement with the high surface mobility found in Ag–Cu particles under air, in which copper is immobile and the surface diffusion of silver is entirely responsible for the formation of sintered necks.94
6 Conclusions
In summary, we have used DFT calculations to show that dissolved and adsorbed oxygen lower the surface vacancy formation energy of silver. We went on to show that the total directionality of the topological bond paths correlates with these changes in surface vacancy formation energy. We then used this correlation to develop a structure–property relationship to allow us to predict how changing the gas phase or alloying the silver would alter the surface vacancy formation energy. Adsorbed electronegative elements tend to decrease the surface vacancy formation energy by withdrawing density from the silver surface and reducing the directionality of the Ag–Ag surface bonds, whereas electropositive adsorbates donate electron density to the silver surface and increase the directionality of Ag–Ag surface bonds. These results suggest that, during sintering, surface reactions and other processes that depend critically upon the nature of surface defects selectively alloying or altering the gas phase can have a substantial effect on properties and performance.Acknowledgements
We gratefully acknowledge the Australian Research Council and the CINECA award under the ISCRA initiative, for the availability of high performance computing resources and support.References
- M. Doyama and J. S. Koehler, Phys. Rev., 1962, 127, 21–31 CrossRef CAS.
- A. Zangwill, Physics at Surfaces, Cambridge University Press, New York, 1988 Search PubMed.
- Z. Wang, Y. Li and J. B. Adams, Surf. Sci., 2000, 450, 51–63 CrossRef CAS.
- J.-M. Wen, J. W. Evans, M. C. Bartelt, J. W. Burnett and P. A. Thiel, Phys. Rev. Lett., 1996, 76, 652–655 CrossRef CAS.
- A. R. Akbarzadeh, Z. Z. Chen and N. Kioussis, Phys. Rev. B: Condens. Matter Mater. Phys., 2009, 79, 195404 CrossRef.
- G. Mathieu, P. Gas, A. Combe-Brun and J. Bernardini, Acta Metall. Mater., 1983, 31, 1661–1667 CrossRef CAS.
- H. E. Collins and P. G. Shewmon, Trans. Metall. Soc. AIME, 1966, 236, 1354–1360 CAS.
- F. Delamre and G. H. Rhead, Surf. Sci., 1971, 28, 267–284 CrossRef.
- H. Grabke, E. Petersen and S. Srinivasan, Surf. Sci., 1977, 67, 501–516 CrossRef CAS.
- T. Kunimune, M. Kuramoto, S. Ogawa, M. Nogi and K. Suganuma, IEEE Trans. Compon., Packag., Manuf. Technol., 2013, 3, 363–369 CrossRef CAS.
- W. Johnson, R. Barrett and W. Nix, Metall. Trans., 1972, 3, 695–698 CrossRef CAS.
- S. Fujishiro and D. Eylon, Scr. Metall. Mater., 1977, 11, 1011–1016 CrossRef CAS.
- X. Bao, G. Lehmpfuhl, G. Weinberg, R. Schlogl and G. Ertl, J. Chem. Soc., Faraday Trans., 1992, 88, 865–872 RSC.
- S. R. Seyedmonir, D. E. Strohmayer, G. J. Guskey, G. L. Geoffroy and M. A. Vannice, J. Catal., 1985, 93, 288–302 CAS.
- B. Chalmers, R. King and R. Shuttleworth, Proc. R. Soc. London, Ser. A, 1948, 193, 465–483 CrossRef CAS.
- A. Moore, Acta Metall. Mater., 1958, 6, 293–304 CrossRef CAS.
- G. Rhead and H. Mykura, Acta Metall. Mater., 1962, 10, 843–856 CrossRef CAS.
- G. Rhead, Acta Metall. Mater., 1963, 11, 1035–1042 CrossRef CAS.
- G. E. Rhead, Acta Metall. Mater., 1965, 13, 223–226 CrossRef CAS.
- C. Carlisle, T. Fujimoto, W. Sim and D. King, Surf. Sci., 2000, 470, 15–31 CrossRef CAS.
- J. Schnadt, A. Michaelides, J. Knudsen, R. T. Vang, K. Reuter, E. Lægsgaard, M. Scheffler and F. Besenbacher, Phys. Rev. Lett., 2006, 96, 146101 CrossRef CAS.
- M. Schmid, A. Reicho, A. Stierle, I. Costina, J. Klikovits, P. Kostelnik, O. Dubay, G. Kresse, J. Gustafson, E. Lundgren, J. N. Andersen, H. Dosch and P. Varga, Phys. Rev. Lett., 2006, 96, 146102 CrossRef CAS.
- R. Reichelt, S. Gunther, M. Rossler, J. Wintterlin, B. Kubias, B. Jakobi and R. Schlögl, Phys. Chem. Chem. Phys., 2007, 9, 3590–3599 RSC.
- H. Schubert, U. Tegtmeyer, D. Herein, X. Bao, M. Muhler and R. Schlögl, Catal. Lett., 1995, 33, 305–319 CrossRef CAS.
- X. Bao, M. Muhler, T. Schedel-Niedrig and R. Schlögl, Phys. Rev. B: Condens. Matter Mater. Phys., 1996, 54, 2249–2262 CrossRef CAS.
- T. C. R. Rocha, A. Oestereich, D. V. Demidov, M. Havecker, S. Zafeiratos, G. Weinberg, V. I. Bukhtiyarov, A. Knop-Gericke and R. Schlögl, Phys. Chem. Chem. Phys., 2012, 14, 4554–4564 RSC.
- W.-X. Li, C. Stampfl and M. Scheffler, Phys. Rev. B: Condens. Matter Mater. Phys., 2002, 65, 075407 Search PubMed.
- M. Schmid, G. Leonardelli, M. Sporn, E. Platzgummer, W. Hebenstreit, M. Pinczolits and P. Varga, Phys. Rev. Lett., 1999, 82, 355–358 CrossRef CAS.
- C. Stampfl and M. Scheffler, Phys. Rev. B: Condens. Matter Mater. Phys., 2002, 65, 155417 CrossRef.
- W.-X. Li, C. Stampfl and M. Scheffler, Phys. Rev. B: Condens. Matter Mater. Phys., 2003, 68, 165412 CrossRef.
- W.-X. Li, C. Stampfl and M. Scheffler, Phys. Rev. Lett., 2003, 90, 256102 CrossRef.
- W.-X. Li, C. Stampfl and M. Scheffler, Phys. Rev. B: Condens. Matter Mater. Phys., 2003, 67, 045408 CrossRef.
- C. Rehren, X. B. M. Muhler, R. Schlögl and G. Ertl, Z. Phys. Chem., 1991, 174, 11–52 CrossRef CAS.
- G. I. N. Waterhouse, G. A. Bowmaker and J. B. Metson, Appl. Catal., A, 2004, 265, 85–101 CrossRef CAS PubMed.
- G. I. Waterhouse, G. A. Bowmaker and J. B. Metson, Appl. Surf. Sci., 2003, 214, 36–51 CrossRef CAS.
- X. Bao, M. Muhler, B. Pettinger, R. Schlögl and G. Ertl, Catal. Lett., 1993, 22, 215–225 CrossRef CAS.
- G. J. Millar, M. B. Nelson and P. J. R. Uwins, J. Catal., 1997, 169, 143–156 CrossRef CAS.
- P. Hohenberg and W. Kohn, Phys. Rev., 1964, 136, B864–B871 CrossRef.
- R. F. W. Bader, Atoms in Molecules. A Quantum Theory, Clarendon Press, Oxford, 1990 Search PubMed.
- The Quantum Theory of Atoms in Molecules: From Solid State to DNA and Drug Design, ed. C. F. Matta and R. J. Boyd, Wiley-VCH, 2007 Search PubMed.
- A. Martn Pendás, A. Costales and V. Luaña, Phys. Rev. B: Condens. Matter Mater. Phys., 1997, 55, 4275–4284 CrossRef.
- P. F. Zou and R. F. W. Bader, Acta Crystallogr., Sect. A: Found. Crystallogr., 1994, 50, 714–725 CrossRef.
- M. E. Eberhart, D. P. Clougherty and J. M. MacLaren, J. Am. Chem. Soc., 1993, 115, 5762–5767 CrossRef CAS.
- T. E. Jones, M. E. Eberhart, S. Imlay, C. Mackey and G. B. Olson, Phys. Rev. Lett., 2012, 109, 125506 Search PubMed.
- Morse Theory, ed. J. Milnor, Princeton University Press, 1963 Search PubMed.
- T. E. Jones and M. E. Eberhart, J. Chem. Phys., 2009, 130, 204108 CrossRef PubMed.
- T. E. Jones and M. E. Eberhart, Acta Crystallogr., Sect. A: Found. Crystallogr., 2009, 65, 141–144 CrossRef CAS PubMed.
- P. Coppens, X-Ray Charge Densities and Chemical Bonding, Oxford University Press, Cambridge, England, 1997 Search PubMed.
- T. S. Koritsanszky and P. Coppens, Chem. Rev., 2001, 101, 1583–1628 CrossRef CAS PubMed.
- B. B. Iversen, F. K. Larsen, M. Souhassou and M. Takata, Acta Crystallogr., Sect. B: Struct. Sci., 1995, 51, 580–591 CrossRef.
- T. A. Keith, R. F. W. Bader and Y. Aray, Int. J. Quantum Chem., 1996, 57, 183–198 CAS.
- R. F. W. Bader, J. Phys. Chem. A, 1998, 102, 7314–7323 CrossRef CAS.
- R. F. W. Bader and D.-C. Fang, J. Chem. Theory Comput., 2005, 1, 403–414 CrossRef CAS.
- G. R. Runtz, R. F. W. Bader and R. R. Messer, Can. J. Chem., 1977, 55, 3040–3045 CrossRef CAS.
- K. Collard and G. G. Hall, Int. J. Quantum Chem., 1977, 12, 623–637 CAS.
- N. Castillo, C. F. Matta and R. J. Boyd, Chem. Phys. Lett., 2005, 409, 265–269 CrossRef CAS PubMed.
- M. E. Eberhart, Philos. Mag. A, 1996, 73, 47–60 CAS.
- N. Kioussis, M. Herbranson, E. Collins and M. E. Eberhart, Phys. Rev. Lett., 2002, 88, 125501 CrossRef.
- M. Eberhart, Acta Mater., 1996, 44, 2495–2504 CrossRef CAS.
- X. F. Wang, T. E. Jones, W. Li and Y. C. Zhou, Phys. Rev. B: Condens. Matter Mater. Phys., 2012, 85, 134108 CrossRef.
- M. E. Eberhart and T. E. Jones, Phys. Rev. B: Condens. Matter Mater. Phys., 2012, 86, 134106 CrossRef.
- T. Poston and I. Stewart, Catastrophe Theory and its Applications, Dover, New York, 1981 Search PubMed.
- R. F. W. Bader, T. T. Nguyen-Dang and Y. Tal, J. Chem. Phys., 1979, 70, 4316–4329 CrossRef CAS PubMed.
- R. F. W. Bader, T. T. Nguyen-Dang and Y. Tal, Rep. Prog. Phys., 1981, 44, 893 CrossRef.
- T. E. Jones, M. E. Eberhart and D. P. Clougherty, Phys. Rev. Lett., 2010, 105, 265702 CrossRef.
- P. Ayers and S. Jenkins, J. Chem. Phys., 2009, 130, 154104 CrossRef PubMed.
- A. Guevara-García, E. Echegaray, A. Toro-Labbe, S. Jenkins, S. Kirk and P. W. Ayers, J. Chem. Phys., 2011, 134, 234106 CrossRef PubMed.
- P. Giannozzi, S. Baroni, N. Bonini, M. Calandra, R. Car, C. Cavazzoni, D. Ceresoli, G. L. Chiarotti, M. Cococcioni, I. Dabo, A. Dal Corso, S. de Gironcoli, S. Fabris, G. Fratesi, R. Gebauer, U. Gerstmann, C. Gougoussis, A. Kokalj, M. Lazzeri, L. Martin-Samos, N. Marzari, F. Mauri, R. Mazzarello, S. Paolini, A. Pasquarello, L. Paulatto, C. Sbraccia, S. Scandolo, G. Sclauzero, A. P. Seitsonen, A. Smogunov, P. Umari and R. M. Wentzcovitch, J. Phys.: Condens. Matter, 2009, 21, 395502 CrossRef PubMed.
- J. P. Perdew, K. Burke and M. Ernzerhof, Phys. Rev. Lett., 1996, 77, 3865–3868 CrossRef CAS.
- H. J. Monkhorst and J. D. Pack, Phys. Rev. B: Condens. Matter Mater. Phys., 1976, 13, 5188–5192 Search PubMed.
- N. Marzari, D. Vanderbilt, A. De Vita and M. C. Payne, Phys. Rev. Lett., 1999, 82, 3296–3299 CrossRef CAS.
- TECD, 2004, http://inside.mines.edu/meberhar/MTG.
- P. Villars and L. D. Calvert, Pearson's Handbook of Crystallographic Data for Intermetallic Phases, American Society for Metals, Metals Park, OH, 1985, vol. 3 Search PubMed.
- T. Hoshino, T. Mizuno, M. Asato and H. Fukushima, Mater. Trans., 2001, 42, 2206–2215 CrossRef CAS.
- J.-P. Crocombette, H. de Monestrol and F. Willaime, Phys. Rev. B: Condens. Matter Mater. Phys., 2002, 66, 024114 CrossRef.
- J. McGervey and W. Triftshauser, Phys. Lett. A, 1973, 44, 53–54 CrossRef CAS.
- W. Triftshauser and J. McGervey, Appl. Phys., 1975, 6, 177–180 Search PubMed.
- M. Doyama and J. S. Koehler, Phys. Rev., 1960, 119, 939 CAS.
- R. O. Simmons and R. W. Balluffi, Phys. Rev., 1960, 119, 600–605 CrossRef CAS.
- O. Knop, R. J. Boyd and S. C. Choi, J. Am. Chem. Soc., 1988, 110, 7299–7301 CrossRef CAS.
- I. Alkorta, I. Rozas and J. Elguero, Struct. Chem., 1998, 9, 243–247 CrossRef CAS.
- G. V. Gibbs, F. C. Hill, M. B. Boisen and R. T. Downs, Phys. Chem. Miner., 1998, 25, 585–590 CrossRef CAS.
- N. Castillo, K. N. Robertson, S. C. Choi, R. J. Boyd and O. Knop, J. Comput. Chem., 2008, 29, 367–379 CrossRef CAS PubMed.
- G. Gibbs, N. Ross, D. Cox, K. Rosso, B. Iversen and M. Spackman, Phys. Chem. Miner., 2014, 41, 17–25 CrossRef CAS.
- L. A. Soria, G. Zampieri and M. L. Martiarena, J. Phys. Chem. C, 2011, 115, 9587–9592 CAS.
- F. Delamre and G. H. Rhead, Surf. Sci., 1967, 7, 175–178 CrossRef.
- N. H. de Leeuw, C. J. Nelson, C. R. A. Catlow, P. Sautet and W. Dong, Phys. Rev. B: Condens. Matter Mater. Phys., 2004, 69, 045419 CrossRef.
- P. Gava, A. Kokalj, S. de Gironcoli and S. Baroni, Phys. Rev. B: Condens. Matter Mater. Phys., 2008, 78, 165419 CrossRef.
- K. Terakura, T. Oguchi, T. Mohri and K. Watanabe, Phys. Rev. B: Condens. Matter Mater. Phys., 1987, 35, 2169–2173 CrossRef CAS.
- S. Piccinin, S. Zafeiratos, C. Stampfl, T. W. Hansen, M. Hävecker, D. Teschner, V. I. Bukhtiyarov, F. Girgsdies, A. Knop-Gericke, R. Schlögl and M. Scheffler, Phys. Rev. Lett., 2010, 104, 035503 CrossRef.
- S. Piccinin, C. Stampfl and M. Scheffler, Phys. Rev. B: Condens. Matter Mater. Phys., 2008, 77, 075426 CrossRef.
- S. Piccinin, C. Stampfl and M. Scheffler, Surf. Sci., 2009, 603, 1467–1475 CrossRef CAS PubMed.
- A. Soon, M. Todorova, B. Delley and C. Stampfl, Phys. Rev. B: Condens. Matter Mater. Phys., 2006, 73, 165424 CrossRef.
- S. J. Kim, E. A. Stach and C. A. Handwerker, Appl. Phys. Lett., 2010, 96, 144101 CrossRef PubMed.
| This journal is © the Owner Societies 2014 |

