 Open Access Article
Effect of ordering of PtCu3 nanoparticle structure on the activity and stability for the oxygen reduction reaction†
Nejc
Hodnik
*ab,
Chinnaiah
Jeyabharathi
ac,
Josef C.
Meier
a,
Alexander
Kostka
a,
Kanala L.
Phani
c,
Aleksander
Rečnik
d,
Marjan
Bele
b,
Stanko
Hočevar
b,
Miran
Gaberšček
*a and
Karl J. J.
Mayrhofer
*a
aMax-Planck-Institut für Eisenforschung GmbH, Max-Planck Str. 1, 40237 Düsseldorf, Germany. E-mail: hodnik@mpie.de; mayrhofer@mpie.de; Fax: +49 211 6792 218; Tel: +49 211 6792 160
bNational Institute of Chemistry, Hajdrihova 19, 1000 Ljubljana, Slovenia. E-mail: miran.gaberscek@ki.si; Fax: +386 1 4760 300; Tel: +386 1 4760 320
cCSIR-Central Electrochemical Research Institute, Karaikudi 630 006, Tamil Nadu, India
dDepartment for Nanostructured Materials, Jožef Stefan Institute, Ljubljana, 1000, Slovenia
First published on 10th April 2014
Abstract
In this study the performance enhancement effect of structural ordering for the oxygen reduction reaction (ORR) is systematically studied. Two samples of PtCu3 nanoparticles embedded on a graphitic carbon support are carefully prepared with identical initial composition, particle dispersion and size distribution, yet with different degrees of structural ordering. Thus we can eliminate all coinciding effects and unambiguously relate the improved activity of the ORR and more importantly the enhanced stability to the ordered nanostructure. Interestingly, the electrochemically induced morphological changes are common to both ordered and disordered samples. The observed effect could have a groundbreaking impact on the future directions in the rational design of active and stable platinum alloyed ORR catalysts.
Introduction
The oxygen reduction reaction (ORR) is the essential process in low- to medium-temperature polymer electrolyte membrane fuel cells. In contrast to its anodic counterpart, i.e., the hydrogen oxidation reaction, the electrocatalysis of this cathodic reaction suffers from large overpotentials and thus limits the overall performance of the cell. Researchers across the globe are therefore investing much effort to develop both active and durable industrial electrocatalysts beyond the so far state-of-the-art Pt/C material, besides trying to reduce or even eliminate the noble metal content.1,2 However, non-noble metal or metal-free catalysts still have low mass activity and poor stability under the harsh operating conditions in fuel cells. Pt based alloy electrodes have shown promising mass activities 2–5 times higher than pure Pt, while at the same time reducing the noble metal content.2 This enhancement is due to lower adsorption energies of blocking hydroxyl species (OHad), yielding higher number of active sites available for the ORR at comparable overpotentials.3–10 This holds even after removal of the transition metal from the catalyst surface and formation of a Pt rich shell, as the several times higher activity11 is retained due to the electronic (ligand effect) and geometric (strain effect) influence of the alloying element inside the core.7,12,13 Upon selective leaching of the non-noble transition metal, either naturally under operating conditions or intentionally as a pretreatment, several special structures have been obtained, such as, for instance, the Pt-skeleton shell/alloy-core,14 Pt-skin shell/alloy core,15 strained Pt shell/alloy-core,7 strained Pt shell/multi-core16 and “Swiss cheese” type porous particles.17 Thereby, the obtained structure depends on several parameters, such as the synthesis conditions, the initial composition5,13 and the size of the alloyed material,8,13,18–20 as well as on the type of dealloying protocol used, e.g. chemical or electrochemical.6,9 An important parameter that seems to have a significant impact on the final properties of electrochemically treated Pt-alloys is the effect of structural ordering, as shown for the ORR activity in PtCu,9,17,21 PtFe22,23 and PtCo24–26 systems. The stability of the so-called intermetallic Pt-alloys, in contrast to disordered structures or solid solutions, is however poorly understood. One reason is that the impact of structural ordering is difficult to differentiate from other effects, such as varying composition and particle size distribution31 resulting from different synthesis and pretreatment conditions, especially during annealing.24–26 In this study we eliminate all these coinciding effects and unambiguously demonstrate an improved activity and even more importantly an enhanced stability of a partially ordered catalyst, exemplified by PtCu3.Experimental
PtCu3 alloy nanoparticles supported on a commercially available graphite support (Vulcan XC72R) were synthesized by a modified sol–gel method, and alloying of Pt with Cu was achieved by thermal annealing (above 700 °C) as described in the patent literature.19,27 The catalyst composite contains 23.8 wt% Cu and 25.5 wt% Pt. The partially ordered analogue consisting of a combination of ordered (Pm![[3 with combining macron]](https://www.rsc.org/images/entities/char_0033_0304.gif) m) and disordered (Fm
m) and disordered (Fm![[3 with combining macron]](https://www.rsc.org/images/entities/char_0033_0304.gif) m) structures was obtained by setting the temperature below the order–disorder transition temperature (∼550 °C) so that the system attained thermodynamic equilibrium. By contrast, a completely disordered PtCu3 analogue (s.s.; Fm
m) structures was obtained by setting the temperature below the order–disorder transition temperature (∼550 °C) so that the system attained thermodynamic equilibrium. By contrast, a completely disordered PtCu3 analogue (s.s.; Fm![[3 with combining macron]](https://www.rsc.org/images/entities/char_0033_0304.gif) m structure) was obtained from the partially ordered material by heating to 700 °C, above the disorder–order transition temperature, and quenching in liquid nitrogen.
m structure) was obtained from the partially ordered material by heating to 700 °C, above the disorder–order transition temperature, and quenching in liquid nitrogen.
Results and discussion
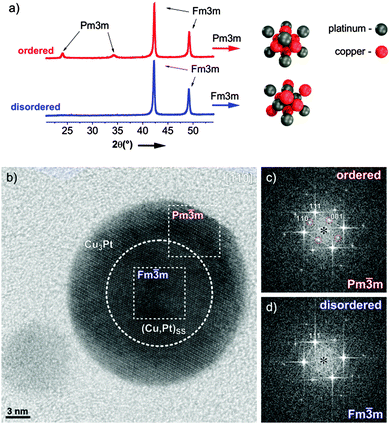
An exemplary study of a single PtCu3 particle was performed using HR-TEM and XRD patterns are shown in Fig. 1a; a more detailed structural analysis of both analogues is given in ESI,† S1. The partially ordered material consists of a rather thick, ordered (Pm![[3 with combining macron]](https://www.rsc.org/images/entities/char_0033_0304.gif) m) shell (Fig. 1c) around a predominantly disordered (Fm
m) shell (Fig. 1c) around a predominantly disordered (Fm![[3 with combining macron]](https://www.rsc.org/images/entities/char_0033_0304.gif) m) core (Fig. 1d). Despite the fact that no complete ordering of the entire nanoparticle is achieved, the material can still be considered as an “ordered material” for catalysis, where surface properties are decisive. In contrast, the structure of the quenched sample is found completely “disordered” with only pure Fm
m) core (Fig. 1d). Despite the fact that no complete ordering of the entire nanoparticle is achieved, the material can still be considered as an “ordered material” for catalysis, where surface properties are decisive. In contrast, the structure of the quenched sample is found completely “disordered” with only pure Fm![[3 with combining macron]](https://www.rsc.org/images/entities/char_0033_0304.gif) m reflections within the nanoparticles. Except for these crucial differences in the surface structure, both catalysts are embedded in the same type of carbon support and exhibit identical particle size distributions as well as composition.
m reflections within the nanoparticles. Except for these crucial differences in the surface structure, both catalysts are embedded in the same type of carbon support and exhibit identical particle size distributions as well as composition.
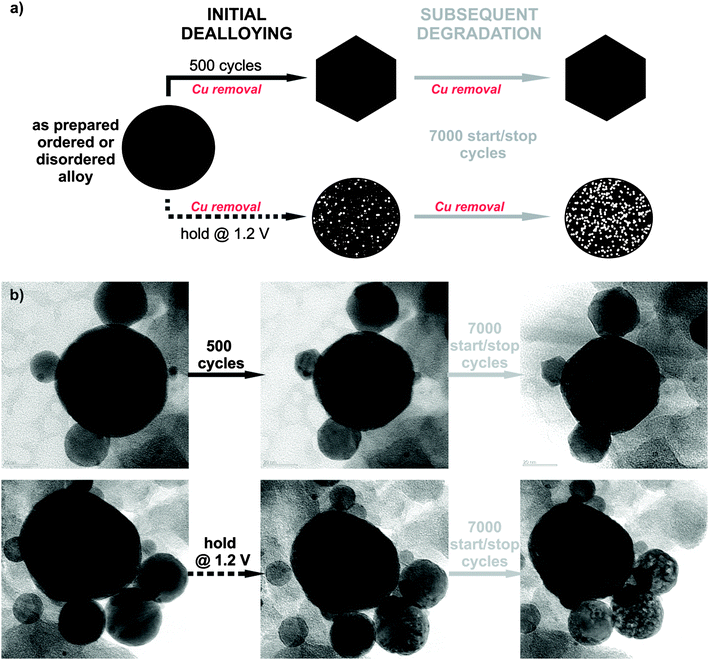
To study the electrochemical stability of ordered and disordered nanoparticles, both samples were subjected to identical treatments, as shown in Fig. 2. Initial dealloying consisted of either 500 potential cycles from 0.05 to 1.2 VRHE (0.2 V s−1) or application of a constant potential at 1.2 VRHE for 2 hours (the time equivalent to 500 cycles), both followed by a subsequent degradation protocol of 7000 cycles (see schematic of experiments in Fig. 2a). Thereby the surface area was continuously monitored over time, and after each individual treatment the ORR activity was also measured. The microstructural changes that occurred during different electrochemical treatments were investigated by identical location transmission microscopy (IL-TEM), and the impact of the degradation protocol on this type of catalyst has been reported.8 Here, these results are further analyzed for a comparison between the behavior of the ordered and disordered analogues. Interestingly, despite the structural differences in the two samples, the morphological investigation before, during and after the electrochemical treatments reveal the same main patterns and trends for degradation in both samples (Fig. 2b). So, for example, the quite wide, identical particle size distribution between 5 and 50 nm (see ESI,† S2.1) for both samples does not change essentially during the electrochemical treatment. Although, the catalyst particles of ∼10–20 nm size changed their shape to faceted structures during the initial 500 potential cycles (for more images and IL-tomography, see ESI,† S2.2 and S2.4 or link to the movie), porosity was observed only after holding the potential at 1.2 VRHE, whereas in the larger particles a gradual development of porosity with degradation time is observed in both samples.
Finally, in the light of the so-called proximity effect described in the recent paper of Nesselberger et al.,28 no significant differences in the average distance between the particles were observed. Namely, the temperature treatment of both samples differs only in the last post-treatment stage, where the nanoparticles have already achieved their final state on the carbon matrix (see ESI,† S2.3). If there is any effect of proximity it is identical for both catalysts.
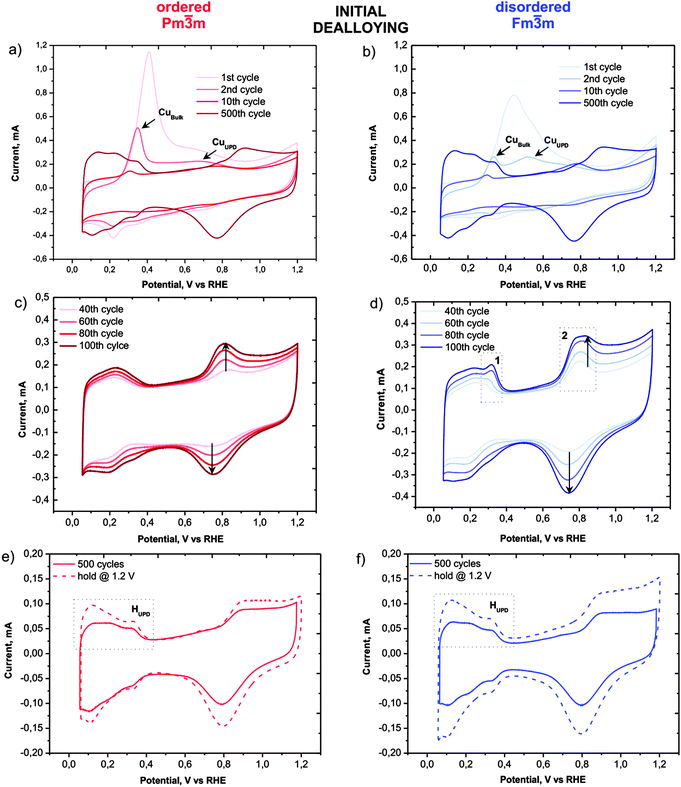
Despite the obvious congruency in the evolution of the microstructure, certain remarkable differences in the development of the electrochemical behaviour of the ordered and disordered samples appear in the cyclic voltammograms (Fig. 3). The copper dissolution from the alloy, as represented by two peaks, denoted CuBulk and CuUPD in Fig. 3a and b, appear at about 0.4 V and span up to 0.9 V. The CuBulk dissolution, which reflects the dissolution of copper that is coordinated mainly to other copper atoms in the alloy, is more or less common to both samples. However, the position and shape of the CuUPD peak/shoulder that represents dissolution of various Pt-coordinated Cu atoms (also denoted underpotential deposition – UPD) are quite different.29,30 The peak potential is shifted by approximately 250 mV more positive for the ordered material, due to the increased statistical probability of copper atoms being coordinated to platinum. Moreover, in the HUPD and the initial Pt oxidation region of the disordered catalyst (marked as 1 and 2 in Fig. 3d, respectively), additional “Cu oxidation” peaks seem to emerge. Considering that the surface prior to the 40th cycle is free from Cu oxidation and the HUPD has already started to evolve, this might be explained by the additional Cu from beneath the surface becoming exposed and finally dissolved. Another explanation could be the formation of some new metastable surface Pt facet which after 100 cycles starts to disappear gradually (see Fig. S3, ESI†). In contrast, the transition from a Cu-rich phase to a Cu-deprived phase is smooth in the ordered catalyst, i.e. after the removal of all surface Cu, a well-defined cyclic voltammogram for Pt continuously emerges indicating a quicker formation of a protective Pt shell. Notably, regardless of these differences, after about 500 cycles the CVs of both materials attain a pure Pt signature with typical HUPD and Pt-oxidation features and identical surface areas. It is interesting that a similar, pure Pt-like CV is also obtained after dealloying by potential hold for 2 hours at 1.2 VRHE (Fig. 3e and f). However, after cycling treatment three H-oxidation–reduction peaks can be observed, while after potential hold treatment these peaks overlap and are less defined. This can be explained by the formation of shaped nanoparticles in the cycling treatment, whereas in the potential hold experiment the initial shape is more or less preserved (see Fig. 2).8
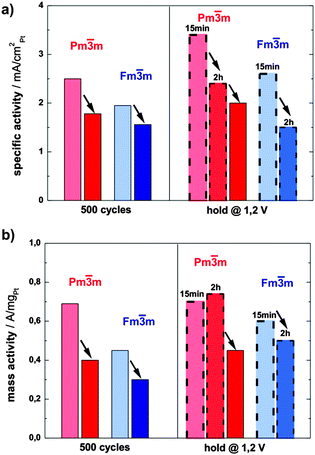
The activity of both catalysts towards ORR has been determined by voltammetry after each electrochemical treatment using a rotating disk electrode (RDE, see ESI,† S3 for more details). The specific activity (SA) of the ordered catalyst is significantly and consistently higher than the SA of its disordered analogue at all states (see the bar chart in Fig. 4a). For example, after the initial 500 potential cycles the activity of the ordered catalyst is 2.5 mA cm−2Pt, whereas the disordered catalyst exhibits an activity of 1.78 mA cm−2Pt. An even greater difference, i.e. 2.4 mA cm−2Ptvs. 1.5 mA cm−2Pt, can be observed after the potential hold treatment (2 h at 1.2 V), the full comparison of activity at all conditions studied is provided in ESI,† Tables S3.1 and S3.2.
Moreover, the mass activity (MA) of the ordered phase is also significantly higher than that of the disordered one, but follows the same declining trend as the absolute surface area over time (Fig. 4b). Only the mass activity of the ordered catalyst after 2 hours of hold is somewhat higher than after 15 min, which is due to the increase in ECSA by the porosity formation.
The significantly higher specific activity of the ordered phase could have several origins. Firstly, after a typical electrochemical treatment the ordered phase is able to retain more copper than the disordered one. This hypothesis, which stems from the cyclic voltammograms, is confirmed by post-mortem ICP-MS analysis of the electrolyte after various electrochemical treatments: the amount of Cu leached out of the alloy is always higher in the case of the disordered catalyst. Therefore all data on the disordered sample with comparable treatment are shifted to higher values of removed copper as seen in Fig. 5. Specifically, after the initial 500 potential cycles 56% of copper is removed from the ordered catalyst, whereas as much as 73% of Cu is removed from the disordered one. Similarly, after a potential hold treatment (2 h at 1.2 V) the ordered catalyst loses about 80% of the initial copper, while the loss in the disordered phase is close to 90%. For more details, see Table S4 in the ESI,† where all the ICP-MS experimental data are summarized. It should be noted that the platinum content in the electrolyte is always below 0.1%. The difference in the electrochemical stability of Cu in the two alloys studied can be correlated with the unequal surface structure, since the number of Cu–Cu and Pt–Cu bonds per unit cell of the pristine ordered and disordered catalysts varies. In the ordered phase there are statistically 24 Cu–Cu bonds and 24 Pt–Cu bonds, while in the disordered structure there are 27 Cu–Cu, 18 Pt–Cu, and 3 Pt–Pt bonds per unit cell on average. As the potential for Cu dissolution from a copper substrate is much lower than from platinum (0.34 V < 0.7 V),18,29 the higher number of stronger Pt–Cu bonds in the ordered phase results in less Cu leaching. In turn, more residual Cu in the ordered alloy nanoparticles leads to an activity increase due to an enhanced ligand and/or strain effect. The effect of “copper retention” on alloy activity is reflected by an activity increase due to a horizontal shift along the x-axis denoted as a “ligand/strain effect”.
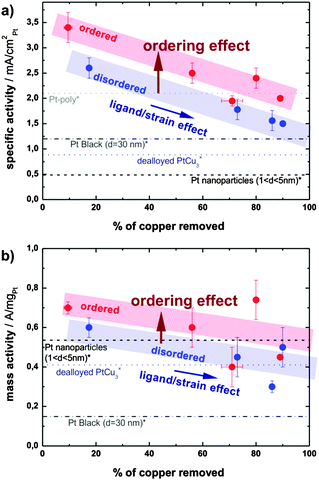 | ||
| Fig. 5 (a) Specific activity and (b) mass activity in relation to the copper content of the electrolyte upon different electrochemical treatments (dealloying and subsequent degradation). Activities of Pt-poly, Pt-black, dealloyed PtCu3 and Pt nanoparticles are taken from references (*)32 and (×).18 | ||
Obviously, as seen in Fig. 5, the larger quantity of residual copper is not the only source of the activity enhancement. A remarkable increase in the activity remains when comparing the ordered and disordered alloys with the hypothetically same amount of residual copper, as indicated by the vertical shift denoted as the “ordering effect” in Fig. 5. A similar effect of structural ordering on activity has been observed recently in selected other alloys, PtCu,9,17,21 PtFe,22,23 or PtCo.24–26 The underlying mechanism is however still unclear. One possibility is that structural ordering changes the lateral strain in the Pt-skin overlayer and hence changes the binding energies of adsorbates.7 Another possibility is that dealloying from the ordered structure results in a skin type rather than skeleton type morphology and affects the structural sensitive ORR.14,15,31 Regardless of the exact mechanism, the present experimental results demonstrate clearly the positive effect of structural ordering on the activity of selected alloy throughout the prolonged testing in different electrochemical regimes, and independent of other material parameters influenced by synthesis and pretreatment conditions.
Conclusions
Based on a comparison of carefully prepared samples we have shown the significant, systematic effect of structural ordering on activity and stability of PtCu3 nanoparticles. Two catalysts exhibit identical initial bulk composition, particle dispersion and size distribution, with the only difference being the degree of structural order induced by different thermal annealing. As expected, the activity of both alloys decreases with the increase in time of exposure to harsh electrochemical treatment conditions. However, regardless of the degradation/dealloying treatment, the partially ordered structure (Pm![[3 with combining macron]](https://www.rsc.org/images/entities/char_0033_0304.gif) m) contains significantly higher (20–30%) specific activity compared to the fully disordered sample. At least two effects lead to the improved performance of the ordered catalyst: (1) a better retention of copper inside the ordered structure after a given treatment and (2) an intrinsic structural effect on the alloy activity. The latter could be due to modified lateral strain in the Pt skin7 overlayer and/or due to the different morphology of the de-alloyed material.14
m) contains significantly higher (20–30%) specific activity compared to the fully disordered sample. At least two effects lead to the improved performance of the ordered catalyst: (1) a better retention of copper inside the ordered structure after a given treatment and (2) an intrinsic structural effect on the alloy activity. The latter could be due to modified lateral strain in the Pt skin7 overlayer and/or due to the different morphology of the de-alloyed material.14
Acknowledgements
The work was financed in part by the Slovenian Centre of Excellence Low Carbon Technologies (CO NOT). We would also like to thank Andrea Mingers, Milena Zorko and Barbara Jozinović for their assistance and the professional graphic designer Jaka Birsa for his help with TOC. C.J. thanks the DAAD (Germany) for a Sandwich Model Fellowship and CSIR (India) for support.Notes and references
- A. Rabis, P. Rodriguez and T. J. Schmidt, ACS Catal., 2012, 2, 864–890 CrossRef CAS.
- M. K. Debe, Nature, 2012, 486, 43–51 CrossRef CAS PubMed.
- S. Mukerjee, S. Srinivasan, M. P. Soriaga and J. McBreen, J. Electrochem. Soc., 1995, 142, 1409–1422 CrossRef CAS PubMed.
- V. R. Stamenkovic, B. Fowler, B. S. Mun, G. Wang, P. N. Ross, C. A. Lucas and N. M. Marković, Science, 2007, 315, 493–497 CrossRef CAS PubMed.
- L. Gan, M. Heggen, S. Rudi and P. Strasser, Nano Lett., 2012, 12, 5423–5430 CrossRef CAS PubMed.
- L. Gan, M. Heggen, R. O'Malley, B. Theobald and P. Strasser, Nano Lett., 2013, 13, 1131–1138 CrossRef CAS PubMed.
- P. Strasser, S. Koh, T. Anniyev, J. Greeley, K. More, C. Yu, Z. Liu, S. Kaya, D. Nordlund, H. Ogasawara, M. F. Toney and A. Nilsson, Nat. Chem., 2010, 2, 454–460 CrossRef CAS PubMed.
- C. Jeyabharathi, N. Hodnik, C. Baldizzone, J. C. Meier, M. Heggen, K. L. N. Phani, M. Bele, M. Zorko, S. Hocevar and K. J. J. Mayrhofer, ChemCatChem, 2013, 5, 2627–2635 CrossRef CAS.
- D. Wang, Y. Yu, H. L. Xin, R. Hovden, P. Ercius, J. A. Mundy, H. Chen, J. H. Richard, D. A. Muller, F. J. DiSalvo and H. D. Abruña, Nano Lett., 2012, 12, 5230–5238 CrossRef CAS PubMed.
- N. Hodnik, M. Bele and S. Hočevar, Electrochem. Commun., 2012, 23, 125–128 CrossRef CAS PubMed.
- R. Srivastava, P. Mani, N. Hahn and P. Strasser, Angew. Chem., Int. Ed., 2007, 46, 8988–8991 CrossRef PubMed.
- J. Greeley, I. E. Stephens, A. S. Bondarenko, T. P. Johansson, H. A. Hansen, T. F. Jaramillo, J. Rossmeisl, I. Chorkendorff and J. K. Nørskov, Nat. Chem., 2009, 1, 552–556 CrossRef CAS PubMed.
- J. Snyder, I. McCue, K. Livi and J. Erlebacher, J. Am. Chem. Soc., 2012, 134, 8633–8645 CrossRef CAS PubMed.
- V. R. Stamenkovic, B. S. Mun, M. Arenz, K. J. J. Mayrhofer, C. A. Lucas, G. Wang, P. N. Ross and N. M. Markovic, Nat. Mater., 2007, 6, 241–247 CrossRef CAS PubMed.
- C. Wang, M. Chi, D. Li, D. Strmcnik, D. van der Vliet, G. Wang, V. Komanicky, K. C. Chang, A. P. Paulikas, D. Tripkovic, J. Pearson, K. L. More, N. M. Markovic and V. R. Stamenkovic, J. Am. Chem. Soc., 2011, 133, 14396–14403 CrossRef CAS PubMed.
- M. Heggen, M. Oezaslan, L. Houben and P. Strasser, J. Phys. Chem. C, 2012, 116, 19073–19083 CAS.
- I. Dutta, M. K. Carpenter, M. P. Balogh, J. M. Ziegelbauer, T. E. Moylan, M. H. Atwan and N. P. Irish, J. Phys. Chem. C, 2010, 114, 16309–16320 CAS.
- M. Oezaslan, M. Heggen and P. Strasser, J. Am. Chem. Soc., 2011, 134, 514–524 CrossRef PubMed.
- N. Hodnik, M. Zorko, M. Bele, S. Hočevar and M. Gaberšček, J. Phys. Chem. C, 2012, 116, 21326–21333 CAS.
- I. McCue, J. Snyder, X. Li, Q. Chen, K. Sieradzki and J. Erlebacher, Phys. Rev. Lett., 2012, 108, 225503 CrossRef CAS.
- N. Hodnik, M. Bele, A. Rečnik, N. Z. Logar, M. Gaberšček and S. Hočevar, Energy Procedia, 2012, 29, 208–215 CrossRef CAS PubMed.
- H. Chen, D. Wang, Y. Yu, K. A. Newton, D. A. Muller, H. Abruña and F. J. DiSalvo, J. Am. Chem. Soc., 2012, 134, 18453–18459 CrossRef CAS PubMed.
- J. Kim, Y. Lee and S. Sun, J. Am. Chem. Soc., 2010, 132, 4996–4997 CrossRef CAS PubMed.
- D. Wang, H. L. Xin, R. Hovden, H. Wang, Y. Yu, D. A. Muller, F. J. DiSalvo and H. D. Abruña, Nat. Mater., 2013, 12, 81–87 CrossRef CAS PubMed.
- M. Watanabe, K. Tsurumi, T. Mizukami, T. Nakamura and P. Stonehart, J. Electrochem. Soc., 1994, 141, 2659–2668 CrossRef CAS PubMed.
- S. Koh, M. F. Toney and P. Strasser, Electrochim. Acta, 2007, 52, 2765–2774 CrossRef CAS PubMed.
- M. Bele, M. Gaberšček, G. Kapun, N. Hodnik and S. Hočevar, Electrocatalytic Composite(s), Associated Composition(s) and Associated Process(es): Patentna Prijava: US Appln, United States Patent and Trademark Office, 2011.
- M. Nesselberger, M. Roefzaad, R. Fayçal Hamou, P. Ulrich Biedermann, F. F. Schweinberger, S. Kunz, K. Schloegl, G. K. H. Wiberg, S. Ashton, U. Heiz, K. J. J. Mayrhofer and M. Arenz, Nat. Mater., 2013, 12, 919–924 CrossRef CAS PubMed.
- P. Strasser, S. Koh and J. Greeley, Phys. Chem. Chem. Phys., 2008, 10, 3670–3683 RSC.
- D. M. Kolb, M. Przasnyski and H. Gerischer, J. Electroanal. Chem. Interfacial Electrochem., 1974, 54, 25–38 CrossRef CAS.
- D. F. van der Vliet, C. Wang, D. Tripkovic, D. Strmcnik, X. F. Zhang, M. K. Debe, R. T. Atanasoski, N. M. Markovic and V. R. Stamenkovic, Nat. Mater., 2012, 11, 1051–1058 CAS.
- M. Nesselberger, S. Ashton, J. C. Meier, I. Katsounaros, K. J. J. Mayrhofer and M. Arenz, J. Am. Chem. Soc., 2011, 133, 17428–17433 CrossRef CAS PubMed.
Footnote |
| † Electronic supplementary information (ESI) available: Description of structural, electrochemical, ICP-MS and IL-TEM characterization methods and experimental conditions. Dealloying cyclovoltammograms (500 cycles), ORR polarisation curves and SEM pictures of ordered and disordered catalysts. IL-TEM, IL-tomography movie and TEM images of ordered catalysts. 3 tables with ORR activities (mass and specific) and ECSA measured after all electrochemical treatments together with copper content data. See DOI: 10.1039/c4cp00585f |
| This journal is © the Owner Societies 2014 |

