 Open Access Article
Speciation, physical and electrolytic properties of eutectic mixtures based on CrCl3·6H2O and urea
Andrew P.
Abbott
*a,
Azeez A.
Al-Barzinjy
ab,
Paul D.
Abbott
a,
Gero
Frisch
c,
Robert C.
Harris
a,
Jennifer
Hartley
c and
Karl S.
Ryder
a
aChemistry Department, University of Leicester, Leicester, UK LE1 7RH. E-mail: Andrew.abbott@le.ac.uk; Fax: +44 (0)116 252 3789
bPhysics Department, University of Salahaddin, Arbil, Iraq
cInstitut für Anorganische Chemie, TU Bergakademie Freiberg, Leipziger Str. 29, 09596 Freiberg, Germany
First published on 26th March 2014
Abstract
The electrodeposition of chromium is a technologically vital process, which is principally carried out using aqueous chromic acid. In the current study, it is shown that eutectic mixtures of urea and hydrated chromium(III) chloride provide a liquid which reduces the toxicological issues associated with the current aqueous Cr(VI) electroplating solution. Using EXAFS, mass spectrometry and UV-Vis spectroscopy, it is shown that chromium is present predominantly as a cationic species. Conductivities are higher than for most comparable ionic liquids. It is shown that the electrodeposition of chromium is electrochemically reversible, with a current efficiency much higher than in aqueous electrolytes. Surface tension and density measurements indicate that hole theory is a valid model to describe transport properties in these liquids. Bulk Cr deposits are not macrocrystalline but they are generally crack-free. The deposits have a hardness of 600 ± 10 Vickers and, as such, are comparable to deposits from aqueous systems.
1. Introduction
The electrodeposition of corrosion- and wear-resistant coatings is an extremely important manufacturing process, particularly in the automotive and aerospace sectors. The main metals of interest are chromium, cobalt and nickel and, although these coatings have been studied in detail, toxicological issues remain about the precursor solutions from which the metals are deposited. One of the most important of these is the electrodeposition of chromium, which has classically been achieved using aqueous chromic acid.1An alternative to metal electrodeposition from aqueous solutions is through the use of ionic liquids. The electroreduction of most metals has been studied using a range of ionic liquids and novel deposit architectures have been demonstrated.2 So far, the main focus of the current research has been on metals and semiconductors which cannot be electrodeposited from water, e.g. aluminium,3 silicon,4 and very few studies have been carried out on other important metals, such as chromium.5 However, the difference in the electrochemical behaviour of metals in ionic liquids compared to traditional aqueous electrolytes presents the prospect of using new, and potentially less toxic, precursors for electrodeposition, e.g. replacing hexavalent chromium with CrCl3·6H2O.6–8
In addition to ionic liquids with discrete anions, the electrodeposition of a range of metals has been previously carried out in deep eutectic solvents (DESs).5 These comprise of quaternary ammonium salts (e.g. choline chloride, ChCl), metal salts or metal salt hydrates and hydrogen bond donors (e.g. urea) and are commonly divided into four groups (Table 1), and have been particularly successful on a large scale for metal polishing9,10 and immersion silver deposition.11,12
| Type 1 | Quaternary ammonium salt + metal chloride |
| Type 2 | Quaternary ammonium salt + metal chloride hydrate |
| Type 3 | Quaternary ammonium salt + hydrogen bond donor |
| Type 4 | Metal chloride hydrate + hydrogen bond donor |
While most ionic liquids and DESs include a quaternary ammonium ion as the cationic component, it has recently been shown that eutectics can also be formed between a metal salt (hydrate) and a simple amide or alcohol to form a metal-containing solution composed of cations and anions via disproportionation processes13e.g.
2AlCl3 + urea ![[left over right harpoons]](https://www.rsc.org/images/entities/char_21cb.gif) [AlCl2·urea]+ + [AlCl4]− [AlCl2·urea]+ + [AlCl4]− |
These so called Type 4 eutectics are useful as they produce cationic metal complexes, ensuring that the double layer close to the electrode surface has a high metal ion concentration. An analogous approach was used by Binnemans, who complexed Cu((CF3SO2)2N)2 with acetonitrile, to form the complex cation [Cu(CH3CN)4]2+.14 In previous research, chromium deposition has been demonstrated from a Type 2 DES system, composed of ChCl and CrCl3·6H2O in a 1![[thin space (1/6-em)]](https://www.rsc.org/images/entities/char_2009.gif) :
:![[thin space (1/6-em)]](https://www.rsc.org/images/entities/char_2009.gif) 2 molar ratio.15,16 Amorphous crack-free chromium deposits were obtained, although they were relatively soft and could easily be removed during wear testing.
2 molar ratio.15,16 Amorphous crack-free chromium deposits were obtained, although they were relatively soft and could easily be removed during wear testing.
In the current study we have taken mixtures of CrCl3·6H2O with urea (Type 4 DES) and compared them to the analogous mixtures of CrCl3·6H2O with ChCl (Type 2 DES). Physical properties, such as phase behaviour, viscosity, conductivity, density and surface tension have been determined. It has been identified through the use of extended X-ray absorption fine structure, EXAFS that cationic chromium complexes are formed in solution, whereas the Type 2 DES also forms anionic metal complexes. Finally, these properties will be applied to the electrodeposition behaviour of chromium, along with an examination of the hardness of these deposits.
2. Experimental procedures
Chromium chloride (CrCl3·6H2O, Aldrich, ≥99%), choline chloride (Aldrich, >98%) and urea (Aldrich, >98%) were used as-received. The DESs were formed by mixing the two components together and heating, with stirring, at 60 °C until a homogeneous green-coloured liquid had formed.Melting points were determined using a Mettler Toledo DSC1 differential scanning calorimeter (DSC). The mixtures were cooled to −70 °C and heated up to 70 °C at 10 °C min−1 for two cycles. The thermogram exhibited a typical sharp endo-thermic peak corresponding to the melting point of the compositions. Viscosity measurements were obtained as function of temperature using a Brookfield DV-E Viscometer (Brookfield Instruments, USA) fitted with a temperature probe. The conductivity of the liquids was measured as function of temperature using a Jenway 4510 conductivity meter fitted with an inherent temperature probe (cell constant = 1.01 cm−1). Surface tension and density measurements were obtained using a Krüss K9-tensiometer with a platinum plate, fitted with a thermostated water jacket to control the temperature. Each composition was analysed in triplicate and the average value is reported.
Cyclic voltammetry investigations were carried out using an Autolab/PGSTAT12 potentiostat controlled with GPES2 software. A three-electrode system was used, consisting of a platinum working-electrode (0.12 cm2 area), a platinum flag counter-electrode and a silver wire pseudo-reference electrode. The working electrode was polished with 0.05 μm γ-alumina paste and cleaned by rinsing with deionised water and acetone prior to each experiment. All cyclic voltammograms were recorded at 40 °C and at a scan rate of 20 mV s−1.
An electrochemical quartz crystal microbalance consisting of an Agilent HPE5061A network analyser with a 10 MHz AT-cut gold quartz crystal (International Crystal Manufacturing Co., Oklahoma City, USA) was used. A three-electrode compartment cell was constructed from PTFE, with an unpolished gold coated crystal working electrode, a silver wire reference electrode and a Pt flag counter electrode. The electrodes were connected to a potentiostat (Autolab 263A) in order to record voltammetric data. The quartz crystal had a piezoelectrically active area of 0.23 cm2.
Deposition experiments were carried out in a 33 mL Hull cell. The cathodic plate (mild steel, 50 mm × 42 mm × 1 mm) was mechanically polished and cleaned with acetone and rinsed with water. An iridium oxide-coated titanium mesh electrode, 40 mm × 50 mm, was used as an anode and degreased with acetone before being placed into the Hull cell. In all of the experiments the solution temperature was 40 °C, with a constant cell voltage of 4 V. Experiments were carried out over a period of 2 hours, after which the substrates were removed from the Hull cell and washed with water and acetone.
The surface morphology was characterised using scanning electron microscopy (SEM) and elemental analysis of the deposit compositions was carried out by energy dispersive X-ray spectroscopy (EDX), using a Phillips XL30 ESEM instrument with an accelerating voltage between 15 and 20 keV, giving an average beam current of ca. 120 μA.
A Shimadzu UV-1601 Spectrophotometer was used to record the electronic absorption spectra of the different solution compositions in the visible spectrum. Since diluting the sample may change the metal speciation, neat samples of ionic liquids were used as a thin film between two quartz plates.
The hardness of electrodeposits was evaluated as resistance to indentation for chromium deposits on mild steel with a Mitutoyo model MVK-G100 hardness meter. The specimens were indented using different forces (0.1 to 0.5 kgf) and a loading rate of 0.1 mm s−1 for 10 s. The Vickers number is the number obtained by dividing the kg-force load by the square area of indentation of a standard probe.
Fast atomic bombardment mass spectrometry (FAB-MS) was carried out in order to understand the behaviour of the eutectics and to complement spectroscopic data on speciation. A KRATOS Concept IIH Mass spectrometer was used with Xe gas at 7 to 8 kV.
The Cr-speciation in the liquid phase of these eutectics was determined by extended X-ray absorption fine structure (EXAFS) at the SpLine beamline (BM25A) of the ESRF synchrotron (Grenoble). Measurements were carried out at the Cr K-edge, nominally 5989 eV, in transmission mode, using a Si(111) monochromator and ionisation chamber detectors. Liquid samples were sandwiched between two strips of polycarbonate, with plastic gaskets between 20 and 200 μm in thickness, such that an edge step between 0.5 and 1.5 was achieved. Solid reference samples for amplitude calibration were made of CrCl3 and CrCl3·6H2O by grinding these salts with cellulose powder and pressing them into tablets. Two spectra were recorded for every sample, then averaged, calibrated and background subtracted with the program Athena.17 The EXAFS spectra were fitted with EXCURV9818 to calculate interatomic distances and their root mean square variation (σ2). Electron scattering parameters were calculated to determine type and number of coordinating atoms using the Hedin–Lundqvist potential.19 Quoted uncertainties on fitted parameters are equal to two standard deviations.
3. Results and discussion
Phase behaviour
Fig. 1 shows the melting points of urea:CrCl3·6H2O mixtures as a function of composition and it can be seen that the eutectic is formed at a composition of 1![[thin space (1/6-em)]](https://www.rsc.org/images/entities/char_2009.gif) :
:![[thin space (1/6-em)]](https://www.rsc.org/images/entities/char_2009.gif) 2 urea
2 urea![[thin space (1/6-em)]](https://www.rsc.org/images/entities/char_2009.gif) :
:![[thin space (1/6-em)]](https://www.rsc.org/images/entities/char_2009.gif) CrCl3·6H2O. The melting points of mixtures of urea and CrCl3·6H2O are always lower than either melting point of the pure components (urea: 407 K (134 °C); CrCl3·6H2O: 356 K (83 °C)). The melting temperature of the eutectic composition is ca. 9 °C, producing a melting point depression of 91 °C, with respect to the weighted average of the pure components. Fig. 1 also shows the analogous Type 2 DES, composed of choline chloride and CrCl3·6H2O, and it should be noted that the melting points of the Type 4 DES are generally slightly lower although the trends are very similar.16 Interestingly, the eutectic compositions for both Type 4 and Type 2 DES occurred at the same composition with a 0.67 mole fraction chromium salt. Analogous anhydrous eutectics formed from urea and ZnCl2 were shown to have a eutectic composition at 0.22 mole fraction ZnCl2 with a melting point of 282 K (9 °C) and a depression of melting point of 150 °C with respect to the urea and ZnCl2.20 In the ZnCl2 case the speciation is known to be [ZnCl·2urea]+[ZnCl3]− and the markedly different eutectic point suggests that disproportionation is not the mechanism by which these chromium DESs conduct charge.
CrCl3·6H2O. The melting points of mixtures of urea and CrCl3·6H2O are always lower than either melting point of the pure components (urea: 407 K (134 °C); CrCl3·6H2O: 356 K (83 °C)). The melting temperature of the eutectic composition is ca. 9 °C, producing a melting point depression of 91 °C, with respect to the weighted average of the pure components. Fig. 1 also shows the analogous Type 2 DES, composed of choline chloride and CrCl3·6H2O, and it should be noted that the melting points of the Type 4 DES are generally slightly lower although the trends are very similar.16 Interestingly, the eutectic compositions for both Type 4 and Type 2 DES occurred at the same composition with a 0.67 mole fraction chromium salt. Analogous anhydrous eutectics formed from urea and ZnCl2 were shown to have a eutectic composition at 0.22 mole fraction ZnCl2 with a melting point of 282 K (9 °C) and a depression of melting point of 150 °C with respect to the urea and ZnCl2.20 In the ZnCl2 case the speciation is known to be [ZnCl·2urea]+[ZnCl3]− and the markedly different eutectic point suggests that disproportionation is not the mechanism by which these chromium DESs conduct charge.
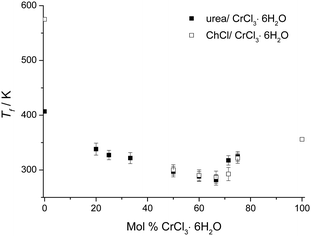 | ||
| Fig. 1 Melting points of urea:CrCl3·6H2O as a function of composition together with those for the ChCl:CrCl3·6H2O system for comparison. | ||
In all cases, the original reduction in the melting points up to the eutectic compositions is caused not only by the interaction between the components, but also the formation of the complex ions that are the basis of the DES. At the eutectic composition, the species have the smallest degree of interaction between the cation and anion and thus the lowest melting point. DSC shows that all compositions lose water above 353 K (80 °C) and a visual change in colour from dark green to dark purple is observed. According to thermogravimetry studies on the Type 2 liquid, the system released 3 hydrate water molecules at about 358 K (85 °C), and another 3 at about 453 K (180 °C).4 This indicates a change in speciation and may be important for future applications. Around 323 K (50 °C) the liquids can be utilized in an open atmosphere without considerable change in the liquid composition because the water concentration in the liquid remains approximately unaltered.
Viscosity
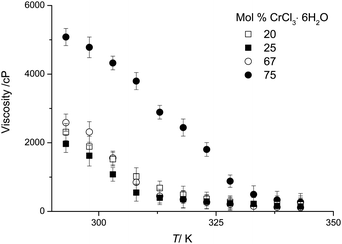
DESs are relatively viscous compared with molecular liquids.21Fig. 2 shows the viscosity of urea:CrCl3·6H2O mixtures as a function of temperature and composition. Some samples were investigated in the super-cooled liquid state. For a wide range of DESs, viscosity decreases in an exponential manner with increasing temperature.21 However, this is not the case for the majority of the compositions described here and especially not for the mixtures with high chromium salt content, as shown in Fig. 2. The viscosity of the medium is reduced as the mole fraction of CrCl3·6H2O decreases. The minimum viscosity is not observed at the eutectic composition, which is what is observed for all other DESs systems studied to date.20,22 It should however be noted that the viscosity of these Type 4 eutectics is significantly lower compared to Type 2 DESs, e.g. ChCl:CrCl3·6H2O,16 and anhydrous Type 4 DESs, e.g. urea:ZnCl2, previously reported.20 At 20 °C the viscosity of the ChCl![[thin space (1/6-em)]](https://www.rsc.org/images/entities/char_2009.gif) :
:![[thin space (1/6-em)]](https://www.rsc.org/images/entities/char_2009.gif) CrCl3·6H2O system at the eutectic composition (1
CrCl3·6H2O system at the eutectic composition (1![[thin space (1/6-em)]](https://www.rsc.org/images/entities/char_2009.gif) :
:![[thin space (1/6-em)]](https://www.rsc.org/images/entities/char_2009.gif) 2) is 4800 cP while the urea
2) is 4800 cP while the urea![[thin space (1/6-em)]](https://www.rsc.org/images/entities/char_2009.gif) :
:![[thin space (1/6-em)]](https://www.rsc.org/images/entities/char_2009.gif) CrCl3·6H2O is 2602 cP (1
CrCl3·6H2O is 2602 cP (1![[thin space (1/6-em)]](https://www.rsc.org/images/entities/char_2009.gif) :
:![[thin space (1/6-em)]](https://www.rsc.org/images/entities/char_2009.gif) 2).
2).
Conductivity
Fig. 3 shows the conductivity of the urea:CrCl3·6H2O system as a function of temperature and composition. Conductivity increases with temperature in a linear fashion for all compositions, whilst in most other DESs the conductivity increases exponentially with temperature.21 Similarly to viscosity, conductivity does not change regularly as the mole fraction of CrCl3·6H2O increases. The highest conductivity is observed for the 4![[thin space (1/6-em)]](https://www.rsc.org/images/entities/char_2009.gif) :
:![[thin space (1/6-em)]](https://www.rsc.org/images/entities/char_2009.gif) 1 urea
1 urea![[thin space (1/6-em)]](https://www.rsc.org/images/entities/char_2009.gif) :
:![[thin space (1/6-em)]](https://www.rsc.org/images/entities/char_2009.gif) CrCl3·6H2O composition, which is also the least viscous. This indicates that ionic mobility rather than the concentration of charge carriers is most important in controlling conductivity. This is common to other eutectic mixtures and ionic liquids and a strong indication for the applicability of hole-theory to describe transport properties.24,27
CrCl3·6H2O composition, which is also the least viscous. This indicates that ionic mobility rather than the concentration of charge carriers is most important in controlling conductivity. This is common to other eutectic mixtures and ionic liquids and a strong indication for the applicability of hole-theory to describe transport properties.24,27
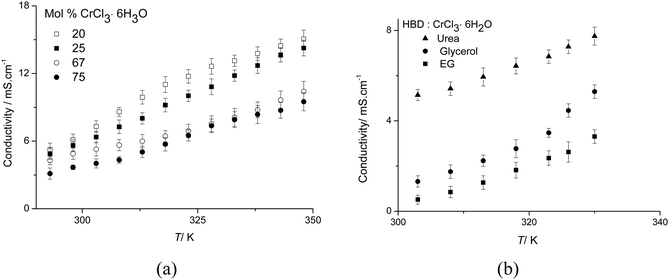 | ||
Fig. 3 (a) Conductivity of urea![[thin space (1/6-em)]](https://www.rsc.org/images/entities/char_2009.gif) : :![[thin space (1/6-em)]](https://www.rsc.org/images/entities/char_2009.gif) CrCl3·6H2O as a function of temperature and composition, and (b) conductivity of HBD CrCl3·6H2O as a function of temperature and composition, and (b) conductivity of HBD![[thin space (1/6-em)]](https://www.rsc.org/images/entities/char_2009.gif) : :![[thin space (1/6-em)]](https://www.rsc.org/images/entities/char_2009.gif) CrCl3·6H2O (1 CrCl3·6H2O (1![[thin space (1/6-em)]](https://www.rsc.org/images/entities/char_2009.gif) : :![[thin space (1/6-em)]](https://www.rsc.org/images/entities/char_2009.gif) 1) as a function of temperature. 1) as a function of temperature. | ||
Generally, the conductivities observed for the urea systems are much higher than any other DES previously reported. At 303 K for example, conductivities of the urea:CrCl3·6H2O system are an order of magnitude larger (5 mS cm−1) than those of the analogous ChCl:CrCl3·6H2O system (0.4 mS cm−1).16 This can be partly associated to the viscosity of the ionic liquids, but may also be due to the change in the type of charge carrier. These values are also comparable to some of the highest conductivities reported for room temperature ionic liquids with discrete anions.23
The current study focusses on urea as a hydrogen bond donor (HBD) although other HBDs also form eutectic mixtures with hydrated metal salts. Fig. 3b compares the conductivity for different Type 4 DESs. Ethylene glycol and glycerol have been shown to form good hydrogen bond donors (HDBs) forming eutectic mixtures with choline chloride (Type 3 DES).24 In the Type 4 DESs with CrCl3·6H2O, the urea system exhibits the highest conductivity. The converse is observed with the Type 3 DESs with choline chloride15 and this topic will be investigated in greater detail in the future.
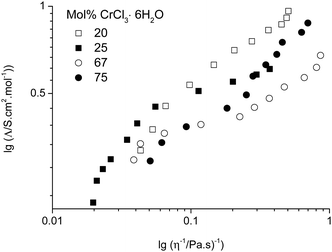
Numerous studies have found empirically that the molar conductivity of an ionic liquid is inversely proportional to the viscosity of the liquid and have erroneously invoked the Walden rule (Λ0mη0 = constant) as a method of describing an ionic liquid.25,26 We have subsequently shown that this arises from the low density of suitably sized holes in the liquid and since the size of suitable voids is at infinite dilution then the Nernst Einstein eqn (1) is valid.27
 | (1) |
Solution speciation
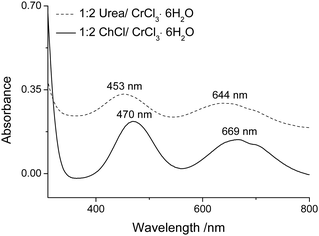
The liquids are highly conducting and, since chromium and chloride ions are the only charge carriers, the conducting species must originate from CrCl3·6H2O. In previous FAB-MS studies16 Type 2 DESs of ChCl:CrCl3·6H2O showed Ch+ cations and [Cr(H2O)2Cl4]−.16 In FAB-MS with urea:CrCl3·6H2O no chromium-containing anions were detected, indicating that Cl− may be the main anionic species. Analysis also showed several chromium containing cations including CrCl2+. However, it must be acknowledged that mass spectrometry is not a reliable technique for determining in situ speciation of rather weak transition metal chloro-aquo complexes.28,29Elving and Zemel showed that the number of chloride and water ligands bound to the metal affected the UV-visible spectrum of the chromium species.30 They indicated two bands varying from 407 to 475 nm (4T1g ← 4A2g) for the first and from 575 to 665 nm (4T2g ← 4A2g) for the second band. For each band the lower end of the wavelength absorbance was assigned to the hexaaqua complex and the upper end to the trichloro species. The addition of each chloride ligand moves the wavelength of each band by about 20 to 30 nm. In a neutral aqueous solution, the hexaaqua species dominates but the trichloro species dominates in 12 M HCl. Fig. 5 shows the difference between the 1![[thin space (1/6-em)]](https://www.rsc.org/images/entities/char_2009.gif) :
:![[thin space (1/6-em)]](https://www.rsc.org/images/entities/char_2009.gif) 2 urea
2 urea![[thin space (1/6-em)]](https://www.rsc.org/images/entities/char_2009.gif) :
:![[thin space (1/6-em)]](https://www.rsc.org/images/entities/char_2009.gif) CrCl3·6H2O system and the 1
CrCl3·6H2O system and the 1![[thin space (1/6-em)]](https://www.rsc.org/images/entities/char_2009.gif) :
:![[thin space (1/6-em)]](https://www.rsc.org/images/entities/char_2009.gif) 2 ChCl
2 ChCl![[thin space (1/6-em)]](https://www.rsc.org/images/entities/char_2009.gif) :
:![[thin space (1/6-em)]](https://www.rsc.org/images/entities/char_2009.gif) CrCl3·6H2O mixture. While these spectra are indicative of more than one complex co-existing in solution, the maxima of the two bands are both shifted by about 25 nm suggesting that, on average, the 1
CrCl3·6H2O mixture. While these spectra are indicative of more than one complex co-existing in solution, the maxima of the two bands are both shifted by about 25 nm suggesting that, on average, the 1![[thin space (1/6-em)]](https://www.rsc.org/images/entities/char_2009.gif) :
:![[thin space (1/6-em)]](https://www.rsc.org/images/entities/char_2009.gif) 2 urea
2 urea![[thin space (1/6-em)]](https://www.rsc.org/images/entities/char_2009.gif) :
:![[thin space (1/6-em)]](https://www.rsc.org/images/entities/char_2009.gif) CrCl3·6H2O system contains 1 less chloride than the 1
CrCl3·6H2O system contains 1 less chloride than the 1![[thin space (1/6-em)]](https://www.rsc.org/images/entities/char_2009.gif) :
:![[thin space (1/6-em)]](https://www.rsc.org/images/entities/char_2009.gif) 2 ChCl
2 ChCl![[thin space (1/6-em)]](https://www.rsc.org/images/entities/char_2009.gif) :
:![[thin space (1/6-em)]](https://www.rsc.org/images/entities/char_2009.gif) CrCl3·6H2O mixture.
CrCl3·6H2O mixture.
EXAFS was recorded to elucidate the nature of the chromium species, in particular with respect to their overall charge. In most cases, the Fourier transforms (Fig. 6) exhibit a double peak at ca. 2 Å, resulting from a mixed 1st coordination shell consisting of O and Cl donor ligands. Only the spectrum of 4![[thin space (1/6-em)]](https://www.rsc.org/images/entities/char_2009.gif) :
:![[thin space (1/6-em)]](https://www.rsc.org/images/entities/char_2009.gif) 1 urea
1 urea![[thin space (1/6-em)]](https://www.rsc.org/images/entities/char_2009.gif) :
:![[thin space (1/6-em)]](https://www.rsc.org/images/entities/char_2009.gif) CrCl3·6H2O shows a single peak. This is confirmed by the least square fits (Table 2). In the samples with no more than 67% urea, Cr is coordinated by 4 oxygen donor ligands (urea or water, OD) and 2 chloride ions, hence resulting in the cationic species [CrCl2(OD)4]+. This is even maintained if a significant amount of water is added to the sample.
CrCl3·6H2O shows a single peak. This is confirmed by the least square fits (Table 2). In the samples with no more than 67% urea, Cr is coordinated by 4 oxygen donor ligands (urea or water, OD) and 2 chloride ions, hence resulting in the cationic species [CrCl2(OD)4]+. This is even maintained if a significant amount of water is added to the sample.
 | ||
Fig. 6 Fourier transforms of the EXAFS data (black circles) and fits (red line) for (left) 1![[thin space (1/6-em)]](https://www.rsc.org/images/entities/char_2009.gif) : :![[thin space (1/6-em)]](https://www.rsc.org/images/entities/char_2009.gif) 2 and (middle) 4 2 and (middle) 4![[thin space (1/6-em)]](https://www.rsc.org/images/entities/char_2009.gif) : :![[thin space (1/6-em)]](https://www.rsc.org/images/entities/char_2009.gif) 1 urea 1 urea![[thin space (1/6-em)]](https://www.rsc.org/images/entities/char_2009.gif) : :![[thin space (1/6-em)]](https://www.rsc.org/images/entities/char_2009.gif) CrCl3·6H2O and (right) 1 CrCl3·6H2O and (right) 1![[thin space (1/6-em)]](https://www.rsc.org/images/entities/char_2009.gif) : :![[thin space (1/6-em)]](https://www.rsc.org/images/entities/char_2009.gif) 2 ChCl 2 ChCl![[thin space (1/6-em)]](https://www.rsc.org/images/entities/char_2009.gif) : :![[thin space (1/6-em)]](https://www.rsc.org/images/entities/char_2009.gif) CrCl3·6H2O. CrCl3·6H2O. | ||
Urea![[thin space (1/6-em)]](https://www.rsc.org/images/entities/char_2009.gif) : :![[thin space (1/6-em)]](https://www.rsc.org/images/entities/char_2009.gif) CrCl3·6H2O CrCl3·6H2O |
Coordinating atom | Number of atoms, N | Distance from Cr r/Å | Debye–Waller factor a/Å2 | Fit index, R1/% |
|---|---|---|---|---|---|
4![[thin space (1/6-em)]](https://www.rsc.org/images/entities/char_2009.gif) : :![[thin space (1/6-em)]](https://www.rsc.org/images/entities/char_2009.gif) 1 1 |
O | 4.5(5) | 1.970(9) | 0.005(3) | 12.1 |
2![[thin space (1/6-em)]](https://www.rsc.org/images/entities/char_2009.gif) : :![[thin space (1/6-em)]](https://www.rsc.org/images/entities/char_2009.gif) 1 1 |
O | 4.8(6) | 1.984(7) | 0.007(3) | 7.6 |
| Cl | 1.5(8) | 2.27(3) | 0.020(15) | ||
1![[thin space (1/6-em)]](https://www.rsc.org/images/entities/char_2009.gif) : :![[thin space (1/6-em)]](https://www.rsc.org/images/entities/char_2009.gif) 1 1 |
O | 3.5(4) | 1.96(1) | 0.004(2) | 4.1 |
| Cl | 2.0(5) | 2.26(1) | 0.006(4) | ||
1![[thin space (1/6-em)]](https://www.rsc.org/images/entities/char_2009.gif) : :![[thin space (1/6-em)]](https://www.rsc.org/images/entities/char_2009.gif) 2 2 |
O | 3.8(4) | 1.944(9) | 0.004(2) | 4.3 |
| Cl | 2.1(5) | 2.263(9) | 0.010(4) | ||
1![[thin space (1/6-em)]](https://www.rsc.org/images/entities/char_2009.gif) : :![[thin space (1/6-em)]](https://www.rsc.org/images/entities/char_2009.gif) 2 (+20 H2O) 2 (+20 H2O) |
O | 3.6(4) | 1.95(1) | 0.004(2) | 4.8 |
| Cl | 1.8(6) | 2.25(1) | 0.007(5) | ||
ChCl![[thin space (1/6-em)]](https://www.rsc.org/images/entities/char_2009.gif) : :![[thin space (1/6-em)]](https://www.rsc.org/images/entities/char_2009.gif) CrCl3·6H2O CrCl3·6H2O |
Coordinating atom | Number of atoms, N | Distance from Cr r/Å | Debye–Waller factor a/Å2 | Fit index, R1/% |
|---|---|---|---|---|---|
1![[thin space (1/6-em)]](https://www.rsc.org/images/entities/char_2009.gif) : :![[thin space (1/6-em)]](https://www.rsc.org/images/entities/char_2009.gif) 2 2 |
O | 3.7(4) | 1.97(1) | 0.006(3) | 5.5 |
| Cl | 2.4(5) | 2.268(8) | 0.006(4) |
In all Fourier transforms there is a broad peak at ca. 4 Å, which indicates the presence of coordinating urea molecules. The peak is more pronounced in the samples with high urea content. However, it was not possible to include these in the fits and the urea![[thin space (1/6-em)]](https://www.rsc.org/images/entities/char_2009.gif) :
:![[thin space (1/6-em)]](https://www.rsc.org/images/entities/char_2009.gif) water ratio in the coordination shells remains unknown.
water ratio in the coordination shells remains unknown.
In the Type 2 DES 1![[thin space (1/6-em)]](https://www.rsc.org/images/entities/char_2009.gif) :
:![[thin space (1/6-em)]](https://www.rsc.org/images/entities/char_2009.gif) 2 ChCl
2 ChCl![[thin space (1/6-em)]](https://www.rsc.org/images/entities/char_2009.gif) :
:![[thin space (1/6-em)]](https://www.rsc.org/images/entities/char_2009.gif) CrCl3·6H2O liquid, EXAFS shows that chromium ions are coordinated by 2.5 chloride ions on average. This is consistent with the higher chloride content of these mixtures compared to the Type 4 system. The presence of anionic species in FAB-MS suggests that the solution contains a mixture of anionic and cationic complexes, probably in a ratio of 3
CrCl3·6H2O liquid, EXAFS shows that chromium ions are coordinated by 2.5 chloride ions on average. This is consistent with the higher chloride content of these mixtures compared to the Type 4 system. The presence of anionic species in FAB-MS suggests that the solution contains a mixture of anionic and cationic complexes, probably in a ratio of 3![[thin space (1/6-em)]](https://www.rsc.org/images/entities/char_2009.gif) :
:![[thin space (1/6-em)]](https://www.rsc.org/images/entities/char_2009.gif) 1. The charge carriers in these solutions would hence be choline and [CrCl2(H2O)4]+ as cations, and chloride and [CrCl4(H2O)2]− as anions.
1. The charge carriers in these solutions would hence be choline and [CrCl2(H2O)4]+ as cations, and chloride and [CrCl4(H2O)2]− as anions.
Density, surface tension and hole theory
The variation of density and surface tension as a function of temperature and composition are shown in Fig. 7. The densities for all compositions decrease with increasing temperature, as expected. Surprisingly the densities of the liquids are higher than those of the solid state components (density urea = 1.2 g cm−3, CrCl3·6H2O = 1.76 g cm−3). Motin studied the molar volume of concentrated salt–water–urea systems and found that urea was strongly structure forming.31 Extrapolating Motin's data suggests that a water free system would also have a density higher than the components. The observation that the density of the liquid is higher than the solid components indicates that hydrogen bonding is different in the solid and liquid forms, similar to the case with ice. This is supported by the observation that the liquid freezes from the top of the container, i.e. the solid floats on top of the liquid.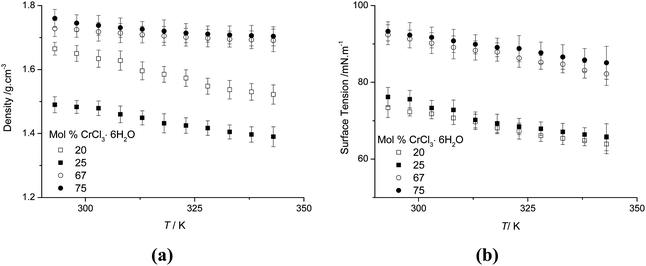 | ||
| Fig. 7 (a) Density and (b) surface tension of the urea:CrCl3·6H2O system as a function of temperature and composition. | ||
Fig. 7b shows the surface tension as a function of temperature and composition. The values of the surface tension range from 63.9 to 93.34 mN m−1. These are higher than those of typical high temperature molten salts, (e.g. KBr = 77.3 mN m−1 at 1173 K vs. ChCl:2CrCl3·6H2O = 77.68 mN m−1 at 313 K)16,32 and are similar to the previously studied Type III system but higher than those of molecular liquids (e.g. benzene = 28.9 mN m−1 and other room temperature ionic liquids [BMIM][PF6] = 44.1 mN m−1 and ChCl:ZnCl2 = 50.9 mN m−1).33–36
It has been shown that hole theory developed by Füth and later extended by Bockris for use with molten salts can be used to determine the average radius, r, of the voids in an ionic liquid using eqn (2):37
 | (2) |
Cyclic voltammetry
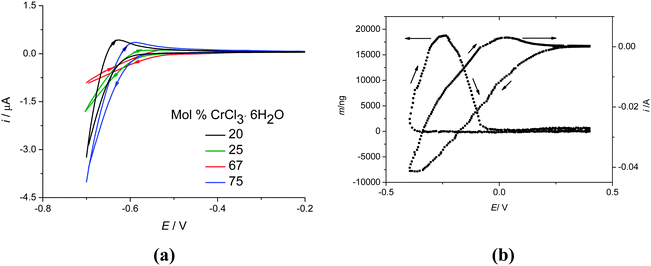
Fig. 8a shows cyclic voltammograms for the urea:CrCl3·6H2O system at different compositions, recorded at 40 °C on a Pt disc electrode with a sweep rate of 20 mV s−1. The cathodic current increases with increasing CrCl3·6H2O content, as expected. The voltammograms are poorly resolved which appears to be a feature of Cr, Ni and Fe complexes in the liquids studied to date. This does appear to be substrate dependent and it is a topic which we are currently investigating. The interpretation of the poorly resolved voltammogram is aided, however, by simultaneously monitoring the mass changes using an electrochemical quartz crystal microbalance (EQCM). Fig. 8b shows the current and mass changes for 1![[thin space (1/6-em)]](https://www.rsc.org/images/entities/char_2009.gif) :
:![[thin space (1/6-em)]](https://www.rsc.org/images/entities/char_2009.gif) 2 urea
2 urea![[thin space (1/6-em)]](https://www.rsc.org/images/entities/char_2009.gif) :
:![[thin space (1/6-em)]](https://www.rsc.org/images/entities/char_2009.gif) CrCl3·6H2O at an unpolished gold electrode on a quartz crystal resonator. There is a large cathodic current observed from 0.25 V with respect to the silver wire pseudo-reference electrode. However, mass deposition is only observed from ca. −0.3 V. On the anodic scan the mass still increases significantly showing that the metal nuclei are still growing. The initial current before mass deposition is observed must therefore be caused by the reduction of Cr(III) to Cr(II). Setting the lower scan potential to −0.2 V, an oxidative current is observed on the anodic sweep corresponding to Cr(II) to Cr(III) confirming this assumption. The mass deposited at −0.4 V is all stripped between −0.2 and 0 V, which shows that the deposition process is electrochemically reversible.
CrCl3·6H2O at an unpolished gold electrode on a quartz crystal resonator. There is a large cathodic current observed from 0.25 V with respect to the silver wire pseudo-reference electrode. However, mass deposition is only observed from ca. −0.3 V. On the anodic scan the mass still increases significantly showing that the metal nuclei are still growing. The initial current before mass deposition is observed must therefore be caused by the reduction of Cr(III) to Cr(II). Setting the lower scan potential to −0.2 V, an oxidative current is observed on the anodic sweep corresponding to Cr(II) to Cr(III) confirming this assumption. The mass deposited at −0.4 V is all stripped between −0.2 and 0 V, which shows that the deposition process is electrochemically reversible.
It should however be noted that some of the current may be attributed to side reactions, such as the decomposition of waters of crystallisation. To determine the current efficiency, EQCM studies were carried out at a constant potential of −0.4 V and the mass–charge plots showed a current efficiency of 74%. This compares with 65% for the ChCl![[thin space (1/6-em)]](https://www.rsc.org/images/entities/char_2009.gif) :
:![[thin space (1/6-em)]](https://www.rsc.org/images/entities/char_2009.gif) 2CrCl3·6H2O system and about 15% for the aqueous chromic acid.1 The difference in current efficiency between the two eutectic mixtures could result from the different amounts of chromium being present in the form of a cationic species. Since the electrode will be negative of the potential of zero charge during deposition, the surface concentration of the positively charged chromium species will be high in the urea eutectic, whereas the surface layer may be dominated by choline cations in the ChCl:2CrCl3·6H2O system. The high current efficiency suggests that hydrogen embrittlement of the substrate will be less of an issue with this liquid than with aqueous deposition where it is a major problem.
2CrCl3·6H2O system and about 15% for the aqueous chromic acid.1 The difference in current efficiency between the two eutectic mixtures could result from the different amounts of chromium being present in the form of a cationic species. Since the electrode will be negative of the potential of zero charge during deposition, the surface concentration of the positively charged chromium species will be high in the urea eutectic, whereas the surface layer may be dominated by choline cations in the ChCl:2CrCl3·6H2O system. The high current efficiency suggests that hydrogen embrittlement of the substrate will be less of an issue with this liquid than with aqueous deposition where it is a major problem.
Bulk deposition
The effect of the current density on deposit morphology was studied using a Hull cell. This enables a range of current densities to be applied to one substrate under otherwise identical conditions. Bulk electrodeposition from the 1![[thin space (1/6-em)]](https://www.rsc.org/images/entities/char_2009.gif) :
:![[thin space (1/6-em)]](https://www.rsc.org/images/entities/char_2009.gif) 2 urea
2 urea![[thin space (1/6-em)]](https://www.rsc.org/images/entities/char_2009.gif) :
:![[thin space (1/6-em)]](https://www.rsc.org/images/entities/char_2009.gif) CrCl3·6H2O system at 40 °C for 2 hours onto a mild steel electrode at an applied voltage of 4 V resulted in an amorphous dark grey deposit of up to 50 μm in thickness (Fig. 9). No significant gas evolution was noticed, verifying that the waters of hydration are less electrochemically active than bulk water. According to SEM the structure of the film is not a macrocrystalline deposit as would be observed with aqueous chromic acid solutions although the surface roughness of the deposit increases as the current density increases. In all cases the deposit is largely crack free, although there may be signs of some micro-cracking occurring at high current densities. EDX shows no presence of oxygen but there is some chloride trapped in the deposit particularly at high current density. In comparison, previous studies into the deposition of chromium from the equivalent Type 2 system at 60 °C found that the deposit morphology was amorphous and pale blue/grey in colour,16 whilst also being very soft and easily removable during wear testing.8
CrCl3·6H2O system at 40 °C for 2 hours onto a mild steel electrode at an applied voltage of 4 V resulted in an amorphous dark grey deposit of up to 50 μm in thickness (Fig. 9). No significant gas evolution was noticed, verifying that the waters of hydration are less electrochemically active than bulk water. According to SEM the structure of the film is not a macrocrystalline deposit as would be observed with aqueous chromic acid solutions although the surface roughness of the deposit increases as the current density increases. In all cases the deposit is largely crack free, although there may be signs of some micro-cracking occurring at high current densities. EDX shows no presence of oxygen but there is some chloride trapped in the deposit particularly at high current density. In comparison, previous studies into the deposition of chromium from the equivalent Type 2 system at 60 °C found that the deposit morphology was amorphous and pale blue/grey in colour,16 whilst also being very soft and easily removable during wear testing.8
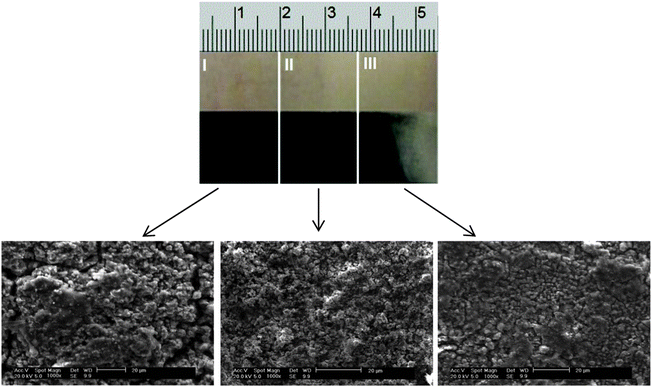 | ||
| Fig. 9 Chromium electrodeposit obtained using a Hull cell and the urea:2CrCl3·6H2O Type 4 DES (current densities: I = 0.22, II = 0.17 and III = 0.11 A cm−2). | ||
Chromium coatings are used for surfaces that endure significant wear e.g. hydraulic shafts. An important property of the coatings is therefore their hardness. Chromium deposited using chromic acid has hardness values of typically 800 Vickers. Previous studies using the ChCl:CrCl3·6H2O system produced a coating with a hardness of 242 Vickers. With proprietary additives it is possible to increase this value to 600 Vickers.39 Hardness measurements were carried out on the sample shown in Fig. 9 and it was found that the average hardness of the sample was ca. 600 ± 10 Vickers, which is close to the values required for hard chrome.
4. Conclusions
It has been shown that novel Type 4 room-temperature deep eutectic solvents can be formed using urea and hydrated chromium(III)chloride. The eutectic composition occurs at a mole fraction of 0.67 metal salt, similarly to many other Type 2, 3 and 4 DESs.The liquids display high conductivities, despite relatively high viscosities and this is thought to result from chloride being the main charge carrying species. A variety of techniques were used to elucidate the chromium speciation in solution and it is evident that the speciation is different from the analogous ChCl:CrCl3 Type 2 system. EXAFS suggests that the main chromium species is the cationic ([CrCl2(OD)4]+) and transport properties can be explained using hole theory.
Chromium electrodeposition proceeds via a 1 electron transfer (Cr3+/2+) followed by a 2 electron reduction to the metal. Deposition onto gold is electrochemically reversible and the reduction process had a high current efficiency despite the hydrate water molecules present. Thick, adherent, non-cracked chromium could be bulk-deposited onto steel and coating hardness values of approximately 600 ± 10 Vickers could be achieved showing that the liquid is able to produce hard chromium coatings.
Abbreviations
| [BMIM][PF6] | 1-Butyl-3-methylimidazolium hexafluorophosphate |
| ChCl | Choline chloride |
| CV | Cyclic voltammetry |
| DES | Deep eutectic solvent |
| DSC | Differential scanning calorimeter |
| EDX | Energy dispersive analysis using X-rays |
| EG | Ethylene glycol |
| EQCM | Electrochemical quartz crystal microbalance |
| EXAFS | Extended X-ray absorption fine structure |
| FAB-MS | Fast atomic bombardment mass spectrometry |
| HBD | Hydrogen bond donor |
| IL | Ionic liquid |
| Λ | Molar conductivity |
| SEM | Scanning electron microscopy |
| T f | Freezing temperature |
| η | Viscosity |
Acknowledgements
The authors would like to thank the Ministry of Higher Education and Scientific Research in the Iraqi Kurdistan Region for a studentship (AAA) and the team of ESRF beamline BM25A (SpLine) for beamtime and support.References
-
M. Schlesinger and M. Paunovic, Modern electroplating, Wiley, New York, 2000 Search PubMed
.
- A. P. Abbott, G. Frisch and K. S. Ryder, Electroplating using Ionic liquids, Annu. Rev. Mater. Res., 2013, 43, 1.1–1.24 CrossRef
.
- Q. Liao, W. R. Pitner, G. Stewart, C. L. Hussey and G. R. Stafford, J. Electrochem. Soc., 1997, 144, 936 CrossRef CAS PubMed
.
- S. Zein El Abedin, N. Borissenko and F. Endres, Electrochem. Commun., 2004, 6, 510 CrossRef CAS PubMed
.
-
F. Endres, D. MacFarlane and A. P. Abbott, Electrodeposition from ionic liquids, John Wiley & Sons, 2008 Search PubMed
.
- S. Eugenio, C. M. Rangel, R. Vilar and S. Quaresma, Electrochim. Acta, 2011, 56, 10347 CrossRef CAS PubMed
.
- S. Eugenio, C. M. Rangel, R. Vilar and A. M. B. do Rego, Thin Solid Films, 2011, 519, 1845 CrossRef CAS PubMed
.
- A. P. Abbott, G. Capper, D. L. Davies, R. K. Rasheed, J. Archer and C. John, Trans. Inst. Met. Finish., 2004, 82, 14 CAS
.
- A. P. Abbott, G. Capper, B. G. Swain and D. A. Wheeler, Trans. Inst. Met. Finish., 2005, 83, 51 CrossRef CAS PubMed
.
- A. P. Abbott, G. Capper, K. J. McKenzie, A. Glidle and K. S. Ryder, Phys. Chem. Chem. Phys., 2006, 8, 4214 RSC
.
- A. P. Abbott, J. Griffith, S. Nandhra, C. O'Connor, S. Postlethwaite, K. S. Ryder and E. L. Smith, Surf. Coat. Technol., 2008, 202, 2033 CrossRef CAS PubMed
.
- A. P. Abbott, S. Nandhra, S. Postlethwaite, E. L. Smith and K. S. Ryder, Phys. Chem. Chem. Phys., 2007, 9, 3735 RSC
.
- H. M. A. Abood, A. P. Abbott, A. D. Ballantyne and K. S. Ryder, Chem. Commun., 2011, 47, 3523 CAS
.
- N. R. Brooks, S. Schaltin, K. Van Hecke, L. Van Meervelt, K. Binnemans and J. Fransaer, Chem. – Eur. J., 2011, 17, 5054 CrossRef CAS PubMed
.
- A. P. Abbott, K. S. Ryder and U. König, Trans. Inst. Met. Finish., 2008, 86, 196 CAS
.
- A. P. Abbott, G. Capper, D. L. Davies and R. K. Rasheed, Chem. – Eur. J., 2004, 10, 3769 CrossRef CAS PubMed
.
- B. Ravel and M. Newville, J. Synchrotron Radiat., 2005, 12, 537 CrossRef CAS PubMed
.
- S. Tomic, B. Searle, A. Wander, N. Harrison, A. Dent, J. Mosselmans and J. Inglesfield, Council for the Central Laboratory of the Research Councils, 2005, pp. 1–10.
- M. Roy and S. J. Gurman, J. Synchrotron Radiat., 2001, 8, 1095 CrossRef CAS
.
- A. P. Abbott, J. C. Barron, K. S. Ryder and D. Wilson, Chem. – Eur. J., 2007, 13, 6495 CrossRef CAS PubMed
.
- A. P. Abbott, D. Boothby, G. Capper, D. L. Davies and R. K. Rasheed, J. Am. Chem. Soc., 2004, 126, 9142 CrossRef CAS PubMed
.
- A. P. Abbott, G. Capper, D. L. Davies, R. K. Rasheed and V. Tambyrajah, Chem. Commun., 2003, 70 RSC
.
- P. Wasserscheid and T. Welton, Ionic liquids in synthesis, Wiley Online Library, 2008 Search PubMed.
- A. P. Abbott, R. C. Harris, K. S. Ryder, C. D'Agostino, L. F. Gladden and M. D. Mantle, Green Chem., 2011, 13, 82 RSC
.
- C. A. Angell, N. Byrne and J.-P. Belieres, Acc. Chem. Res., 2007, 40, 1228 CrossRef CAS PubMed
.
- W. Xu, E. I. Cooper and C. A. Angell, J. Phys. Chem. B, 2003, 107, 6170 CrossRef CAS
.
- A. P. Abbott, ChemPhysChem, 2004, 5, 1242 CrossRef CAS PubMed
.
- A. P. Abbott, J. C. Barron, G. Frisch, S. Gurman, K. S. Ryder and A. F. Silva, Phys. Chem. Chem. Phys., 2011, 13, 10224 CAS
.
- A. P. Abbott, G. Capper, K. J. McKenzie and K. S. Ryder, J. Electroanal. Chem., 2007, 599, 288 CrossRef CAS PubMed
.
- P. J. Elving and B. Zemel, J. Am. Chem. Soc., 1957, 79, 1281 CrossRef CAS
.
- M. Motin, J. Chem. Eng. Data, 2004, 49, 94 CrossRef CAS
.
-
G. J. Janz, Molten Salts Handbook, Elsevier Science, 2013 Search PubMed
.
- A. P. Abbott, R. C. Harris and K. S. Ryder, J. Phys. Chem. B, 2007, 111, 4910 CrossRef CAS PubMed
.
- W. D. Harkins and Y. C. Cheng, J. Am. Chem. Soc., 1921, 43, 35 CrossRef CAS
.
- M. G. Freire, P. J. Carvalho, A. M. Fernandes, I. M. Marrucho, A. J. Queimada and J. A. P. Coutinho, J. Colloid Interface Sci., 2007, 314, 621 CrossRef CAS PubMed
.
- A. P. Abbott, G. Capper, D. L. Davies and R. Rasheed, Inorg. Chem., 2004, 43, 3447 CrossRef CAS PubMed
.
- J. M. Bockris and G. Hooper, Discuss. Faraday Soc., 1961, 32, 218 RSC
.
-
J. O'M. Bockris and A. K. N. Reddy, Modern Electrochemistry, Plenum, New York, 1970, ch. 6, vol. 1 Search PubMed
.
- E. L. Smith, C. Fullarton, R. C. Harris, S. Saleem, A. P. Abbott and K. S. Ryder, Trans. Inst. Met. Finish., 2010, 88, 285 CAS
.
| This journal is © the Owner Societies 2014 |

