 Open Access Article
Creative Commons Attribution 3.0 Unported Licence
Lithium cation conducting TDI anion-based ionic liquids†
Leszek
Niedzicki
*a,
Ewelina
Karpierz
a,
Maciej
Zawadzki
b,
Maciej
Dranka
a,
Marta
Kasprzyk
a,
Aldona
Zalewska
a,
Marek
Marcinek
a,
Janusz
Zachara
a,
Urszula
Domańska
b and
Władysław
Wieczorek
a
aWarsaw University of Technology, Faculty of Chemistry, Department of Inorganic Chemistry and Solid State Technology, Noakowskiego 3, 00664 Warsaw, Poland. E-mail: lniedzicki@ch.pw.edu.pl; Fax: +48 22 628 2741; Tel: +48 22 234 7421
bWarsaw University of Technology, Faculty of Chemistry, Department of Physical Chemistry, Noakowskiego 3, 00664 Warsaw, Poland
First published on 17th March 2014
Abstract
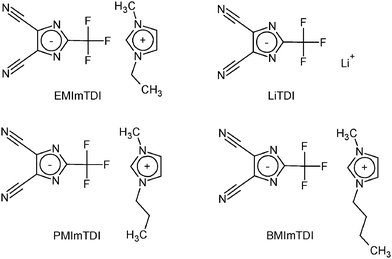
In this paper we present the synthesis route and electrochemical properties of new class of ionic liquids (ILs) obtained from lithium derivate TDI (4,5-dicyano-2-(trifluoromethyl)imidazolium) anion. ILs synthesized by us were EMImTDI, PMImTDI and BMImTDI, i.e. TDI anion with 1-alkyl-3-methylimidazolium cations, where alkyl meant ethyl, propyl and butyl groups. TDI anion contains fewer fluorine atoms than LiPF6 and thanks to C–F instead of P–F bond, they are less prone to emit fluorine or hydrogen fluoride due to the rise in temperature. Use of IL results in non-flammability, which is making such electrolyte even safer for both application and environment. The thermal stability of synthesized compounds was tested by DSC and TGA and no signal of decomposition was observed up to 250 °C. The LiTDI salt was added to ILs to form complete electrolytes. The structures of tailored ILs with lithium salt were confirmed by X-ray diffraction patterns. The electrolytes showed excellent properties regarding their ionic conductivity (over 3 mS cm−1 at room temperature after lithium salt addition), lithium cation transference number (over 0.1), low viscosity and broad electrochemical stability window. The ionic conductivity and viscosity measurements of pure ILs are reported for reference.
1. Introduction
No doubt Li (ion) battery is one of the most established devices for energy storage.1–3 While there are significant numbers of publications on the new lithium-ion cell electrode materials (or additions to those), very little attention has been devoted to new salts used in lithium electrolytes.That was the reason for the concept of creating new anions for lithium ion batteries. The whole idea came from the transposition of the Hückel rule predicting the stability of aromatic salt systems. One of the most common examples of this type of anions (sometimes called “Hückel anions”) is 4,5-dicyanotriazole (DCTA). This particular structure is completely covalently bonded and shows very stable 6π (or 10π electron if CN bonds are involved in calculations) configuration. LiDCTA was successfully tested in PEO matrice systems as a promising, improved electrolyte for rechargeable lithium batteries.4 Unfortunately DCTA failed as a component of the EC/DMC (1![[thin space (1/6-em)]](https://www.rsc.org/images/entities/char_2009.gif) :
:![[thin space (1/6-em)]](https://www.rsc.org/images/entities/char_2009.gif) 1) battery electrolyte.
1) battery electrolyte.
Therefore, new “tailored” anions were studied by our group, which have been designed and investigated directly for application as lithium electrolytes in lithium-ion cells. Several patents and papers5–9 have been published before, describing details about synthesis, production, structure and electrochemical properties of perfluorinated anion based lithium salts. These new compounds showed thermal stability (over 250 °C, no aluminum corrosion and electrochemical stability up to 4.6 V) and transference number properties superior to the presently used lithium salts in electrolytes. Also the safety aspects of pure LiTDI (lithium 4,5-dicyano-2-(trifluoromethyl)imidazolide) were published recently.10
So far these salts have been studied as a component of solid or liquid electrolytes.5–7 The present paper extends their use to ionic liquid (IL) based electrolytes.
Classical solvents in batteries (e.g. EC, DMC, PC) are usually toxic and flammable (volatile). The low vapor pressure of ILs has very important advantages as compared to other so called volatile organic chemicals (VOCs). Therefore ILs are neither flammable nor explosive and the risk of prolonged pollution into the air is substantially reduced.11,12 In consequence, new solvents, such as ILs, are considered as alternative technologies which offer minimal evaporation into the atmosphere allowing simple recycling and reuse. Using simple syntheses as proposed in our manuscript is a good way of limiting any unwanted byproducts and wastes. These are the clear environmental aspects of such type of electrolytes. It should be definitely mentioned that ILs offer a huge environmental advantage when considering them as so-called “green chemistry” compounds in battery industry. One of the principles of green chemistry put special attention to the new approach toward industrial procedures where any kinds of wastes are not treated anymore simply as byproducts of the chemical processes so the simple synthesis route proposed here fulfils these requirements.
The richness of structural variations and chemistry behavior13,14 makes ILs attractive candidates for many applications.15 The interest in ILs as electrolytes for lithium (ion) batteries is increasing with the popularity of lithium batteries as energy storage for everyday use and with social pressure on green technologies development.16 The reason is obvious: ILs offer high conductivity, non-flammability, wide electrochemical and thermal stability windows.17 However, up until now, there have been many disadvantages of these new materials. One of them has been large decrease of conductivity with the addition of lithium salt to IL, which limits possible charge and discharge rates of the cell containing such electrolyte. Other disadvantages have included melting point higher than rt, which constrains applications of such materials to a limited number. A very low lithium cation transference number (less than 0.1) that impacts charge–discharge cycle efficiency has also been an issue.
In this paper we introduce for the very first time a new class of ILs potentially able (due to its atomic and electronic structure) to overcome the majority of existing electrochemical disadvantages of this kind of materials. Also a low content of fluorine in the proposed electrolyte composition might create a new added value of “green” aspect of ILs.
2. Experimental
2.1. Synthesis
M = 296.25 g mol−1; Tm = 334.16 K; ΔHm = 52.84 kJ mol−1; Tg = 174.84 K; ΔCp = 280 J mol−1 K−1.
Elemental analysis: found: C, 49.0; N, 28.3; H, 4.0. Calc. for C12H11N6F3: C, 48.7; N, 28.3; H, 3.7%.
1H NMR: δH(400 MHz; d6-acetone; Me4Si): 1.561 (3H, t, 3JHH = 7.2 Hz, N-CH2CH3), 4.061 (3H, s, N-CH3), 4.403 (2H, q, 3JHH = 7.2 Hz, N-CH2CH3), 7.734 (2H, d, 3JHH = 28.8 Hz, N-CHCH-N), 9.066 (1H, s, N-CH-N).
13C NMR: δC(100 MHz; d6-acetone; Me4Si): 15.475, 36.580, 45.710, 116.056, 120.052, 123.056, 124.739, 137.002, 148.844, 206.468.
M = 310.28 g mol−1; Tm = 286.85 K; ΔHm = 28.09 kJ mol−1; Tg = 203.81 K; ΔCp = 246 J mol−1 K−1.
Elemental analysis: found: C, 50.0; N, 26.9; H, 4.2; calc. for C13H13N6F3: C, 50.3; N, 27.1; H, 4.2%.
1H NMR: δH(400 MHz; d6-acetone; Me4Si): 0.943 (3H, t, 3JHH = 7.2 Hz, CH2CH3), 1.981 (2H, hex, 3JHH = 7.2 Hz, CH2CH2CH3), 4.067 (3H, s, N-CH3), 4.309 (2H, t, 3JHH = 7.2 Hz, N-CH2CH2), 7.720 (2H, d, 3JHH = 19.2 Hz, N-CHCH-N), 9.068 (1H, s, N-CH-N).
13C NMR: δC(100 MHz; d6-acetone; Me4Si): 10.598, 23.915, 36.565, 51.853, 115.942, 119.954, 123.260, 124.663, 137.100, 148.749, 206.892.
M = 324.30 g mol−1; no Tm; Tg = 203.63 K; ΔCp = 311 J mol−1 K−1.
Elemental analysis: found: C, 51.8; N, 25.8; H, 4.6; calc. for C14H15N6F3: C, 51.8; N, 25.9; H, 4.6%.
1H NMR: δH(400 MHz; d6-acetone; Me4Si): 0.877 (3H, t, 3JHH = 7.2 Hz, CH2CH3), 1.302 (2H, hex, 3JHH = 7.6 Hz, CH2CH2CH3), 1.809 (2H, tt, 3JHH = 7.2 Hz, 3JHH = 7.6 Hz, CH2CH2CH2), 3.943 (3H, s, N-CH3), 4.152 (2H, t, 3JHH = 7.2 Hz, N-CH2CH2-), 7.375 (2H, m, N-CHCH-N), 9.025 (1H, s, N-CH-N).
13C NMR: δC(100 MHz; d6-acetone; Me4Si): 13.427, 19.759, 32.477, 36.557, 50.147, 115.950, 119.954, 123.268, 124.648, 137.085, 148.756, 206.816.
2.2. Salt characterization
Salts were characterized with differential scanning calorimetry (DSC) on TA Instruments Q200DSC apparatus and with thermogravimetric analysis (TGA) on TA Instruments Q600SDT apparatus. The heating rate in both cases was equal to 10 K min−1.1H NMR, 13C NMR and 19F NMR experiments were performed on Varian Gemini 200. 1H shifts are reported relative to TMS (δ = 0), 13C chemical shifts are reported relative to CD3CN (δ = 1.3). The 19F shifts are described with CFCl3 as the reference (δ = 0).
Elemental analysis was conducted by the combustion method with PerkinElmer 2400 series II CHNS/O Elemental Analyzer, using imidazole as reference sample, while working in CHN mode. Argon carrier gas was used, providing <0.4% accuracy and <0.3% precision. Three samples of 10 mg were used for measurement and the results were averaged.
Trace moisture content of below 50 ppm level was determined with Karl Fischer titration method. Chloride content of below 20 ppm level was determined using the potentiometric method.
2.3. X-Ray crystallography
Selected single crystals were mounted in inert oil and transferred to a cold gas stream of a diffractometer. Diffraction data were measured at 100(2) K with graphite-monochromated MoKα (EMImTDI) or mirror monochromated CuKα (LiTDI–PMImTDI and LiTDI–BMImTDI) radiation on the Oxford Diffraction Gemini A Ultra diffractometer. Cell refinement and data collection as well as data reduction and analysis were performed with CRYSALISPRO.19 The structures were solved by direct methods with SHELXS–97.20 Full-matrix least-squares refinement method against F2 values were carried out by using SHELXL–9720 and OLEX221 programs. All non hydrogen atoms were refined with anisotropic displacement parameters. Hydrogen atoms were added to the structure model at geometrically idealized coordinates and refined as riding atoms. The crystal data and structure refinement parameters are given in Table S1 (ESI†).![[1 with combining macron]](https://www.rsc.org/images/entities/char_0031_0304.gif) , a = 8.63283(15) Å, b = 8.86281(12) Å, c = 10.25772(13) Å, α = 87.4723(11)°, β = 78.8034(13)°, γ = 66.0794(15)°, V = 703.24(2) Å3, Z = 2, μ(MoKα) = 0.119 mm−1, Dcalc. = 1.399 g cm−3, 111
, a = 8.63283(15) Å, b = 8.86281(12) Å, c = 10.25772(13) Å, α = 87.4723(11)°, β = 78.8034(13)°, γ = 66.0794(15)°, V = 703.24(2) Å3, Z = 2, μ(MoKα) = 0.119 mm−1, Dcalc. = 1.399 g cm−3, 111![[thin space (1/6-em)]](https://www.rsc.org/images/entities/char_2009.gif) 869 reflections measured (7.24 ≤ 2Θ ≤ 58.98), 3902 unique (Rint = 0.0237). The final R1 was 0.0408 (I > 2σ(I)) and wR2 was 0.1090 (all data).
869 reflections measured (7.24 ≤ 2Θ ≤ 58.98), 3902 unique (Rint = 0.0237). The final R1 was 0.0408 (I > 2σ(I)) and wR2 was 0.1090 (all data).
![[1 with combining macron]](https://www.rsc.org/images/entities/char_0031_0304.gif) , a = 8.28368(13) Å, b = 11.45842(18) Å, c = 12.57923(20) Å, α = 74.9663(14)°, β = 77.5238(13)°, γ = 78.6965(13)°, V = 1113.43(3) Å3, Z = 2, μ(CuKα) = 1.157 mm−1, Dcalc. = 1.498 g cm−3, 60
, a = 8.28368(13) Å, b = 11.45842(18) Å, c = 12.57923(20) Å, α = 74.9663(14)°, β = 77.5238(13)°, γ = 78.6965(13)°, V = 1113.43(3) Å3, Z = 2, μ(CuKα) = 1.157 mm−1, Dcalc. = 1.498 g cm−3, 60![[thin space (1/6-em)]](https://www.rsc.org/images/entities/char_2009.gif) 286 reflections measured (7.38 ≤ 2Θ ≤ 133.34), 3923 unique (Rint = 0.0330). The final R1 was 0.0275 (I > 2σ(I)) and wR2 was 0.0711 (all data).
286 reflections measured (7.38 ≤ 2Θ ≤ 133.34), 3923 unique (Rint = 0.0330). The final R1 was 0.0275 (I > 2σ(I)) and wR2 was 0.0711 (all data).
![[1 with combining macron]](https://www.rsc.org/images/entities/char_0031_0304.gif) , a = 8.42410(11) Å, b = 11.66815(17) Å, c = 12.85431(18) Å, α = 73.0547(13)°, β = 74.4505(12)°, γ = 76.7560(12)°, V = 1148.67(3) Å3, Z = 2, μ(CuKα) = 1.137 mm−1, Dcalc. = 1.493 g cm−3, 80
, a = 8.42410(11) Å, b = 11.66815(17) Å, c = 12.85431(18) Å, α = 73.0547(13)°, β = 74.4505(12)°, γ = 76.7560(12)°, V = 1148.67(3) Å3, Z = 2, μ(CuKα) = 1.137 mm−1, Dcalc. = 1.493 g cm−3, 80![[thin space (1/6-em)]](https://www.rsc.org/images/entities/char_2009.gif) 701 reflections measured (7.36 ≤ 2Θ ≤ 133.4), 4047 unique (Rint = 0.0330). The final R1 was 0.0298 (I > 2σ(I)) and wR2 was 0.0721 (all data).
701 reflections measured (7.36 ≤ 2Θ ≤ 133.4), 4047 unique (Rint = 0.0330). The final R1 was 0.0298 (I > 2σ(I)) and wR2 was 0.0721 (all data).
2.4. Electrolytes characterization
Ionic conductivity measurements were performed using electrochemical impedance spectroscopy (EIS) in the nearest full 10 °C over a melting point up to 70 °C temperature every 10 °C, over a full range of concentration of LiTDI (pure IL, 0.0125, 0.025, 0.0375, 0.05, 0.075, 0.1, 0.125 and 0.15 mole fraction, the last being the maximum LiTDI solubility in all ILs). Electrolytes were placed into micro conductivity cells with a cell constant equal to 0.5 cm−1 which were put to a cryostat–thermostat system (Haake K75 with the DC50 temperature controller). All impedance measurements were carried out on a computer-interfaced multichannel potentiostat with frequency response analyzer option Bio-Logic Science Instruments VMP3 within 500 kHz–1 Hz frequency range with 10 points per decade and with 5 mV a.c. signal. Measurements were repeated with independently prepared samples to improve the consistency of data, obtaining maximum differences of 5%.Lithium cation transference numbers (t+) were calculated using a d.c. polarization method combined with an a.c. impedance method introduced by Bruce and Vincent.22 Details can be found in the ESI.†
Linear sweep voltammetry (LSV) was used to investigate the electrochemical stability window. Samples of electrolyte were sandwiched between the lithium metal electrodes used as both counter and reference electrode and platinum electrode as a working electrode (Pt electrode surface was 0.1 cm2). LSV was performed every time with 1 mV s−1 scan rate at ambient temperature for PMImTDI and BMImTDI and at 70 °C in case of EMImTDI (due to its high melting point). The cyclic voltammetry results of neat ionic liquids are available in the ESI.†
Viscosity experiments were performed with Physica MCR301 Anton Paar Rheometer with CP40 cone tip and thermoelectric heat pump base for thermostating. Each time the 0.4 ml volume (excess) of the given electrolyte was used, thermostated with precision of 0.1 °C at each temperature and measured in a shearing rate of 10–1000 s−1.
The symbols of the mixture compositions will be used subsequently for clarity of text throughout descriptions of conductivity, viscosity and transference numbers in the Results and discussion. The system of symbols is made as follows: the first letter is the abbreviation of alkyl chain in the cation: E – ethyl, P – propyl, B – butyl; the number means the amount of thousandths of LiTDI molar fraction in the mixture of LiTDI and IL, e.g.: P0 means pure PMImTDI, E50 means LiTDI0.05EMImTDI0.95 and B125 means LiTDI0.125BMImTDI0.875. xMIm means any 1-alkyl-3-methylimidazolium cation.
3. Results and discussion
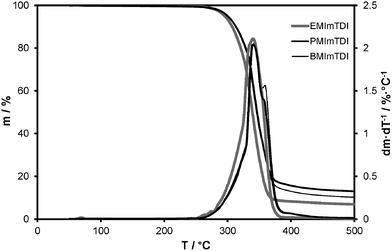
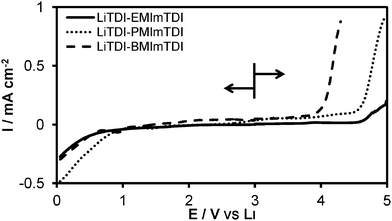
ILs exhibited stability up to about 250 °C, as seen in Fig. 2. EMImTDI has the DTG decomposition onset at 253 °C, PMImTDI at 251 °C and BMImTDI at 247 °C. Similar structures of cations and identical anion are probably the main reason for such small differences among them. These values are also very close to the LiTDI decomposition temperature (256 °C). On the DTG curves three different regions can be observed. The first one is very slow, with the highest weight percentage loss for EMImTDI. The second one is the main region of decomposition with a very similar weight loss rate for all compounds—still EMImTDI takes the fastest weight loss. Subsequently, one more decomposition phase takes place which can be observed as a very narrow DTG signal for EMImTDI, as a widening of the main signal in case of PMImTDI and as a distinct one for BMImTDI. EMImTDI has the fastest weight loss in the first two phases and negligible one in the third phase. The other two compounds have the same weight loss for the first two signals and noticeably different weight loss for the third phase—with BMImTDI taking the most significant weight loss in the last one. The observations described above are in good agreement with findings by Chowdhury and Thynell.23 Methyl elimination from xMIm cations is responsible for the initial weight loss of about 5% (first DTG peak integral), which is in concert with the methyl group share of IL weight. The main step is probably the decomposition of the TDI anion18 and the last step is assumed to be elimination of the alkyl group (ethyl, propyl or butyl, according to the cation). Thus, the main products of the decomposition are alkanes and their decomposition products (not known to be toxic), as well as TDI anion decomposition products. The latter are considered safer than PF6− anion decomposition products, if only because of fewer fluorine atoms per molecule and no phosphor used. Hence, neither phosphines nor highly toxic fluorinated phosphines are produced, like in the case of LiPF6.The electrochemical stability in the case of EMImTDI and PMImTDI is sufficient for application in all state-of-the-art electrode materials for lithium-ion cells. The results of linear sweep voltammetry experiments performed on the 0.1 molar LiTDI mixtures with ILs are shown in Fig. 3. The stability limits of these mixtures reach 4.6, 4.6 and 4.0 V vs. Li for LiTDI–EMImTDI, LiTDI–PMImTDI and LiTDI–BMImTDI, respectively. The main influence here can be attributed to the anion—the LiTDI salt has a 4.7 V stability boundary.18 There is lack of other LSV signals down to 0.6, 0.8 and 0.6 V vs. Li in the case of LiTDI–EMImTDI, LiTDI–PMImTDI and LiTDI–BMImTDI, respectively, showing good electrochemical stability and a wide stability window.
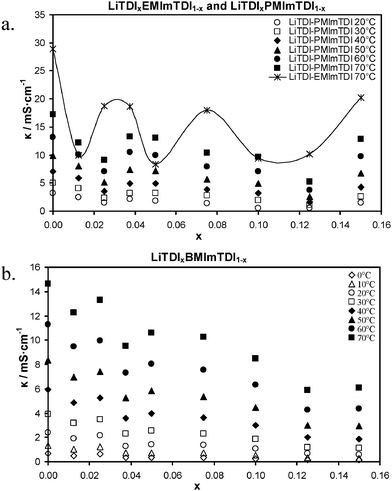
Fig. 4 shows a comparison of ionic conductivity plots for pure IL and LiTDI-doped electrolytes. We can see that the highest ionic conductivity at a given temperature (70 °C) was measured for EMImTDI and its mixtures with LiTDI. Pure IL reachs an ionic conductivity of 28.9 mS cm−1 (E0). After addition of a salt conductivity value change to 18.6–18.7 mS cm−1 in the case of E25 and E37, 18.0 mS cm−1 for E75 and as much as 20.3 mS cm−1 for E150. To the best of our knowledge, such high (compared to pure IL) conductivities have never been seen before in ILs after lithium salt addition, especially at such high molar fractions of lithium salt. The ionic conductivity curves of LiTDI–PMImTDI and LiTDI–BMImTDI mixtures show a similar shape to the LiTDI–EMImTDI one. In their case, though, the conductivity values at a given temperature are lower. At 70 °C they exhibit ionic conductivity values of 17.3 and 14.6 mS cm−1 for P0 and B0, respectively. The same result is initially obtained upon addition of LiTDI, i.e. minor decrease in conductivity. In the case of PMImTDI, after addition of a large fraction of LiTDI, at P37 composition, the conductivity reaches 13.3 mS cm−1 at 70 °C. In the case of BMImTDI, the conductivity reaches 13.3 mS cm−1 at 70 °C already at B25 (at the lower concentration of salt). Further addition of LiTDI to PMImTDI results in slow decrease in conductivity (down to 5.2 mS cm−1 for P125), until it reaches maximum solubility of 0.15 mole fraction. At this point (P150) ionic conductivity increases up to 12.8 mS cm−1 at 70 °C. BMImTDI after LiTDI addition to B25 also suffers ionic conductivity decrease, but to a less extent. Similar to LiTDI–PMImTDI mixture, LiTDI–BMImTDI is also subject to ionic conductivity increase near the LiTDI maximum solubility point – 6.1 mS cm−1 for B150 vs. 5.9 mS cm−1 for B125, both at 70 °C. Ionic conductivity dependence of the salt concentration plot shape is similar at all temperatures for a given ionic liquid. Room temperature parameters of the aforementioned points at 20 °C for LiTDI–PMImTDI mixtures exhibit conductivities of 3.2, 2.1, 1.5 mS cm−1 for P0, P37 and P150, respectively. At 20 °C, the LiTDI–BMImTDI mixtures show ionic conductivity values of 2.4, 2.2, 1.4 and 0.7 mS cm−1 for B0, B25, B50 and B150, respectively.
Recently, such beneficial conductivity plateau (similar to those presented in Fig. 4), have been explained by our group24 and assigned to ionic associates formation and cation–solvent interactions for LiTDI–solvent systems.
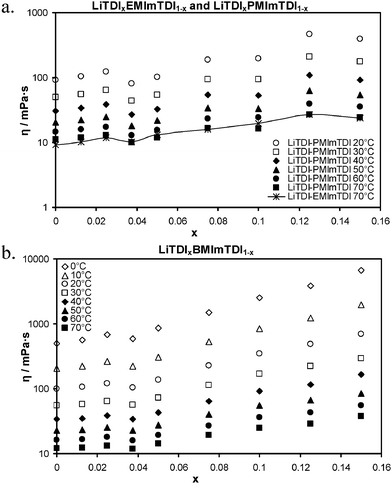
Fig. 5 displays the results of viscosity measurements. The shape of ionic conductivity curve is in agreement with the viscosity plots. As can be easily noticed, the viscosity plots show an almost perfect reflecting picture of the conductivity curves. The viscosity plots are also quite interesting, showing almost-plateau areas and even distinct declines in areas of intermediate local conductivity maxima in all mixtures. The increase of ionic conductivity values in the area of maximum LiTDI solubility (around 0.15 molar fraction) is reflected by drop of the viscosity value in case of E150 and P150. Similarly, only a slight increase of viscosity in the case of B150 takes place instead of a typical dynamic increase (geometric growth) at maximum solubility. Similar behavior can be observed for LiTDI–EMImTDI and LiTDI–PMImTDI mixtures. Starting with 9.1 mPa s at 70 °C for E0, viscosity is increasing with the first addition of LiTDI, rising to 11.8 mPa s for E25, then dropping to 10.1 mPa s for E37. Further addition of salt causes the monotonic viscosity to increase up to 16.0 mPa s for E75. The viscosity of EMImTDI mixtures increases, though slowly, but for PMImTDI it descends to 16.4 mPa s at P100. For comparison, P75 exhibits 16.7 mPa s viscosity value. The values at the highest concentrations are almost the same for both ILs – 26.9 and 27.1 mPa s for E125 and P125, as well as 24.0 and 24.4 mPa s for E150 and P150 mixtures, respectively. The viscosity plots of BMImTDI mixtures exhibit a smaller number of changes. At 70 °C it shows a viscosity value of 12 mPa s in the case of pure IL (B0). After addition of LiTDI, this value increases to 12.3 mPa s for B12 and 13.3 mPa s for B25. After further additions of LiTDI the viscosity value drops as low as 11.9 mPa s in the case of B37 mixture. With the increase of salt fraction in the mixture, viscosity keeps growing monotonically up to a maximum solubility at B150, at which the viscosity value equals 37.9 mPa s.
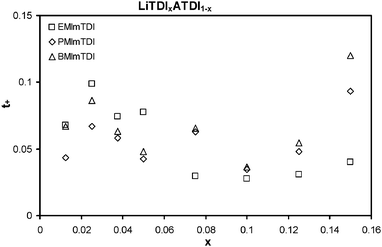
Fig. 6 shows the results of lithium cation transference number (tLi+) measurements. The investigated electrolytes offer superior values of tLi+ when compared to other ILs.25,26 The highest measured value is 0.120 for B150, which is indeed an excellent value for good-conducting ILs. For comparison, the common values of tLi+ for most state-of-the-art ILs are in the 0.02–0.04 range.25 LiTDI–BMImTDI has the highest values of all three presented ILs for LiTDI molar fractions 0.075 and higher. For lower fractions of LiTDI, the best tLi+ performance belongs to LiTDI–EMImTDI mixtures, which exhibit tLi+ values up to 0.099 (E25). Generally, all ILs mixed with LiTDI have the same lithium cation transference number plot shapes. They all start with quite low values at 0.0125 LiTDI molar fraction, then after addition to 0.025 the molar fractions increase very quickly to reach maxima. Such extrema are absolute maximum in the case of LiTDI–EMImTDI and second to value at maximum solubility in the case of LiTDI–PMImTDI and LiTDI–BMImTDI. Thus, E25 has the tLi+ value of 0.099, P25 – 0.067 and B25 – 0.086. Afterwards, when LiTDI is added, the tLi+ values for all ILs generally decrease, but reach a local maximum at 0.05–0.075 LiTDI molar fraction (tLi+ values: E50 – 0.077, P75 – 0.063 and B75 – 0.065). After reaching a global minimum at 0.1 molar fraction, the tLi+ values increase upon further LiTDI salt addition to obtain maxima at maximum solubility—0.15 molar fraction. These maxima are global for P and B mixtures, 0.093 and 0.120, for P150 and B150, respectively, and local for E mixtures—0.040 for E150. The usual relationship between tLi+ and ionic conductivity values is more or less reciprocal. What is uncommon in the presented mixtures is the combined increase of both these quantities at low LiTDI concentrations and at the maximum solubility of LiTDI. It means the possibility to obtain the highest values of cell-usable conductivity—lithium cation conductivity, σLi+. This quantity is obtained by multiplying the values of the lithium cation transference number and ionic conductivity at the same concentrations. Thus, the top values of lithium cation conductivity can be found at low salt concentrations: E25, P37, B25, as well as at maximum solubility (E150, P150, B150).
These three phenomena—ionic conductivity plots with high retained conductivity upon lithium salt addition, uncommon ionic conductivity—viscosity and ionic conductivity, cation transference number relations, can be explained by the special, “tailored” structure of the TDI anion. It was especially dedicated to electrolyte applications, which were designed to have the lowest possible coordinating properties, i.e. uniformed charge distribution, weakened ionic interactions. Use of the same anion in lithium salt and in IL may also result in specific interactions between salt and solvent. Especially interesting is the viscosity decline at the maximum solubility point, which is also worth noting, at the same molar fraction for all ILs. It has, to our best knowledge, never been seen before combined together with a high transference number, as in the mixtures presented herein. Our assumption is that, due to the earlier findings,27–30 the maximum solubility ratio is defined by the ratio at which the lithium cation is fully solvated by the IL anions. In that case there are two possibilities. One is that 1![[thin space (1/6-em)]](https://www.rsc.org/images/entities/char_2009.gif) :
:![[thin space (1/6-em)]](https://www.rsc.org/images/entities/char_2009.gif) 6 ratio (0.143 molar fraction of LiTDI in IL) is the effect of coordinating lithium by six anions, which was suggested by some researchers.31 This is a less probable assumption due to our structural findings presented herein—in the case of nitrogen ligation centers, the coordinating number of the lithium cation is four (see below), which is in concert with other works.27,29 If it is fully coordinated, then for every one lithium cation there will be four anions coordinated with it [Li(TDI)43−] through a direct bonding and three TDI anions and six IL cations not coordinated directly. As it has been shown many times before, IL ions are usually forming agglomerates and it is quite common for them to exist in the form of triplets—of C2A+ and CA2− type. Hence, it would be probable for them to be in such form also in the mixtures presented here and to form triplets of, e.g. EMIm2TDI+ form, keeping the whole electrolyte neutral in the charge terms. Then the 1
6 ratio (0.143 molar fraction of LiTDI in IL) is the effect of coordinating lithium by six anions, which was suggested by some researchers.31 This is a less probable assumption due to our structural findings presented herein—in the case of nitrogen ligation centers, the coordinating number of the lithium cation is four (see below), which is in concert with other works.27,29 If it is fully coordinated, then for every one lithium cation there will be four anions coordinated with it [Li(TDI)43−] through a direct bonding and three TDI anions and six IL cations not coordinated directly. As it has been shown many times before, IL ions are usually forming agglomerates and it is quite common for them to exist in the form of triplets—of C2A+ and CA2− type. Hence, it would be probable for them to be in such form also in the mixtures presented here and to form triplets of, e.g. EMIm2TDI+ form, keeping the whole electrolyte neutral in the charge terms. Then the 1![[thin space (1/6-em)]](https://www.rsc.org/images/entities/char_2009.gif) :
:![[thin space (1/6-em)]](https://www.rsc.org/images/entities/char_2009.gif) 6 ratio of saturated LiTDI–IL mixture (0.143 LiTDI molar fraction) would be a result of 1
6 ratio of saturated LiTDI–IL mixture (0.143 LiTDI molar fraction) would be a result of 1![[thin space (1/6-em)]](https://www.rsc.org/images/entities/char_2009.gif) :
:![[thin space (1/6-em)]](https://www.rsc.org/images/entities/char_2009.gif) 4 coordinated lithium cation and the rest of cations and anions would be forming triplet type agglomerates. Such agglomerates would be more immobile than individual ions and as such, giving the lithium cation a chance to have a higher transference number as well as relatively better mobility. As a result, lower viscosity and higher ionic conductivity would be achieved.
4 coordinated lithium cation and the rest of cations and anions would be forming triplet type agglomerates. Such agglomerates would be more immobile than individual ions and as such, giving the lithium cation a chance to have a higher transference number as well as relatively better mobility. As a result, lower viscosity and higher ionic conductivity would be achieved.
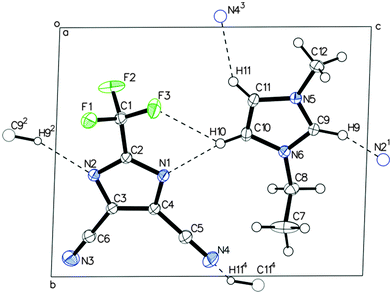
Crystallographic analyses were performed on the EMImTDI pure IL, as well as LiTDI–PMImTDI and LiTDI–BMImTDI complexes. The crystallographic details can be found in the ESI.† Single crystals of EMImTDI were obtained by recrystallization from methanol solutions. Single crystals of compounds LiTDI–PMImTDI and LiTDI–BMImTDI suitable for X-ray diffraction analysis were grown at rt from a LiTDI0.5PMImTDI0.5 and LiTDI0.5BMImTDI0.5 composition. X-Ray crystal structure determination of EMImTDI, reveals planar layers of cations and anions interacting through hydrogen bonds (Fig. 7).
The TDI anion makes four in-plane hydrogen bonds to methylene hydrogen atoms of cations at the C9, C10 and C11 positions. Namely, a short, bifurcated contact between the hydrogen atom at C10 and N1/F3 atoms, a hydrogen bond between H9 and imidazole nitrogen atom N2, and short contact methylene hydrogen atom H11 and nitrile nitrogen N4. The layers are stacked one above the other in the ABAB fashion through ionic interactions between cations and anions from adjacent layers.
Lithium electrolytes formed by addition of LiTDI salt to PMImTDI (2) and BMImTDI (3) ILs crystallize in the triclinic space group P![[1 with combining macron]](https://www.rsc.org/images/entities/char_0031_0304.gif) as colorless plates. In both cases, single crystal X-ray analysis showed a novel 1D ladder-like assembly of the [Li(TDI)2]nn− polyanions as depicted in Fig. 8.
as colorless plates. In both cases, single crystal X-ray analysis showed a novel 1D ladder-like assembly of the [Li(TDI)2]nn− polyanions as depicted in Fig. 8.
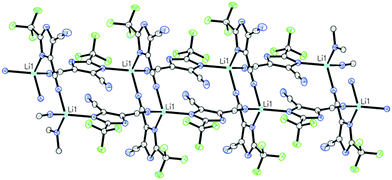 | ||
| Fig. 8 Perspective view of the ladder-like polyanionic [Li(TDI)2]nn− chain observed in the crystal structure of 2 (LiTDI–PMImTDI) and 3 (LiTDI–BMImTDI). | ||
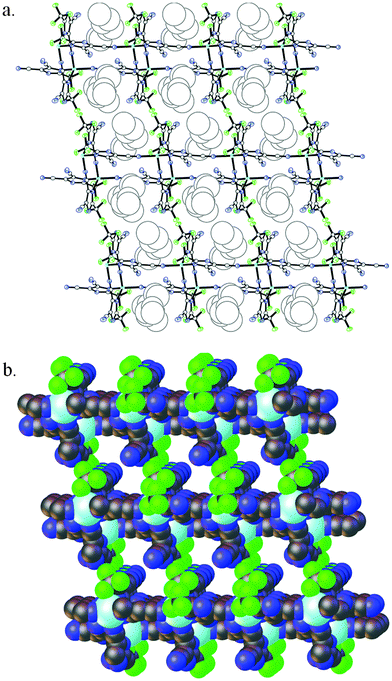
Lithium cations adopt distorted tetrahedral geometry and are linked via two bridging dicyanoimidazolato ligands forming characteristic dimeric units with a ten-membered Li(NCCN)2Li ring.32 The central ring is planar with r.m.s. deviations from planarity of 0.012 Å for both 2 and 3. Dimeric units are linked to each other through the spanning TDI anions which are coordinated in an unsymmetrical fashion through the nitrogen atom of the imidazole ring and one of the cyano groups. Consequently, the ladder-like 1D coordination polymer propagates in the direction of the X axis, with the Li–Li distance along the chain being equal to the a cell parameter, 8.2837(2) and 8.4241(1) Å for 2 and 3 respectively. Polyanions are arranged in column-type fashion with perpendicular channels occupied by imidazolium cations as shown in Fig. 9.
The coordination polymers in structures 2 and 3 are characteristic of and consistent with observations made by Henderson31 for LiTFSI–xMImTFSI system (coordination number = 6). It is worth stressing that in the case of LiTDI–xMImTDI system the coordination sphere is completely different, due to the presence of nitrogen donor centers. The oordination number in our case is 4 (with one additional fluorine dative bond). Unlike LiTFSI–xMImTFSI, in the case of LiTDI–xMImTDI system the TDI anion enforces formation of dimeric moieties (Li2TDI2) which are subsequently linked via bridging TDI anionic ligands.
This allows implying that addition of the IL effects in this coordination polymer [Li(TDI)2n−] the dissociation. At first, due to coordination polymer interaction with TDI anions, the dimeric structure is retained after fulfilling the coordination sphere. As the effect of that we assume formation of Li2TDI64− species (double triplets). The unusual conductivity plot could be a consequence of the existence of such dimers in a more concentrated solution. During further dissolution one might expect the occurrence of equilibria with lithium mononuclear complexes LiTDI43−.
Noteworthy, almost identical crystal structures are observed for different organic cations. This fact proves the stability of the anionic coordination polymers formed. Thus, the observed crystal structure assembly of the described species is directed by the acidic lithium center interacting with TDI anions.
4. Conclusions
We have presented three new ILs based on our anion “tailored” for electrochemical applications: EMImTDI, PMImTDI and BMImTDI. All three ILs are thermally and electrochemically stable. They also contain less fluorine than the industry standard (PF6−), which is bound in a more stable way than with P–F or B–F bonds. The lithium electrolytes formed by the addition of LiTDI salt to these ILs reach high ionic conductivity—over 3 mS cm−1 at 20 °C. The new IL-based electrolytes exhibit good lithium cation transference numbers (over 0.1) overlapping with high ionic conductivity. Negligible change of the ionic conductivity upon lithium salt addition (less than 10% instead of few-fold decrease)33 combined with high ionic conductivity has never been seen before. As a result, we introduce a safe, effective and in many aspects environmentally friendly completely new class of electrolytes.Acknowledgements
This work was financially supported by Warsaw University of Technology. This work has been supported by the European Union in the framework of European Social Fund through the Warsaw University of Technology Development Programme, realized by the Center for Advanced Studies.References
- M. Armand and J.-M. Tarascon, Nature, 2008, 451, 652 CrossRef CAS PubMed.
- B. Scrosati, J. Hassoun and Y. K. Sun, Energy Environ. Sci., 2011, 4, 3287 CAS.
- V. Etacheri, R. Marom, R. Elazari, G. Salitra and D. Aurbach, Energy Environ. Sci., 2011, 4, 3243 CAS.
- M. Egashira, B. Scrosati, M. Armand, S. Béranger and C. Michot, Electrochem. Solid-State Lett., 2003, 6, A71 CrossRef CAS PubMed.
- L. Niedzicki, M. Kasprzyk, K. Kuziak, G. Z. Żukowska, M. Armand, M. Bukowska, M. Marcinek, P. Szczeciński and W. Wieczorek, J. Power Sources, 2009, 192, 612 CrossRef CAS PubMed.
- L. Niedzicki, M. Kasprzyk, K. Kuziak, G. Z. Żukowska, M. Marcinek, W. Wieczorek and M. Armand, J. Power Sources, 2011, 196, 1386 CrossRef CAS PubMed.
- L. Niedzicki, S. Grugeon, S. Laruelle, P. Judeinstein, M. Bukowska, J. Prejzner, P. Szczecinski, W. Wieczorek and M. Armand, J. Power Sources, 2011, 196, 8696 CrossRef CAS PubMed.
- M. Bukowska, P. Szczeciński, W. Wieczorek, L. Niedzicki, B. Scrosati, S. Panero, P. Reale, M. Armand, S. Laruelle and S. Grugeon, WO Pat., 023 413, 2010 Search PubMed; M. Bukowska, P. Szczeciński, W. Wieczorek, L. Niedzicki, B. Scrosati, S. Panero, P. Reale, M. Armand, S. Laruelle and S. Grugeon, Fr. Pat., 2 935 382, 2009 Search PubMed.
- D. W. McOwen, S. A. Delp, W. A. Henderson, Meeting Abstracts 2013, MA2013-02, 1182.
- P. Ribiere, S. Grugeon, M. Morcette, S. Boyanov, S. Laruelle and G. Marlair, Energy Environ. Sci., 2012, 5, 5271 CAS.
- R. Renner, Environ. Sci. Technol., 2001, 35, 410A CrossRef CAS.
- A. E. Visser, R. P. Swatloski, W. M. Reichert, R. Mayton, S. Sheff, A. Wierzbicki, J. H. Davis and R. D. Rogers, Environ. Sci. Technol., 2002, 36, 2523 CrossRef CAS.
- U. Domańska, in Ionic liquids in chemical analysis, ed. M. Koel, CRC Press Taylor & Francis Group, 2008, ch. 1 Search PubMed.
- J. P. Hallet and T. Welton, Chem. Rev., 2011, 111, 3508 CrossRef PubMed.
- N. Plechkova and K. Seddon, Chem. Soc. Rev., 2008, 37, 123 RSC.
- M. Armand, F. Enders, D. MacFarlane, H. Ohno and B. Scrosati, Nat. Mater., 2009, 8, 621 CrossRef CAS PubMed.
- A. Fernicola, F. Croce, B. Scrosati, T. Watanabe and H. Ohno, J. Power Sources, 2007, 174, 342 CrossRef CAS PubMed.
- L. Niedzicki, G. Z. Żukowska, M. Bukowska, P. Szczeciński, S. Grugeon, S. Laruelle, M. Armand, S. Panero, B. Scrosati, M. Marcinek and W. Wieczorek, Electrochim. Acta, 2010, 55, 1450 CrossRef CAS PubMed.
- CRYSALISPRO Software system, Agilent Technologies UK Ltd., Oxford, UK, 2012 Search PubMed.
- G. M. Sheldrick, Acta Crystallogr., Sect. A: Found. Crystallogr., 2008, 64, 112 CrossRef CAS PubMed.
- O. V. Dolomanov, L. J. Bourhis, R. J. Gildea, J. A. K. Howard and H. Puschmann, OLEX2: A complete structure solution, refinement and analysis program, J. Appl. Crystallogr., 2009, 42, 339 CrossRef CAS.
- P. Bruce and C. Vincent, J. Electroanal. Chem., 1987, 225, 1 CrossRef CAS.
- A. Chowdhury and S. T. Thynell, Thermochim. Acta, 2006, 443, 159 CrossRef CAS PubMed.
- L. Niedzicki, E. Karpierz, A. Bitner, M. Kasprzyk, G. Z. Zukowska, M. Marcinek and W. Wieczorek, Electrochim. Acta, 2014, 117, 224 CrossRef CAS PubMed.
- K. Hayamizu, Y. Aihara, H. Nakagawa, T. Nukuda and W. S. Price, J. Phys. Chem. B, 2004, 108, 19527 CrossRef CAS.
- T. Frömling, M. Kunze, M. Schönhoff, J. Sundermeyer and B. Roling, J. Phys. Chem. B, 2008, 112, 12985 CrossRef PubMed.
- O. Borodin, G. D. Smith and W. Henderson, J. Phys. Chem. B, 2006, 110, 16879 CrossRef CAS PubMed.
- J. Pitawala, J.-K. Kim, P. Jacobsson, V. Koch, F. Croce and A. Matic, Faraday Discuss., 2012, 154, 71 RSC.
- J. Scheers, J. Pitawala, F. Thebault, J.-K. Kim, J.-H. Ahn, A. Matic, P. Johansson and P. Jacobsson, Phys. Chem. Chem. Phys., 2011, 13, 14953 RSC.
- P. M. Dean, J. M. Pringle and D. R. MacFarlane, Phys. Chem. Chem. Phys., 2010, 12, 9144 RSC.
- Q. Zhou, K. Fitzgerald, P. D. Boyle and W. A. Henderson, Chem. Mater., 2010, 22, 1203 CrossRef CAS.
- M. Dranka, L. Niedzicki, M. Kasprzyk, M. Marcinek, W. Wieczorek and J. Zachara, Polyhedron, 2013, 51, 111 CrossRef CAS PubMed.
- A. Lewandowski and A. Świderska-Mocek, J. Power Sources, 2009, 194, 601 CrossRef CAS PubMed.
Footnote |
| † Electronic supplementary information (ESI) available. CCDC 940806–940808. For ESI and crystallographic data in CIF or other electronic format see DOI: 10.1039/c3cp55354j |
| This journal is © the Owner Societies 2014 |

