 Open Access Article
 This Open Access Article is licensed under a Creative Commons Attribution-Non Commercial 3.0 Unported Licence
Dye-sensitized solar cells using ethynyl-linked porphyrin trimers†
Tomofumi
Hamamura
a,
Joanne Ting
Dy
a,
Koichi
Tamaki
a,
Jotaro
Nakazaki
*a,
Satoshi
Uchida
b,
Takaya
Kubo
a and
Hiroshi
Segawa
*a
aResearch Center for Advanced Science and Technology, The University of Tokyo, 4-6-1, Komaba, Meguro-ku, Tokyo 153-8904, Japan. E-mail: cnakaz@mail.ecc.u-tokyo.ac.jp; csegawa@mail.ecc.u-tokyo.ac.jp; Fax: +81-3-5452-5299; Tel: +81-3-5452-5295
bCollege of Arts and Sciences, The University of Tokyo, 3-8-1, Komaba, Meguro-ku, Tokyo 153-8902, Japan
First published on 8th January 2014
Abstract
Toward the extension of the light-harvesting region of sensitizers in dye-sensitized solar cells (DSSCs), two ethynyl-linked porphyrin trimers were synthesized and investigated. The zinc–freebase–zinc trimer (Zn–FbA–Zn) showed an absorption maximum at a longer wavelength than the all-zinc trimer (Zn–ZnA–Zn), although the energy level of Zn–FbA–Zn was lower than that of Zn–ZnA–Zn. The DSSCs using these trimers showed spectral sensitivities up to 900 nm. Reflecting the energy levels of these trimers, the DSSC using Zn–ZnA–Zn showed better performance than that using Zn–FbA–Zn. After the optimization of cell fabrication conditions, the photoelectric conversion efficiency η of the DSSC using Zn–ZnA–Zn reached 3.17%. The larger TiO2 nanoparticles (ca. 37 nm) than the conventional cases (ca. 13 nm) were found to be preferable in this case, due to high molar extinction coefficients of the porphyrin trimers.
Introduction
Photo-energy conversion of dye-sensitized solar cells (DSSCs) is based on photo-excitation of sensitizers and following electron transfer reactions.1–3 For the improvement of the photo-energy conversion efficiency, expansion of the light absorption region of the dyes is important.4,5 Recently, some DSSCs using porphyrins as the sensitizers have been reported to exhibit relatively high energy conversion efficiency,6–9 whereas the photoelectric conversion is limited to the visible region. If the spectral sensitivities of the porphyrin-based sensitizers were extended to the near-IR region, the total photoelectric conversion efficiency of DSSCs could be improved. There have been several approaches to make the absorption bands of porphyrins more broad, by extending the π-conjugated systems of porphyrins. In the case of the “fused” approach, π-conjugated systems are extended effectively because of their coplanar structures.10–14 For example, fused porphyrin dimers show a broad absorption band exceeding 1200 nm.13 However, such modification of the π-systems of porphyrin causes a large perturbation of their properties. The fused porphyrin dimer showed a low quantum efficiency at the visible region. A large planar compound has a possibility of low solubility in organic solvents, making the preparation procedures difficult. Another approach to extend π-conjugated systems of porphyrins is the “oligomer” approach. In the case of porphyrin oligomers,15–20 it had been reported that the intense Soret band absorption became broader along with the increase in the number of porphyrin units. Among several types of porphyrin oligomers, ethynyl-linked porphyrin oligomers are attractive, in view of the effective π-conjugation through rigid ethynyl linkers. The ethynyl linkers are not only rigid but also provide the possibility of rotational motion around the axis, which could lead to a variety of properties based on rotational isomers. Optical properties of porphyrin oligomers have been intentionally documented since each porphyrin unit of the oligomers almost preserves the properties of its monomeric derivatives. Although there were some reports of the DSSCs based on porphyrin dimers,21–25 the absorption maxima of porphyrin dimers are shorter than 750 nm. Some ethynyl-linked porphyrin trimers17,20 were reported to show Q band absorption maxima at around 800 nm. Therefore, they could be utilized to achieve photoelectric conversion at the near-IR region. In this study, a zinc porphyrin trimer (Zn–ZnA–Zn) and a bis-zinc mono-freebase heteroporphyrin trimer (Zn–FbA–Zn) as shown in Fig. 1 have been synthesized to extend the light harvesting region. Freebase porphyrins are favorable for extending the absorption region, while zinc porphyrins are advantageous in the electron releasing reactions. The effect of the combination of these units has been investigated. | ||
| Fig. 1 Structure of the porphyrin trimers used in this study. | ||
Experimental section
Synthesis
The synthetic routes of the porphyrin trimers are shown in Scheme 1. The monomeric precursors of the ethynyl-linked porphyrin trimers were synthesized according to previously reported procedures. Sonogashira coupling of 2 and 5 yielded the first trimer Zn–FbE–Zn, which was metallated with zinc acetate dihydrate in a methanol–chloroform solution to give the trimer Zn–ZnE–Zn. Hydrolysis of the two trimers was achieved by treatment with sodium hydroxide in a methanol–tetrahydrofuran solution to give the target compounds Zn–FbA–Zn and Zn–ZnA–Zn. The detailed synthetic procedures are described in the ESI.† | ||
| Scheme 1 Synthetic routes for the ethynyl-linked porphyrin trimers. | ||
Optical spectroscopy
The UV-visible absorption spectra in solution and on TiO2 were recorded on a JASCO V-570 UV/Vis/NIR spectrophotometer. The steady-state fluorescence spectra were recorded on a Shimadzu RF-503A difference spectrofluorophotometer. To obtain the absorption spectra of the dyes on TiO2, transparent 3 μm-thick TiO2 films were prepared as is described in device fabrication. The absorption of the TiO2 film and the substrate was subtracted from the raw spectrum.Electrochemistry
Electrochemical measurements were performed by the differential pulse voltammetry (DPV) method on a BAS100 electrochemical analyzer. The voltammograms were recorded under argon flow using a 0.1 M nBu4NPF6 in CH2Cl2 as the supporting electrolyte. A two compartment cell connected by a salt bridge was employed containing the porphyrin solution, a platinum disk (BAS) working electrode and a Pt wire counter electrode in one cell, and an Ag/AgCl reference electrode in a saturated KCl aqueous solution in the other cell. Ferrocene/ferrocenium (0.53 V vs. Ag/AgCl) was used as the external potentiometric standard. All of the measured values were converted to the potentials vs. SCE.Device fabrication
The mesoporous titania films were prepared using commercial pastes of nanoporous anatase TiO2 (Ti-Nanoxide, Solaronix) with mean particle sizes of 13 nm and 400 nm for the transparent active layer and the opaque scattering layer, respectively. The pastes were coated by the screen-printing method onto a fluorine-doped SnO2 glass plate (FTO, Nippon Sheet Glass). The printed TiO2 film on glass was sintered at 500 °C for 30 min, treated with TiCl4 solution at 70 °C for 30 min, and sintered once more at 500 °C. For the photoanode preparation, the porphyrin dyes were adsorbed on TiO2 by immersing the TiO2 films into a 1.0 × 10⁻⁵ M dye solution in 1![[thin space (1/6-em)]](https://www.rsc.org/images/entities/char_2009.gif) :1 chloroform/ethanol (v/v) containing deoxycholic acid (DCA) with various concentrations at 30 °C for 24 h. The films were rinsed with the immersing solvent before use.
:1 chloroform/ethanol (v/v) containing deoxycholic acid (DCA) with various concentrations at 30 °C for 24 h. The films were rinsed with the immersing solvent before use.
For the measurement of absorption spectra, only transparent TiO2 nanoparticles were coated on the glass plate, and the film thickness was around 3 μm. In the case of the DCA concentration dependence investigation, both transparent and scattering nanoparticles were used with a total film thickness of 5 μm. For studies on the effect of the TiO2 nanoparticle size on the DSSC performance, nanoparticles with mean particle sizes of 13 nm and 37 nm were used to prepare films with thicknesses ranging from 4 to 25 μm.
The DSSC was assembled by injecting the electrolyte between the photoanode and a Pt-coated glass counter electrode (Geomatec). The gap of which was separated by a 30 μm spacer (Himilan, DuPont). The electrolyte was composed of 0.1 M LiI, 25 mM I2, 0.44 M 1,2-dimethyl-3-propylimidazolium iodide (DMPII) in acetonitrile. The active area of the cells used was 0.16 cm2.
Photovoltaic characterization
The photovoltaic properties of the cells were measured with a potentiostat (HSV-100, Hokuto Denko) using an AM 1.5G solar simulator (YSS-80, Yamashita Denso) for illumination. The light intensity was calibrated using a standard silicon cell (BS-520 S//N 235, Bunkoukeiki). The collected data were used to calculate the photoelectric conversion efficiency (η) according to the following equation: η = JSC × VOC × FF/Pin where JSC is the short-circuit photocurrent density, VOC is the open-circuit voltage, FF is the fill factor and Pin is the incident radiation power.The incident photon-to-current conversion efficiency (IPCE) spectra were measured using an IPCE measurement system (SM-250E, Bunkoukeiki). A standard silicon solar cell (SiPD S1337-1010BQ, Bunkoukeiki) was used as the reference and the IPCE values were obtained by comparing the current ratio and the IPCE value of the reference cell at each wavelength.
Electron lifetimes in the DSSCs were estimated by the stepped light induced transient measurement of photo-current and voltage (SLIM-PCV) method,26 using an Eko Instruments PSL-100 system. Transient response of the open-circuit voltage of the cells was measured by causing a minor change in the intensity of the irradiated laser (635 nm), which was fitted with a single exponential function, exp(−t/τc), where t and τc are time and electron lifetime, respectively.
Results and discussion
Comparison of trimers with different energy levels
The UV-visible absorption and fluorescence spectra of Zn–FbE–Zn and Zn–ZnE–Zn in CH2Cl2 are shown in Fig. 2. The absorption onsets of the synthesized trimers are at 870 nm, which is longer than that of the monomeric porphyrin (zinc derivative of intermediate compound 1) by 270 nm. The Q band absorption of the synthesized trimers (around 780 nm) is very intense, with the molar extinction coefficient ε of more than 105 M−1 cm−1, which is 25 times higher than that of the monomeric porphyrin. The absorption maximum in the Q band of Zn–FbE–Zn is located at 789 nm, which is longer than that of Zn–ZnE–Zn at 778 nm. This is the effect of the freebase porphyrin with smaller excitation energy in Zn–FbE–Zn. Zn–FbE–Zn has a pronounced peak at 671 nm, which is not seen in Zn–ZnE–Zn. A similar Q band spectral shape was also reported for the ethynyl-linked heterometallic porphyrin dimers,27 and the feature would be attributed to the heterometallic structure. In the short-wavelength region (350–520 nm), Soret (B) band splitting was observed. Such split Soret band has been explained on the basis of the exciton-coupling theory.28Fig. 3 illustrates the schemes for the exciton-coupling with a dimer model. Each porphyrin unit of the synthesized trimer has two transition dipole moments (Bx, By) in the porphyrin plane. Because of the excitonic coupling between the transition dipole moments along the bonding axis (Bx), the excited state is split, and the transition to the excited state with lower energy is allowed, resulting in the red-shifted absorption peak in the Soret band. On the other hand, the excitonic coupling between the transition dipole moments perpendicular to the bonding axis (By, Bz) depends on the dihedral angles between the porphyrin units, affording the shorter wavelength absorption peak. In the observed spectrum, the absorption peak at around 400–450 nm, which is attributed to the transition dipole moments perpendicular to the bonding axis, was broadened. In the case of the trimer with high coplanarity between the adjacent porphyrins, the transition dipole moments are arranged in parallel, leading the blue-shifted absorption derived from the allowed transition to the higher-energy excited state, while the transition dipole moments of the twisted trimer are similar to that of monomeric porphyrins. If the trimers with various dihedral angles exist, they should show the absorption peak at various wavelengths. As a result, the absorption peak would appear broadened. The observed spectra correspond to this consideration. Compared with the Soret band absorption of Zn–ZnE–Zn, Zn–FbE–Zn showed smaller splitting. The absorption intensity of Zn–FbE–Zn at 484 nm (ε ∼ 2.75 × 10⁵ M−1 cm−1) was lower than that of Zn–ZnE–Zn at 496 nm (ε ∼ 3.85 × 10⁵ M−1 cm−1). These features indicate weaker excitonic coupling in the heterometallic trimer. As seen in Fig. 2, the maximum emission of Zn–FbE–Zn is located at 836 nm, which is longer than that of Zn–ZnE–Zn found at 819 nm. This corresponds to the trend of the Q band absorption peaks and the Stokes shifts (Zn–ZnE–Zn: 0.08 eV; Zn–FbE–Zn: 0.09 eV) were almost the same. | ||
| Fig. 2 Absorption (solid line) and emission spectra (dashed line) of Zn–ZnE–Zn (thick line) and Zn–FbE–Zn (thin line) in CH2Cl2. | ||
 | ||
| Fig. 3 Schematic drawings for the explanation of split Soret band absorption on the basis of the exciton-coupling theory. | ||
It has been discussed on the basis of experimental data that the electronic structure of the ethynyl-linked porphyrin trimers depends largely on the dihedral angles between adjacent porphyrin units. To consider such effects, the ethynyl-linked porphyrin trimers without meso-substituents were subjected to the DFT calculations (Gaussian 09, B3LYP/6-31G(d)). In the fully optimized structure, the dihedral angle between the central porphyrin and one of the side porphyrins is 33.5°, measured at alpha–meso–meso–alpha carbons. In this case, the HOMO and the LUMO are distributed over the entire molecule although the coefficients at the central porphyrin are larger than those at the side porphyrins. By freezing the dihedral angles to 90°, the orthogonal conformer was calculated. As shown in Fig. S1 (ESI†), the total energy of the orthogonal conformer is higher than the fully optimized structure by 0.0034 au (0.094 eV). In the orthogonal conformer, the HOMO and the LUMO are localized on the central porphyrin, as shown on the right side of Fig. 4. The degenerated HOMO − 1 and HOMO − 2 are distributed to both the side porphyrins. The LUMO + 1 and the LUMO + 2 are also distributed to both the side porphyrins. Along with the planarization, these orbitals interact, and the energy levels split as shown in the plots in Fig. 4. At the dihedral angle of 5°, the energy level of the HOMO (−4.74 eV) is much higher than that in the orthogonal conformer (−5.15 eV), and the difference in the orbital energies between the HOMO and the corresponding interacted orbital (HOMO − 5) is 0.96 eV. The orbital energy of the LUMO (−2.84 eV) at 5° is lower than that in the orthogonal conformer (−2.52 eV). The total energy of the conformer with the dihedral angle of 5° is higher than the fully optimized structure by 0.0049 au (0.13 eV). As seen in Fig. S5 (ESI†), the distribution of the LUMO coefficients is similar at the dihedral angles of 10–70°, but the LUMO energies change about 0.2 eV as shown in Fig. 4. Although the extreme dihedral angles, such as 0° or 90°, would not appear at ambient temperatures, the rotation around the ethynyl linkers may affect energetically the performance of these dyes.
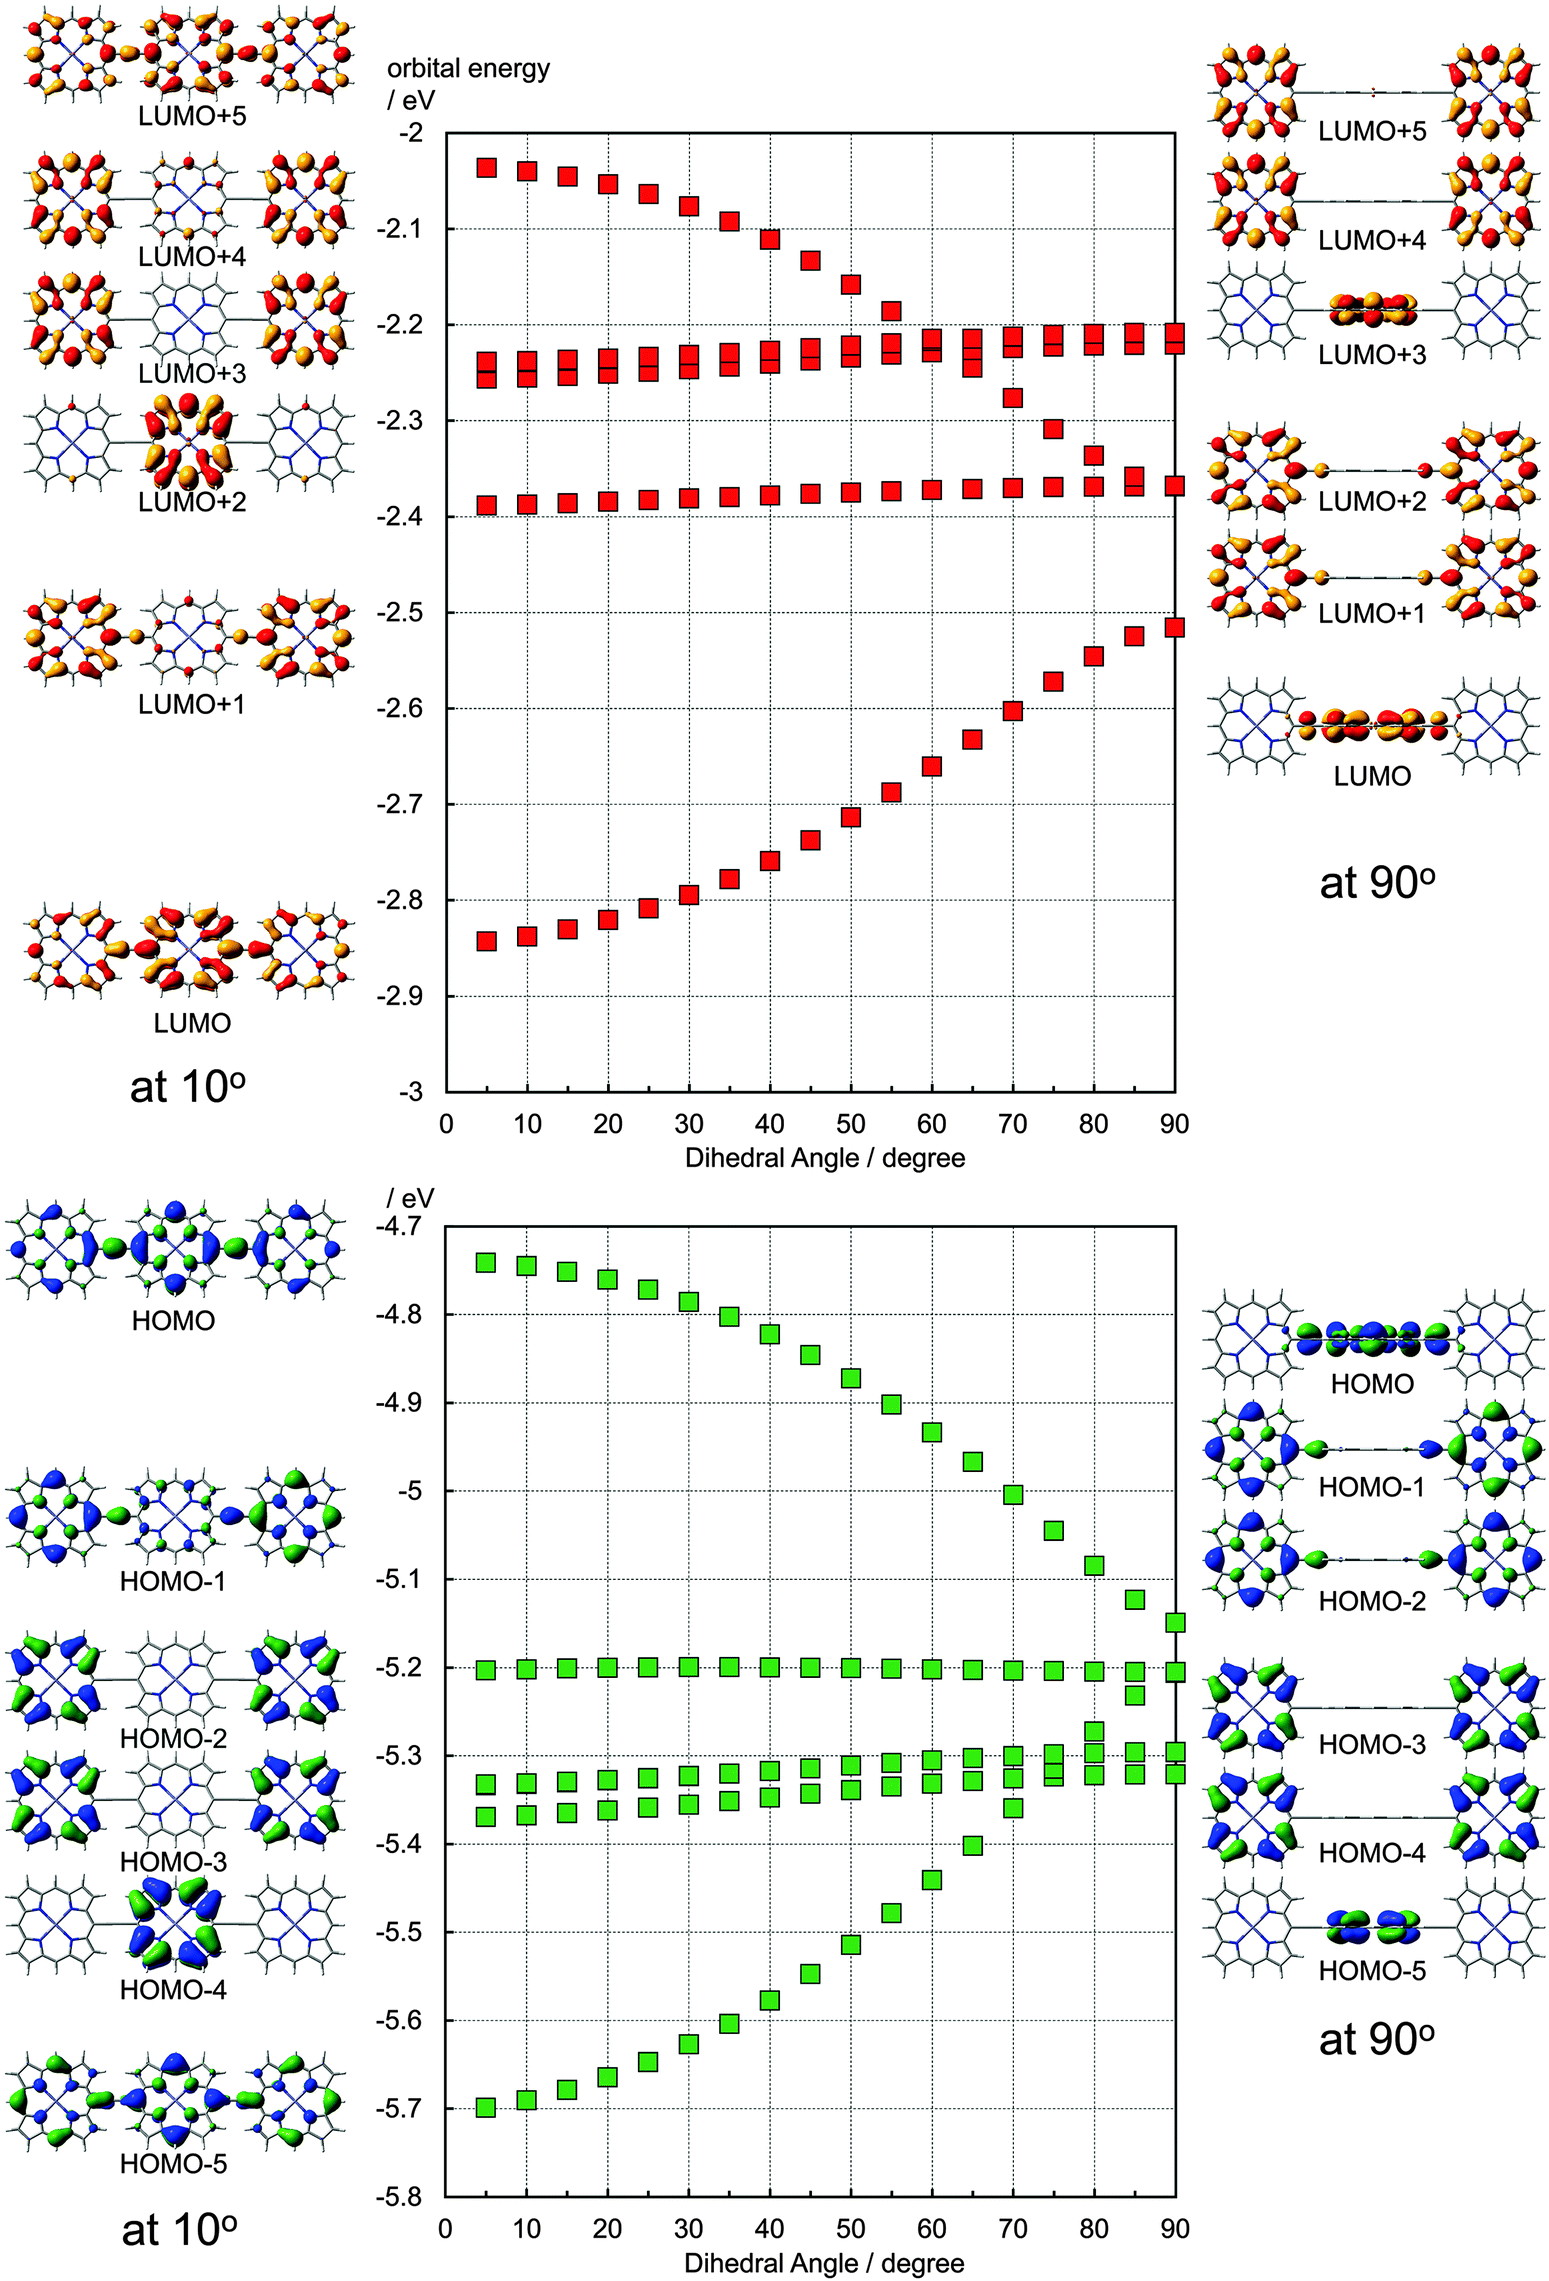 | ||
| Fig. 4 Calculated orbital energies of ethynyl-linked porphyrin trimers with various dihedral angles and the corresponding molecular orbitals at 10 degree and 90 degree by B3LYP/6-31G(d). | ||
To evaluate the energy levels of these dyes, the redox potentials of these trimers were measured by the differential pulse voltammetry (DPV) technique. The voltammograms are shown in Fig. S2 (ESI†), and the obtained redox potentials are summarized in Fig. 5 as the energy-level diagram of these trimers. The oxidation potentials of these trimers are anodic with respect to that of the iodide redox level (+0.2 V vs. SCE). These dyes, thus, have feasible energy levels for the regeneration process of the oxidized dyes by the iodide ions. The reduction potentials of these trimers were cathodic with respect to the TiO2 conduction band edge potential (−0.7 V vs. SCE) by 0.21 V (Zn–FbE–Zn) and 0.52 V (Zn–ZnE–Zn), respectively. Considering these potentials, electron injection from the excited Zn–ZnA–Zn to TiO2 is more thermodynamically feasible than that from Zn–FbA–Zn.
 | ||
| Fig. 5 Energy-level diagrams of Zn–FbE–Zn and Zn–ZnE–Zn. | ||
It should be noted that the oxidation potentials of the excited state is usually used to consider the electron injection. The oxidation potentials of the excited state are estimated from the oxidation potentials of the ground state and the excitation energy E0−0 derived from the fluorescence peak. In the case of Zn–ZnE–Zn, the oxidation potential of the excited state was estimated to be −1.04 V (vs. SCE), which is cathodic with respect to the TiO2 conduction band edge potential by 0.34 V. The oxidation potential of the excited state of Zn–ZnE–Zn is anodic with respect to the reduction potential of Zn–ZnE–Zn by 0.18 V. As seen here, the reduction potential of Zn–ZnE–Zn is much more cathodic with respect to the oxidation potential of the excited state. Zn–FbE–Zn is composed of zinc porphyrins as donor units and a freebase porphyrin as an acceptor unit. The first oxidation potential of Zn–FbE–Zn would be derived from the zinc porphyrin as a donor unit, while the fluorescence mainly reflects the nature of the freebase porphyrin unit, because the excitation energy of freebase porphyrin is lower than that of zinc porphyrin. Therefore, the estimation of the oxidation potential of the excited state of Zn–FbE–Zn using the oxidation potentials of the ground state and excitation energy E0−0 derived from the fluorescence peak is not adequate. To estimate the oxidation potential of the excited state of Zn–FbE–Zn, there should be information about the oxidation potential of the freebase porphyrin unit.
In this study, two ethynyl-linked porphyrin trimers with different energy levels, Zn–ZnA–Zn and Zn–FbA–Zn, are compared. Fig. S3 (ESI†) shows the molecular orbitals of the simplified compounds, all zinc trimer and zinc–freebase–zinc trimer. In these fully optimized structures, the HOMO and the LUMO are distributed over the entire molecule. However, the energy levels of HOMO and LUMO of the zinc–freebase–zinc trimer are higher than those of the all zinc trimer. This is opposite to the experimental results. It is well known experimentally that freebase porphyrins are electron acceptors in comparison with zinc porphyrins. However, DFT calculations such as B3LYP/6-31G(d) always give the opposite results. Such a tendency has been a barrier for the application of DFT studies to these derivatives. In some reports, the DFT results which show the distribution of the HOMO at the freebase porphyrin and the distribution of the HOMO − 1 at the zinc porphyrin, were presented, although the experimental results are the opposite.29 In our previous reports on the ethynyl-linked zinc–freebase heteroporphyrin dimer derivatives,23,24 the HOMO distributed equally at the zinc porphyrin and the freebase porphyrin. These problems could be solved by adopting the solvent effect. There were two reports adopting PCM considerations for the calculation of freebase porphyrins,30,31 although they didn't mention the improvement of the description for the orbitals of freebase porphyrins. There has also been limitation by the use of the Gaussian03 package. By the appearance of the Gaussian09 package, considerations of the solvent effects using PCM became the regular approach. Recently, phenyl-linked zinc–freebase heteroporphyrin dimers have been calculated, and the importance of the adoption of PCM was confirmed.32 Since there is still memory limitation for the Gaussian09W package at present, the solvent effect in the DFT study of the ethynyl-linked porphyrin trimers has been investigated using simplified model compounds. Fig. 6 shows the molecular orbitals of the all zinc trimer and the zinc–freebase–zinc trimer without meso-substituents, obtained by B3LYP/6-31G(d) employing the solvent effect by CPCM (dichloromethane). Compared to the orbitals in Fig. S3 (ESI†), the distribution of the HOMO and the LUMO is similar. The orbital energies of the HOMO and the LUMO have, now, the same tendency with the experimental results. By the consideration of the solvent effects, the energy levels of the orbitals related to the freebase porphyrin part are stabilized. In contrast to the reported result on the phenyl-linked dimers,32 the orbital localization is not seen in the present case. This is the feature of the ethynyl-linked structure. To visualize the solvent effect on the DFT results, the orthogonal conformer of the zinc–freebase–zinc trimer was calculated in vacuum and in dichloromethane (Fig. S4, ESI†). It is notable that the HOMO of the zinc–freebase–zinc trimer is distributed on zinc porphyrins under the consideration of the solvent effect, while the HOMO is distributed on freebase porphyrin in vacuum. Since there have been many reports on the properties of freebase porphyrin derivatives, this correction on the DFT results by the consideration of the solvent effect would be important to analyze those data theoretically.
 | ||
| Fig. 6 Molecular orbitals of ethynyl-linked porphyrin trimers calculated by B3LYP/6-31G(d) employing CPCM: (a) all zinc trimer, (b) zinc–freebase–zinc trimer. | ||
The performances of the DSSCs using these trimers were evaluated. The IPCE spectra of the DSSCs using these trimers are shown in Fig. 7. In the case of Zn–FbA–Zn, the IPCE values were less than 3% at the wavelengths from 500 to 900 nm, and less than that of Zn–ZnA–Zn. This result reflects the difference in the energy levels. The DSSC using Zn–ZnA–Zn showed higher cell performance (η: 0.61%; VOC: 0.32 V; JSC: 3.17 mA cm−2; FF: 0.61) than that of Zn–FbA–Zn (η: 0.18%; VOC: 0.29 V; JSC: 1.10 mA cm−2; FF: 0.56). However, even in the case of Zn–ZnA–Zn, the IPCE values were just more than 5% at the wavelengths from 500 to 770 nm, although the IPCE spectra increased at around 900 nm.
 | ||
| Fig. 7 IPCE spectra of DSSCs sensitized with Zn–ZnA–Zn (thick line) and Zn–FbA–Zn (thin line). TiO2 film thickness was 5 μm. | ||
Performances of the DSSCs using Zn–ZnA–Zn under various cell fabrication conditions
To improve the cell performance of DSSCs, it is often attempted to reduce the aggregate formation of dyes by the addition of a coadsorbent, such as deoxycholic acid (DCA). The IPCE spectra of the DSSCs using Zn–ZnA–Zn with DCA are shown in Fig. 8 and the corresponding photovoltaic properties are listed in Table 1. As shown in Fig. 8, the addition of 1.0 × 10⁻⁵ M DCA caused the higher IPCE values than the case without DCA. The addition of 1.0 × 10⁻⁴ M DCA caused further improvement, while the addition of 1.0 × 10⁻³ M DCA caused the decrease in IPCE. | ||
| Fig. 8 IPCE spectra of DSSCs sensitized with Zn–ZnA–Zn using 1.0 × 10⁻⁵ M solution of the dye in 1:1 (v/v) CHCl3–EtOH without a coadsorbent (thick solid line), with 1.0 × 10⁻⁵ M DCA (thick dashed line), with 1.0 × 10⁻⁴ M DCA (thin solid line) and with 1.0 × 10⁻³ M DCA (thin dashed line). TiO2 film thickness was 5 μm. | ||
| DCA concentration | V OC/V | J SC/mA cm−2 | FF | η/% |
|---|---|---|---|---|
| Without DCA | 0.442 | 4.13 | 0.622 | 1.14 |
| 1.0 × 10⁻⁵ M | 0.458 | 4.07 | 0.622 | 1.16 |
| 1.0 × 10⁻⁴ M | 0.502 | 5.22 | 0.626 | 1.64 |
| 5.0 × 10⁻⁴ M | 0.558 | 5.47 | 0.641 | 1.96 |
| 1.0 × 10⁻³ M | 0.558 | 3.57 | 0.642 | 1.28 |
The effect of DCA addition appeared in the absorption spectra, as shown in Fig. 9. In the Q band region, the absorption peak of Zn–ZnA–Zn (762 nm) on TiO2 was blue shifted with respect to that in 1/1 CHCl3–EtOH (v/v) (782 nm) by 20 nm (Fig. S5, ESI†). This blue shift has been caused by the formation of H-type (stacked) aggregates of trimers on the TiO2 surface. The absorption intensity of Zn–ZnA–Zn with DCA on TiO2 decreased along with the increase of the concentration of DCA in the solution of Zn–ZnA–Zn due to the decrease of immobilized trimers on the TiO2 surface because the coadsorbent also occupied space on the TiO2. The absorption peak at around 700–850 nm was located at a longer wavelength in the case of trimers with DCA. Upon a closer inspection, this spectral change is actually the decrease of the peak intensity at 720 nm relative to the peak at 820 nm as DCA concentration was increased. This result suggests that the addition of DCA suppressed the formation of the H-type aggregates.
 | ||
| Fig. 9 Absorption spectra of Zn–ZnA–Zn on TiO2 films using 1.0 × 10⁻⁵ M solution of the dye in 1:1 (v/v) CHCl3–EtOH without a coadsorbent (thick solid line), with 1.0 × 10⁻⁵ M DCA (thick dashed line), with 1.0 × 10⁻⁴ M DCA (thin solid line) and with 1.0 × 10⁻³ M DCA (thin dashed line). TiO2 film thickness was 3 μm. | ||
The suppression of H-type aggregates is in accord with the improvement of IPCE upon the addition of 1.0 × 10⁻⁵ M or 1.0 × 10⁻⁴ M of DCA. When the concentration of DCA was 1.0 × 10⁻³ M, the IPCE values were lower than the other cases with different DCA concentrations. This may be due to the reduction of the amount of dye adsorption. However, the spectral shape in the Q band region showed opposite behavior in comparison with the absorption spectra. The IPCE peak of the DSSC using Zn–ZnA–Zn with DCA appeared at a shorter wavelength than that without DCA. In the case of the DSSC using Zn–ZnA–Zn without DCA, some portions of dyes are not included in H-type aggregates, and are working for photo-electric conversion. The major portions of dyes form H-type aggregates and work as masks at the shorter wavelength region, leaving the IPCE peak at the longer wavelength region. Therefore, the IPCE values at the Soret band region are low and comparable to those at the Q band region. Along with the increase of the DCA addition, the formation of H-type aggregates is suppressed, reducing the mask effect. Together with the decrease of the total amount of the immobilized trimers on the TiO2 surface, the IPCE spectral shape becomes similar to that of the absorption spectra.
As seen in Table 1, the JSC values of these DSSCs corresponded to the trends of the IPCE spectra. The VOC values of the DSSCs using Zn–ZnA–Zn without DCA and those with 1.0 × 10⁻⁵ M DCA were similar, within the variation of the measured cells. By further addition of DCA, the VOC values increased, but the VOC values of those with 5.0 × 10⁻⁴ M DCA and 1.0 × 10⁻³ M DCA were within the variation of the cells. FF values were almost constant regardless of DCA concentrations. As a result, the energy conversion efficiency η was the highest when 5.0 × 10⁻⁴ M DCA was added. Several factors have been considered for the cause of the VOC variation, such as the dipole moments of the adsorbed dyes on the TiO2 surface,33,34 and the interfacial charge recombination between the electrons in the TiO2 conduction band and the redox couple in the electrolyte or the oxidized dyes. To consider the charge recombination rate in these DSSCs, the current–voltage characteristic of the DSSCs using Zn–ZnA–Zn in the dark was measured (Fig. S6, ESI†). The dark current of the DSSCs decreased along with the increase in the DCA concentrations. This fact indicates that the rate of the interfacial charge recombination between the electrons in the TiO2 conduction band and the redox couple in the electrolyte is lowered by the addition of DCA. It is suggested that the sufficient DCA coverage over the TiO2 surface prevents the charge recombination from the electrons in the TiO2 conduction band to I3−. For further investigation, the electron lifetime of the DSSCs was estimated from the transient photovoltage decay.24 The data shown here were obtained from the cells used to get the data in Table 1. From the results obtained by changing the light intensity, the electron lifetime was plotted versus the VOC of the DSSCs at various DCA concentrations (Fig. 10). Basically, the results also show that the charge recombination rate is lower for the high concentration of DCA than for the low concentration. The trend in the electron lifetime data is in better agreement with that of the VOC. In the case of the dark current data, the value decreased monotonously along with the addition of DCA, while the VOC showed saturation-like behavior. In the plots in Fig. 10, the higher VOC correspond to the higher intensity of illumination and the lower VOC correspond to weak illumination. The difference in the electron lifetime between the cells with 5.0 × 10⁻⁴ M DCA and 1.0 × 10⁻³ M DCA becomes larger at the weak illumination side, connecting the data in the dark and those under 1 sun illumination. The different ratio of Zn–ZnA–Zn and DCA on the TiO2 surface caused such behavior.
 | ||
| Fig. 10 Electron lifetimes measured under different illumination intensities as a function of open-circuit voltage for the DSSCs with various concentrations of DCA. | ||
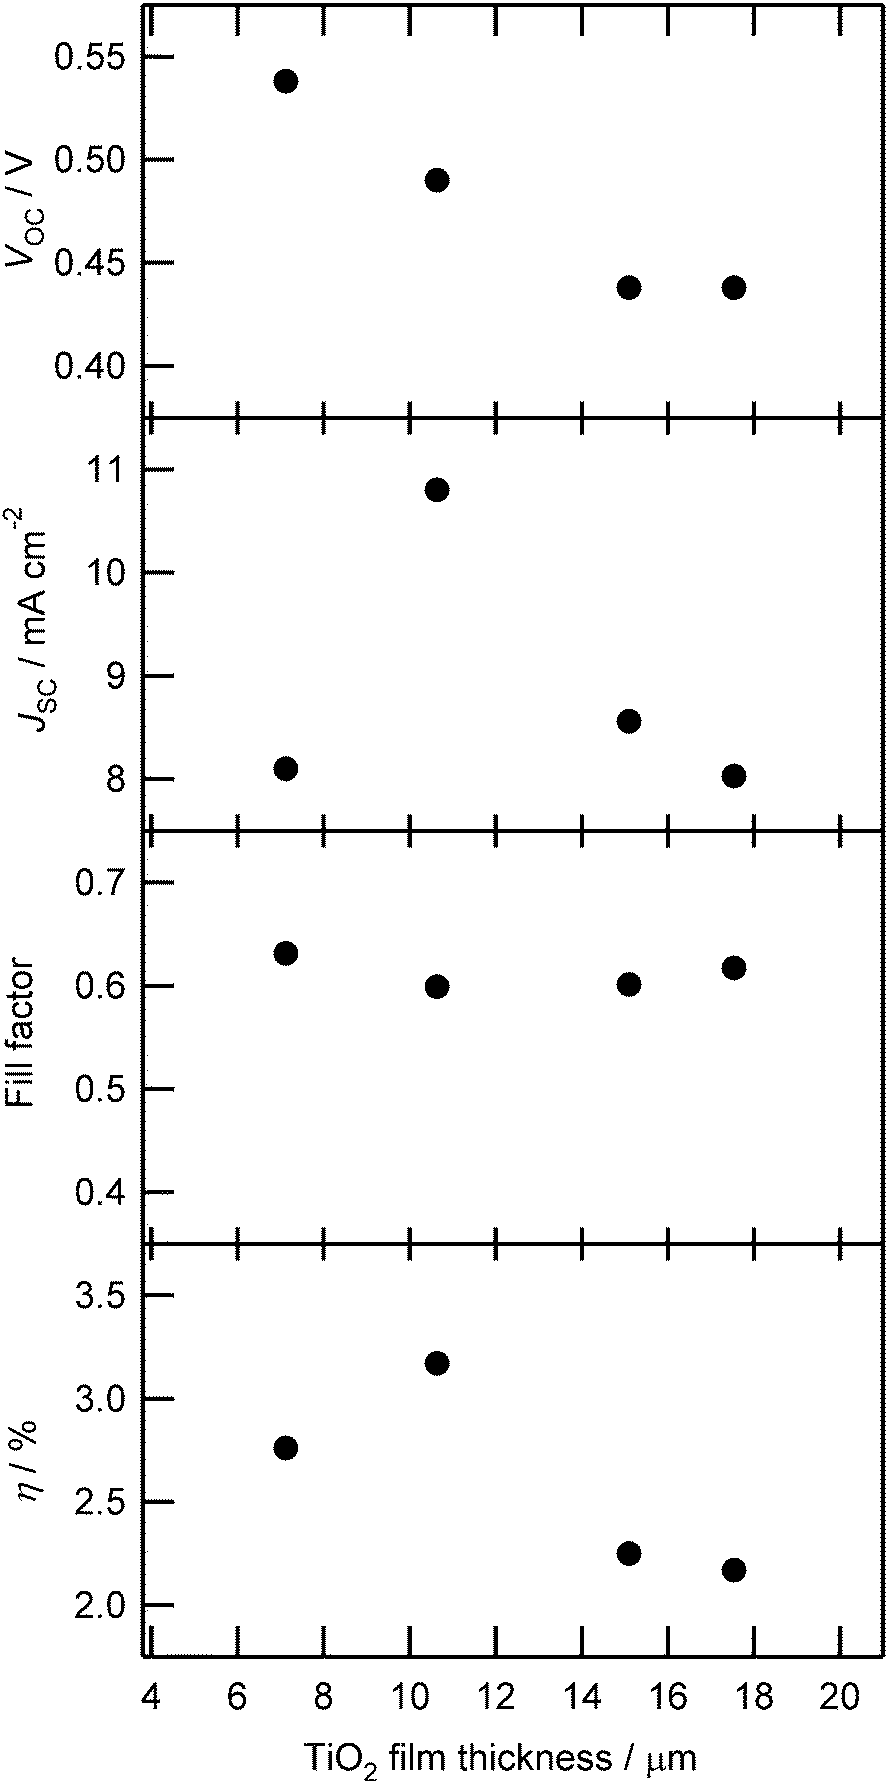
The low IPCE indicates the possibility that the light-harvesting of the DSSCs is not enough, although the TiO2 films for DSSCs were equipped with the scattering layer. In Fig. 9, it is shown that 76% (without DCA) or 37% (with 1.0 × 10⁻⁴ M DCA) of photons were absorbed at 490 nm. When such thin TiO2 films were used to fabricate DSSCs, the observed IPCE at 490 nm was 15% or 11%, respectively. The internal quantum efficiency (absorbed photon-to-current conversion efficiency, APCE) is roughly estimated to be 20% (without DCA) or 30% (with DCA), respectively. Therefore, the main loss was caused by the low internal quantum efficiency. However, it would be easier to increase the absorption than to improve the internal quantum efficiency. To increase the amount of adsorbed dye, the properties of the DSSCs using Zn–ZnA–Zn were investigated for various TiO2 film thicknesses and the relevant performance parameters were plotted versus the TiO2 film thickness in Fig. 11. The VOC decreased along with the increase of the film thickness. The JSC showed a maximum value at a mean film thickness of 10.6 μm. The FF was constant regardless of the TiO2 film thickness. Reflecting these parameters, the η of the DSSCs based on Zn–ZnA–Zn showed the highest value of 3.17% (VOC: 0.49 V; JSC: 10.8 mA cm−2; FF: 0.60) under the condition of 10 μm film thickness. The VOC decreased significantly along with the increase in the TiO2 film thickness as shown in Fig. 11. To consider the charge recombination rate in these DSSCs, the current–voltage characteristic of the DSSCs using Zn–ZnA–Zn in the dark was also measured (Fig. S7, ESI†). The dark current of the DSSCs increased along with the increase in the film thickness of TiO2, indicating that the rate of the interfacial charge recombination is larger for thick films than for thin films. The result of the electron lifetime measurements (Fig. S8, ESI†) also shows that the charge recombination rate is faster for thick films than for thin films. From these results, we concluded that the decrease of VOC in thicker films was caused by the increase in the charge recombination rate along with the increase in the TiO2 film thickness.
 | ||
| Fig. 11 Dependence of DSSC parameters [open circuit voltage (VOC), current density (JSC), fill factor, and efficiency (η)] sensitized with Zn–ZnA–Zn on TiO2 film thickness. | ||
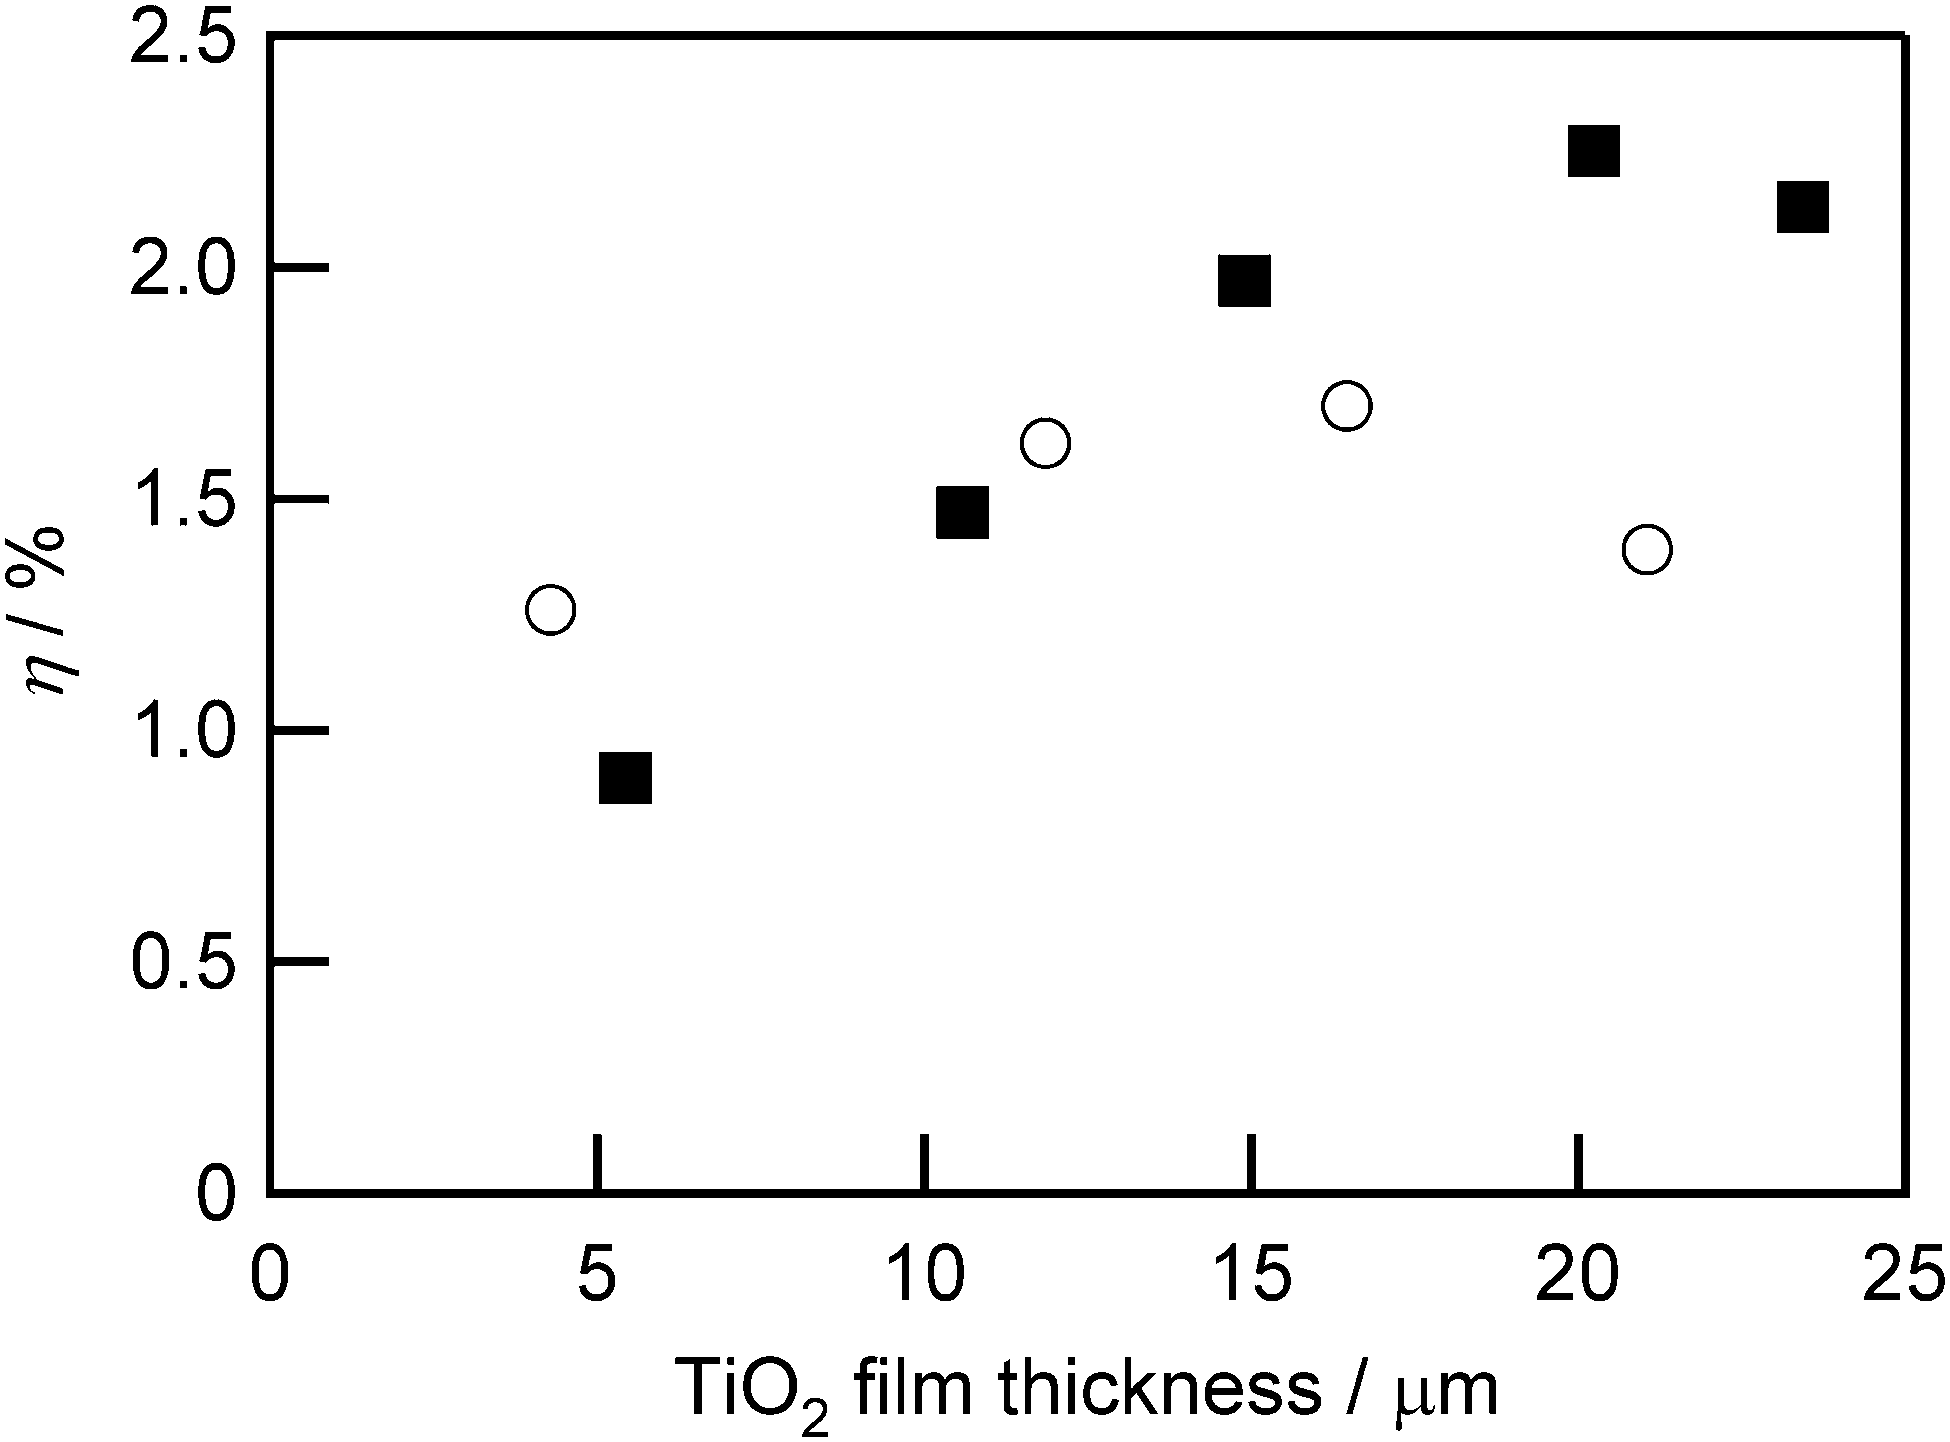
Since the long-axis length of the ethynyl-linked porphyrin trimer is about 3 nm, which is comparable to the size of TiO2 nanoparticles, the difference in the particle size may affect the adsorption behavior of the ethynyl-linked porphyrin trimer on the TiO2 surface. Therefore, the properties of the DSSCs using Zn–ZnA–Zn were investigated for two sizes of TiO2 nanoparticles (13 nm and 37 nm). The photoelectric conversion efficiencies η were plotted versus the TiO2 film thickness in Fig. 12, and the other photovoltaic performance parameters are shown in Fig. S9 (ESI†). The VOC values of the DSSCs using large particles (37 nm) were constant regardless of the TiO2 film thickness, while that of small particles (13 nm) decreased along with the increase of the film thickness. Concerning the JSC, the DSSCs composed of small TiO2 nanoparticles showed higher values than large particles at the thinner film thickness. This would be caused by the larger specific surface area of the TiO2 films composed of small particles than that of large particles. The JSC showed maximum values at a certain film thickness: 12 μm for small particles and 20 μm for large particles. The FF was constant regardless of the size of TiO2 nanoparticles. Reflecting these parameters, the η of the DSSCs based on Zn–ZnA–Zn showed maximum values, and the highest value of 2.25% (VOC: 0.48 V; JSC: 7.28 mA cm−2; FF: 0.64) was obtained under the conditions of large particle size (37 nm) and 20 μm film thickness. As seen here, larger TiO2 particles may be more appropriate as the transparent semiconductor scaffold in DSSCs utilizing large-sized molecules.
 | ||
| Fig. 12 Dependence of photoelectric conversion efficiency (η) on TiO2 film thickness for cells using 13 nm (open circles) and 37 nm (filled squares) TiO2 nanoparticles and sensitized with Zn–ZnA–Zn. | ||
Conclusions
The DSSCs using ethynyl-linked porphyrin trimers (Zn–FbA–Zn, Zn–ZnA–Zn) showed the spectral sensitivities that increased at around 900 nm, which is a relatively long wavelength among the reported DSSCs based on porphyrins. Among these trimers, Zn–ZnA–Zn showed better performance because of its more suitable energy level matching than Zn–FbA–Zn. Through the DFT calculations, it was indicated that the energy levels might be changed by the rotational motion along the ethynyl linkers. However, the calculated energy levels matched with the experimental results only when the solvent effect was considered with the CPCM method. To explain the experimental results on the basis of the molecular orbitals, careful considerations are still needed. Since rotational isomers are one of the features of ethynyl-linked porphyrin oligomers, investigations on the contribution of such rotational isomers should be interesting. During the optimization of DSSC fabrication, the thicker TiO2 film to increase the surface-adsorbed trimers did not give rise to higher photocurrent, indicating that Zn–ZnA–Zn is suitable for the thinner TiO2 films. The larger TiO2 nanoparticles than the conventional cases were found to be preferable in this case, reflecting the large molecular size of the porphyrin trimer. These results show that ethynyl-linked porphyrin trimers would be one of the promising candidates as a sensitizer with intense and broad absorption for efficient DSSCs. The present results also indicate that the suppression of the aggregate formation without decrease in the amount of surface-adsorbed dyes is requested in this case, because the light-harvesting efficiency is still not enough in spite of the high molar extinction coefficient of the trimer. Since the internal quantum efficiency was about 30% at present, both the light-harvesting efficiency and the internal quantum efficiency should be improved with almost equal weight. Modification of the anchoring groups for such improvements is on the way.Acknowledgements
This work was supported by Funding Program for World-Leading Innovative R&D on Science and Technology (FIRST program) on the development of organic photovoltaics toward a low-carbon society, from the Japanese Government, and the Research Fellowships of the Japan Society for the Promotion of Science (JSPS) for Young Scientists.Notes and references
- B. O'Regan and M. Grätzel, Nature, 1991, 353, 737 CrossRef CAS.
- M. Grätzel, Acc. Chem. Res., 2009, 42, 1788 CrossRef PubMed.
- A. Hagfeldt, G. Boschloo, L. Sun, L. Kloo and H. Pettersson, Chem. Rev., 2010, 110, 6595 CrossRef CAS PubMed.
- T. Kinoshita, J. Fujisawa, J. Nakazaki, S. Uchida, T. Kubo and H. Segawa, J. Phys. Chem. Lett., 2012, 3, 394 CrossRef CAS.
- T. Kinoshita, J. T. Dy, S. Uchida, T. Kubo and H. Segawa, Nat. Photonics, 2013, 7, 535 CrossRef CAS.
- C.-W. Lee, H.-P. Lu, C.-M. Lan, Y.-L. Huang, Y.-R. Liang, W.-N. Yen, Y.-C. Liu, Y.-S. Lin, E. W.-G. Diau and C.-Y. Yeh, Chem.–Eur. J., 2009, 15, 1403 CrossRef CAS PubMed.
- T. Bessho, S. M. Zakeeruddin, C.-Y. Yeh, E. W.-G. Diau and M. Grätzel, Angew. Chem., Int. Ed., 2010, 49, 6646 CrossRef CAS PubMed.
- A. Yella, H.-W. Lee, H. N. Tsao, C. Yi, A. K. Chandiran, M. K. Nazeeruddin, E. W.-G. Diau, C.-Y. Yeh, S. M. Zakeeruddin and M. Grätzel, Science, 2011, 334, 629 CrossRef CAS PubMed.
- L.-L. Li and E. W.-G. Diau, Chem. Soc. Rev., 2013, 42, 291 RSC.
- S. Hayashi, M. Tanaka, H. Hayashi, S. Eu, T. Umeyama, Y. Matano, Y. Araki and H. Imahori, J. Phys. Chem. C, 2008, 112, 15576 CAS.
- H. Imahori, T. Umeyama and S. Ito, Acc. Chem. Res., 2009, 42, 1809 CrossRef CAS PubMed.
- A. Kira, Y. Matsubara, H. Iijima, T. Umeyama, Y. Matano, S. Ito, M. Niemi, N. V. Tkachenko, H. Lemmetyinen and H. Imahori, J. Phys. Chem. C, 2010, 114, 11293 CAS.
- C.-L. Mai, W.-K. Huang, H.-P. Lu, C.-W. Lee, C.-L. Chiu, Y.-R. Liang, E. W.-G. Diau and C.-Y. Yeh, Chem. Commun., 2010, 46, 809 RSC.
- C. Jiao, N. Zu, K.-W. Huang, P. Wang and J. Wu, Org. Lett., 2011, 13, 3652 CrossRef CAS PubMed.
- D. Kim and A. Osuka, J. Phys. Chem. A, 2003, 42, 8791 CrossRef.
- D. Kim and A. Osuka, Acc. Chem. Res., 2004, 37, 735 CrossRef CAS PubMed.
- V. S.-Y. Lin, S. G. DiMagno and M. J. Therien, Science, 1994, 264, 1105 CAS.
- V. S.-Y. Lin and M. J. Therien, Chem.–Eur. J., 1995, 1, 645 CrossRef CAS.
- K. Susumu and M. J. Therien, J. Am. Chem. Soc., 2002, 124, 8550 CrossRef CAS PubMed.
- T. V. Duncan, K. Susumu, L. E. Sinks and M. J. Therien, J. Am. Chem. Soc., 2006, 128, 9000 CrossRef CAS PubMed.
- J. T. Dy, K. Tamaki, Y. Sanehira, J. Nakazaki, S. Uchida, T. Kubo and H. Segawa, Electrochemistry, 2009, 77, 206 CrossRef CAS PubMed.
- J. K. Park, J. Chen, H. R. Lee, S. W. Park, H. Shinokubo, A. Osuka and D. Kim, J. Phys. Chem. C, 2009, 113, 21956 CAS.
- Y. Liu, H. Lin, J. T. Dy, K. Tamaki, J. Nakazaki, D. Nakayama, S. Uchida, T. Kubo and H. Segawa, Chem. Commun., 2011, 47, 4010 RSC.
- Y. Liu, H. Lin, J. Li, J. T. Dy, K. Tamaki, J. Nakazaki, D. Nakayama, C. Nishiyama, S. Uchida, T. Kubo and H. Segawa, Phys. Chem. Chem. Phys., 2012, 14, 16703 RSC.
- H.-P. Wu, Z.-W. Ou, T.-Y. Pan, C.-M. Lan, W.-K. Huang, H.-W. Lee, N. M. Reddy, C.-T. Chen, W.-S. Chao, C.-Y. Yeh and E. W.-G. Diau, Energy Environ. Sci., 2012, 5, 9843 CAS.
- S. Nakade, T. Kanzaki, Y. Wada and S. Yanagida, Langmuir, 2005, 21, 10803 CrossRef CAS PubMed.
- R. Shediac, M. H. B. Gray, H. T. Uyeda, R. C. Johnson, J. T. Hupp, P. J. Angiolillo and M. J. Therien, J. Am. Chem. Soc., 2000, 122, 7017 CrossRef CAS.
- M. Kasha, H. R. Rawls and M. A. El-Bayoumi, Pure Appl. Chem., 1965, 11, 371 CrossRef CAS.
- G. Pognon, J. A. Wytko, P. D. Harvey and J. Weiss, Chem.–Eur. J., 2009, 15, 524 CrossRef CAS PubMed.
- R. Improta, C. Ferrante, R. Bozio and V. Barone, Phys. Chem. Chem. Phys., 2009, 11, 4664 RSC.
- N. S. Venkataramanan, A. Suvitha, H. Nejo, H. Mizuseki and Y. Kawazoe, Int. J. Quantum Chem., 2011, 111, 2340 CrossRef CAS.
- T. Tsuchiya and E. Jakubikova, J. Phys. Chem. A, 2012, 116, 10107 CrossRef CAS PubMed.
- S. Rühle, M. Greenshtein, S.-G. Chen, A. Merson, H. Pizem, C. S. Sukenik, D. Cahen and A. Zaban, J. Phys. Chem. B, 2005, 109, 18907 CrossRef PubMed.
- S. S. Pandey, K.-Y. Lee, A. Hayat, Y. Ogomi and S. Hayase, Jpn. J. Appl. Phys., 2011, 50, 06GF08 CrossRef.
Footnote |
| † Electronic supplementary information (ESI) available: Details of synthetic procedures, DFT calculation results, raw data of electrochemistry, dark current data, and photovoltaic performance data. See DOI: 10.1039/c3cp55184a |
| This journal is © the Owner Societies 2014 |