 Open Access Article
Creative Commons Attribution 3.0 Unported Licence
Bright yellow and green Eu(II) luminescence and vibronic fine structures in LiSrH3, LiBaH3 and their corresponding deuterides†
Nathalie
Kunkel
*a,
Andries
Meijerink
b and
Holger
Kohlmann
*c
aInorganic and Solid State Chemistry, Saarland University, P.O. Box 151150, 66041 Saarbrücken, Germany. E-mail: n.kunkel@mx.uni-saarland.de
bDebye Institute, Utrecht University, P.O. Box 80 000, 3508 TA Utrecht, Netherlands
cInorganic Chemistry, University Leipzig, Johannisallee 29, 04103 Leipzig, Germany. E-mail: holger.kohlmann@uni-leipzig.de
First published on 13th January 2014
Abstract
The luminescence of Eu2+ in hydride and deuteride perovskite hosts LiMH3 and LiMD3 (M = Sr, Ba) is reported. Bright yellow (M = Sr) and green (M = Ba) emission is observed and assigned to 4f65d–4f7 emission from Eu2+ in the highly symmetric 12-coordinated M2+ site (m![[3 with combining macron]](https://www.rsc.org/images/entities/char_0033_0304.gif) m). The long wavelength of the emission is explained by the strong covalence and crystal field splitting in europium's coordination by hydride anions. A well-resolved vibrational structure in the emission and excitation spectra of Eu2+ in the Sr-compounds allows for an accurate determination of the energy of the lowest 4f65d state and vibrational frequencies, for both the hydride and deuteride. The isotope effect on the energy of the fd states is small (∼70 cm−1), as expected. Surprisingly, also the vibrational energies observed in the vibronic progression are similar for the d–f emission spectra in LiSrH3 and LiSrD3. This is explained by strong coupling of the d–f emission with low energy acoustic phonons which, contrary to optical phonons, are not strongly affected by replacing H by D. The present results provide insight into the long wavelength Eu2+ emission in hydride coordination and the influence of isotope replacement on the luminescence.
m). The long wavelength of the emission is explained by the strong covalence and crystal field splitting in europium's coordination by hydride anions. A well-resolved vibrational structure in the emission and excitation spectra of Eu2+ in the Sr-compounds allows for an accurate determination of the energy of the lowest 4f65d state and vibrational frequencies, for both the hydride and deuteride. The isotope effect on the energy of the fd states is small (∼70 cm−1), as expected. Surprisingly, also the vibrational energies observed in the vibronic progression are similar for the d–f emission spectra in LiSrH3 and LiSrD3. This is explained by strong coupling of the d–f emission with low energy acoustic phonons which, contrary to optical phonons, are not strongly affected by replacing H by D. The present results provide insight into the long wavelength Eu2+ emission in hydride coordination and the influence of isotope replacement on the luminescence.
Introduction
Due to their high luminescence efficiency, Eu(II) containing host lattices are of great interest for application as luminescent materials (phosphor) in light emitting devices. In the majority of cases, in the spectra of Eu(II) parity-allowed electric dipole transitions (4f65d1 → 4f7) are observed. As the d-electrons are relatively unshielded against interactions with the lattice, the emission energies of these transitions show a strong dependence on the coordination sphere.1 This leads to typically blue or green emission in oxides, halides, borates and sulfates, and green to orange emission in compounds with more polarizable anions, such as sulfides or nitrides2–4 with potential application in efficient warm white LEDs.3 In this regard, Eu(II) coordinating hydride anions promise interesting behavior, because high polarizability and considerable covalence are expected leading to redshifted emission.Metal hydrides as host lattices for divalent europium form a new class of luminescent materials and so far the only hydride host lattices studied are the alkaline earth metal hydrides.5 A strong redshift of the emission wavelength was found in MH2:Eu2+ (M = Ca, Sr, Ba), which was attributed to a stronger nephelauxetic effect (higher covalence) of the hydride ligands and also to a larger ligand field of the hydride anion in comparison to fluoride.5 In these compounds europium has a relatively low site symmetry (m) and coordination number nine. Due to the difference in crystal structure with the fluorides MF2 a direct comparison with the luminescence of Eu2+ in hydrides and fluorides is hampered. In order to widen the understanding of the luminescence of europium in metal hydrides, other coordination numbers and higher symmetries need to be included. To avoid luminescence quenching, host compounds with a sufficiently large bandgap should be chosen, i.e. salt-like compounds like the ionic alkaline and alkaline earth hydrides. Several ternary compounds are known within this class, e.g. the perovskites LiMH3 (M = Sr,6 Ba,7 Eu8) and the structurally diverse group of ternary alkaline or alkaline earth magnesium hydrides.9 Analogous europium compounds exist in many cases, in which europium is always in its divalent state.10 Europium is likely to replace alkaline earth metals in their hydrides and in some cases solid solutions of europium and alkaline earth hydrides have been realized.11,12 Salt-like alkaline earth metal hydrides therefore seem to be good potential hosts for Eu2+.
In this work we investigate the luminescence properties of Eu(II) in the inverse perovskites LiSrH3:Eu2+ (0.5 mol%) and LiBaH3:Eu2+ (0.5 mol%) and their corresponding deuterides. Europium is expected to be divalent and occupy the high symmetry site (m![[3 with combining macron]](https://www.rsc.org/images/entities/char_0033_0304.gif) m) of the alkaline earth metal. It is surrounded by twelve hydrogen or deuterium atoms in a cubooctahedral arrangement of the perovskite structure. This structure type has been unambiguously confirmed for LiBaH3, LiBaD37 and LiEuD3,8 so far. Sr–H and Eu–H distances are typically about 10 pm larger for coordination number twelve as compared to coordination number nine.13 The corresponding fluoroperovskite LiBaF3:Eu2+ has been studied before14 and is isostructural. This allows for a direct comparison of the Eu2+ emission in isostructural fluorides and hydrides and will give a better understanding of the origin of the red shift observed for d–f emission in hydrides. The strontium compound does not feature a corresponding fluoride compound.15 Both hydride and deuteride compounds are investigated to study a possible isotope effect on the luminescence. Studies on isotope effects are limited for lanthanide luminescence to very subtle effects on f–f transition.16,17 No strong influence is expected on the position of energy levels due to a similar covalence and ligand field for H− and D−. Vibrational energies are expected to be higher in the hydrides due to the lower effective mass.
m) of the alkaline earth metal. It is surrounded by twelve hydrogen or deuterium atoms in a cubooctahedral arrangement of the perovskite structure. This structure type has been unambiguously confirmed for LiBaH3, LiBaD37 and LiEuD3,8 so far. Sr–H and Eu–H distances are typically about 10 pm larger for coordination number twelve as compared to coordination number nine.13 The corresponding fluoroperovskite LiBaF3:Eu2+ has been studied before14 and is isostructural. This allows for a direct comparison of the Eu2+ emission in isostructural fluorides and hydrides and will give a better understanding of the origin of the red shift observed for d–f emission in hydrides. The strontium compound does not feature a corresponding fluoride compound.15 Both hydride and deuteride compounds are investigated to study a possible isotope effect on the luminescence. Studies on isotope effects are limited for lanthanide luminescence to very subtle effects on f–f transition.16,17 No strong influence is expected on the position of energy levels due to a similar covalence and ligand field for H− and D−. Vibrational energies are expected to be higher in the hydrides due to the lower effective mass.
Materials and methods
The metal hydrides were obtained by hydrogenation of the corresponding alloys and structures were characterized via X-ray powder diffraction. In order to clarify that the compounds crystallize in the cubic inverse perovskite structure type, neutron powder diffraction data for LiSrH3 and LiBaH3 were collected at the D20/ILL/Grenoble (for details see ESI†).Photoluminescence emission and absorption spectra were measured on an Edinburgh Instruments FLS920 spectrofluorometer equipped with a double monochromator (Czerny-Turner, 300 mm focal length) for the excitation beam, a monochromator for UV/Vis detection and a 450 W Xenon lamp for sample excitation. For detection, a photomultiplier tube R928P (Hamamatsu) was used. For low temperature measurements an Oxford liquid helium flow cryostat was used. Luminescence decay curves were measured under pulsed excitation using an Edinburgh 376.8 nm pulsed diode laser (65 ps pulses). Samples were enclosed in sealed silica tubes of 0.5–1 mm diameter. Luminescence decay curves were analyzed using a single exponential function, even though in the higher temperature range a small deviation from single exponential was observed (faster initial decay).
Results and discussion
LiSrH3:Eu2+ and LiSrD3:Eu2+
Both LiSrH3:Eu2+ and LiSrD3:Eu2+ (0.5 mol%) show an intense yellow luminescence under UV excitation (Fig. 1). The europium-free sample LiSrH3 does not exhibit any visible luminescence demonstrating that the bright yellow emission originates from Eu2+.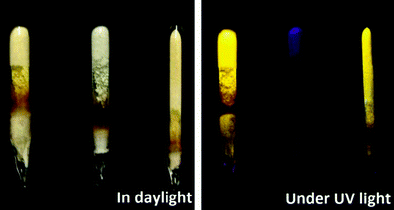 | ||
| Fig. 1 From left to right: LiSrD3:Eu2+, LiSrH3 and LiSrH3:Eu2+ sealed in silica ampoules at daylight and under UV excitation (360 nm). | ||
Crystallography
In the cubic perovskite AIMIIX3 the M atoms are octahedrally coordinated by X atoms, while A atoms have twelve X neighbors in a cubooctahedral arrangement. In the inverse cubic perovskite type, the positions of A and M atoms are interchanged (Fig. 2). Due to the low scattering power of hydrogen for X-rays the two varieties of the cubic perovskite are indistinguishable and neutron diffraction is needed to differentiate between normal and inverse cubic perovskites. Our neutron powder diffraction experiments show unambiguously that LiSrH3 crystallizes in the inverse perovskite structure type (Fig. 2, space group type Pm![[3 with combining macron]](https://www.rsc.org/images/entities/char_0033_0304.gif) m; for neutron powder diffraction data see Fig. S1 of the ESI†).
m; for neutron powder diffraction data see Fig. S1 of the ESI†).
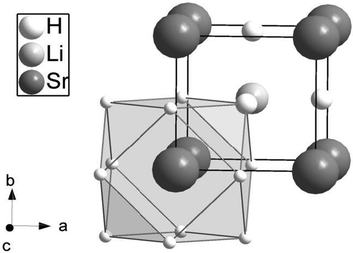 | ||
Fig. 2 The crystal structure of LiSrH3 showing the cubooctahedral surroundings of strontium (site symmetry m![[3 with combining macron]](https://www.rsc.org/images/entities/char_0033_0304.gif) m) with hydrogen. The corresponding barium and europium compounds are isotopic8,9 in the inverse cubic perovskite type. m) with hydrogen. The corresponding barium and europium compounds are isotopic8,9 in the inverse cubic perovskite type. | ||
Assuming a statistical occupation of the strontium site 1(b) by europium and strontium, the following interatomic distances were obtained from X-ray powder diffraction data (Table 1).
| LiSrH3:Eu2+a = 383.498(3) | |
| Eu/Sr–H | 271.174(2) |
| Li–H | 191.749(2) |
| LiSrD3:Eu2+a = 382.535(3) | |
| Eu/Sr–D | 270.493(2) |
| Li–D | 191.267(2) |
Luminescence spectra
Luminescence spectra recorded at room temperature exhibit broad excitation and emission bands which are assigned to parity-allowed electric dipole transitions between the 4f7 and 4f65d levels of Eu2+. In Fig. 3 and 4 the temperature dependent emission spectra of LiSrH3:Eu2+ and LiSrD3:Eu2+ are shown at an excitation wavelength of 360 nm.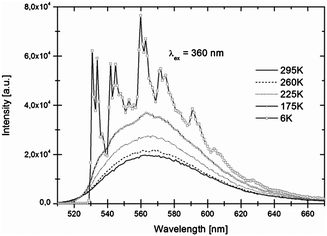 | ||
| Fig. 3 Temperature-dependent emission spectra of LiSrH3:Eu2+ (0.5 mol%) for 360 nm excitation. Intensities increase with decreasing temperatures. | ||
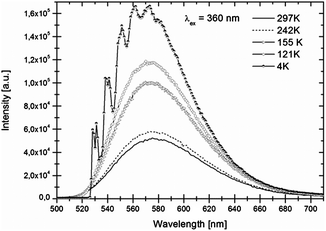 | ||
| Fig. 4 Temperature-dependent emission spectra of LiSrD3:Eu2+ (0.5 mol%) for 360 nm excitation. Intensities increase with decreasing temperatures. | ||
At room temperature broad emission bands are observed at around ∼570 nm. Below 80 K, the spectra of LiSrH3:Eu2+ (below 50 K in the case of LiSrD3:Eu2+) start showing a vibrational fine structure. For the hydride the vibronic structure is more pronounced and the individual vibronic lines are better resolved than for the deuteride. Below the vibronic structure will be discussed in detail. Emission intensities decrease above 120 K and are generally about three times higher for the deuteride compared to the hydride, although an accurate quantitative comparison is hampered by alignment differences for the ampoules.
In Fig. 5 details of the emission spectra of LiSrH3:Eu2+ at 4 K are depicted. In the range of 450 to 550 nm vibrational fine structure is also visible in the excitation spectra (see Fig. 6). The observation of vibrational fine structure is typical for intermediate coupling strength of electronic transitions with vibrations.
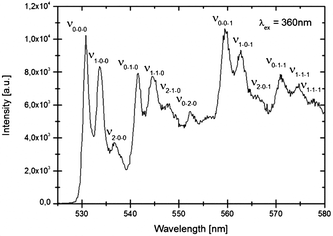 | ||
| Fig. 5 Higher resolution emission spectrum of LiSrH3:Eu2+ (0.5 mol%) at 4 K, excitation at 360 nm. The zero-phonon line (0–0–0) and vibronic replicas (νx−y−z) are indicated and discussed in the text. | ||
A careful analysis of the vibronic structure reveals valuable information on the electron–phonon coupling strength and the phonon energies. The vibronic pattern is well-resolved and complex, involving coupling with at least three different vibrations. In Table 2 the energies of the vibronic lines with respect to the zero-phonon (labeled 0−0−0) line are tabulated for the Eu2+ emission and excitation spectrum in LiSrH3 and LiSrD3. A typical pattern of three closely spaced lines ∼100 cm−1 apart is repeated at ∼370 cm−1 intervals. This can be explained by coupling of the 4f65d transition with vibrations of these two energies. In the assignment in Fig. 6 of the vibronic lines with νx−y−z the number x indicates the vibronic replica of the lower energy ∼100 cm−1 vibration and the number y the ∼370 cm−1 vibration. The pattern for the 100 cm−1 vibration shows a strong 0–x line and weaker 1–x and 2–x lines, typical for a Huang–Rhys coupling parameter S around 0.8. The ratio between the 0–0 line and vibronic replicas n can be calculated from:18
| In = e−S (Sn/n!) |
For a Huang–Rhys coupling parameter S of 0.8 a ratio of 0.8 is expected for the 0–1/0–0 intensity, close to the experimentally observed ratio for the 100 cm−1 phonon replica. The intensity variation for the vibronic lines of the 350 cm−1 vibration (0–0–0, 0–1–0) shows a stronger 0–0 line and a weaker 1–0 line with a ratio of ∼0.7 indicating that S is around 0.7 for this vibrational mode. Due to the uncertainty in the background, it is difficult to accurately determine S. At 964 cm−1 another strong line is observed with replicas at ∼100 cm−1 intervals. This indicates coupling to a third vibrational mode at ∼970 cm−1. In addition to the replicas at 100 cm−1 and at 370 cm−1 a group of three lines at 100 cm−1 is observed, which can be assigned to vibronic overtones due to coupling with all three vibrations (970 cm−1, 380 cm−1 and 100 cm−1). For the 970 cm−1 vibration S is similar, approximately 0.7. In Table 2 all lines are assigned to νx–y–z where x, y and z indicate the number of vibrations involved in the 100 cm−1 (x), 370 cm−1 (y) and 970 cm−1 (z) vibrations. It is rare that d–f emission spectra of lanthanides show such a well-resolved vibrational fine structure in which multiple vibrational modes can be identified. In previous work well-resolved spectra showing coupling with two vibrations have been reported for Ce3+, Pr3+ and Tb3+ in elpasolites18–20 with values for S between 1 and 2.
| LiSrH3:Eu2+ | LiSrD3:Eu2+ | ||
|---|---|---|---|
| Line | ΔE [cm−1] | Line | ΔE [cm−1] |
| Emission | |||
| ν 1–0–0 | 99 | ν 1–0 | 96 |
| ν 2–0–0 | 204 | ν 2–0 | 198 |
| ν 0–1–0 | 374 | ν 0–1 | 338 |
| ν 1–1–0 | 476 | ν 1–1 | 420 |
| ν 2–1–0 | 591 | ν 2–1 | 542 |
| ν 0–2–0 | 730 | ||
| ν 0–0–1 | 964 | ||
| ν 1–0–1 | 1068 | ||
| ν 2–0–1 | 1195 | ||
| ν 0–1–1 | 1324 | ||
| ν 1–1–1 | 1424 | ||
| ν 2–1–1 | 1532 | ||
| Excitation | |||
| ν 1–0–0 | 93 | ν 1–0 | 86 |
| ν 2–0–0 | 194 | ν 2–0 | 123 |
| ν 0–1–0 | 362 | ν 0–1 | 225 |
| ν 1–1–0 | 451 | ν 1–1 | 336 |
| ν 2–1–0 | 495 | ν 2–1 | 440 |
| ν 0–2–0 | 548 | ||
| ν 0–0–1 | 692 | ||
| ν 1–0–1 | 784 | ||
| ν 2–0–1 | 908 | ||
| ν 0–1–1 | 1057 | ||
| ν 1–1–1 | 1161 | ||
| ν 2–1–1 | 1322 | ||
The excitation spectra also show clear vibronic features, similar to those observed in the emission spectra. The vibrational features observed in Fig. 6 are shown in more detail in the ESI† (Fig. S2). The observation of vibronic structure is complicated by the fact that the 4f65d excited state is split into multiple electronic states due to the splitting of the 4f6 configuration in 7FJ levels.21 The splitting of these levels is of the same order as the vibrational energies (100–1000 cm−1) which complicates the analysis of the vibronic structure. The low energy vibrations can be however clearly observed. At 93 cm−1 and 362 cm−1 from the 0–0 line vibronic side bands are observed, with a relative intensity of ∼0.8. These lines are assigned to the same vibrational modes as the 99 cm−1 and 374 cm−1 vibrations observed in the emission spectra. It interesting to note that the vibrational energies in the emission spectra (ground state vibrations) are slightly higher than those in the excitation spectra (excited state vibrations). Higher vibrational energies imply a higher force constant and thus stronger bonding in the ground state of Eu2+ compared to the excited state. Recent experimental18 and theoretical work22 has shown that the bonding in the 4f65d excited state can be stronger or weaker than in the ground state, depending on the 5d orbital (eg or t2g in cubic coordination). Experimental evidence and ab initio calculations have provided evidence for a weaker bonding in the 5d(eg) state and stronger bonding in the 5d(t2g) state. The lowest 5d-state in cubic 12-coordination has eg symmetry and the presently found results are consistent with a weakening of the Eu–ligand bond for the 4f65d(eg) excited state.
The low temperature emission spectrum of Eu2+ in the deuteride shows a well-resolved vibrational structure, although not as clear as for the hydride. A higher resolution emission and excitation spectrum showing the vibronic features is included in the ESI† (Fig. S3 and S4). The energies of the vibronic lines relative to the zero-phonon line deduced from these spectra are tabulated in Table 2. Two vibrational modes can be clearly distinguished in the emission spectrum, a 96 cm−1 and a 340 cm−1 vibrational mode. The Huang–Rhys parameter for the 96 cm−1 mode is ∼0.9, for the 340 cm−1 mode it seems to be higher but it is difficult to determine due to the strong background. In the excitation spectrum the low energy vibration is 86 cm−1, lower in energy than the corresponding ground state vibrational mode observed in the emission spectrum. This is consistent with a weaker bonding in the 4f65d(eg) excited state.
It is interesting to study the influence of replacing H with D. In view of the similar chemical properties, the covalence and ligand field splitting are expected to be similar in LiSrH3 and LiSrD3. The position of the lowest 4f65d states is similar for Eu2+ in the hydride and deuteride (zero-phonon line at 531 nm in the hydride and 529 nm in the deuteride). The small shift of ∼70 cm−1 can be related to the small difference in lattice parameters. The difference in the vibrational energies observed in the vibronic structure for Eu2+ in the hydride and deuteride is also rather small, with slightly (5–10%) higher energies for the hydride. This is unexpected. Typically a strong influence is observed upon replacing H with D. The two times higher mass of D gives a √2 reduction of the vibrational energy. Previous research has shown that for the high energy optical phonons the expected √2 dependence is observed. However, the low energy (50–300 cm−1) acoustic phonons were shown to be very similar for metal hydrides and deuterides.23,24 The low-energy phonon modes observed in the well-resolved progression are thus assigned to acoustic phonons. The broad background at higher energies will have a contribution of higher energy optical phonons.
Furthermore, we estimate the crystal field splitting for the cubooctahedral field between 4f75d(eg) and 4f75d(t2g) to be approx. 7800 cm−1 for both hydride and deuteride. The splitting is estimated from the position of the zero-phonon line (∼530 nm) and the onset of the 4f65d(t2g) excitation band at around 375 nm. An accurate determination is difficult due to uncertainty in the position of the onset of the 4f65d(t2g) excitation band.
Luminescence lifetimes were recorded as a function of temperature. Close to single exponential decay curves were obtained (see also ESI†) at low temperatures. At room temperature the decay cures deviate from a single exponential. Emission lifetimes at low temperatures are about 420 ns for the hydride and 450 ns for the deuteride. This is somewhat shorter than expected for decay times for parity-allowed transitions between the 4f65d excited state and the 8S7/2 (4f7) ground state given in (24). Typically, a decay time of around 1 to 1.4 μs is expected for Eu2+ emission at around 560 nm.25 The reason for the short decay time is probably the high refractive index n of hydrides. The refractive index of most oxides in which yellow Eu2+ emission has been observed is ∼1.6. For hydrides n is ∼2.26 The refractive index has a strong influence on the radiative decay rate and increase of n from 1.6 to 2 will be more than double the radiative decay rate, consistent with the two times faster decay observed for Eu2+ emission in the hydrides compared to oxides.
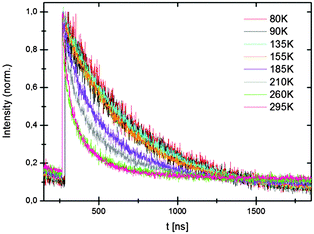
The temperature dependence of the decay times shows that the emission quenches above ∼150 K (Fig. 7) which is also observed in the temperature dependent emission spectra in Fig. 3 and 4. Temperature quenching can have different origins. In the configuration coordinate model temperature is explained by thermally activated cross-over from the excited state to the ground state. In this model the quenching temperature is expected to be strongly correlated with S. Strong electron–phonon coupling (large S) is related to lower quenching temperatures. The Eu2+ emission in LiSrH3 and LiSrD3 is characterized by weak electron–phonon coupling (S ∼ 1, small Stokes shift and a narrow emission band) which rules out thermally activated cross-over as the quenching mechanism for the Eu2+ emission in LiSrH3 and LiSrD3. The alternative mechanism is thermally activated photoionization. If the emitting 4f65d state is situated just below the conduction band, thermally activated ionization from the 4f65d excited state to the conduction band quenches the emission. The small bandgap of hydrides27 is in line with the 4f65d state situated just below the conduction band and makes thermally activated photoionization the more probable quenching mechanism.
LiBaH3:Eu2+ and LiBaD3:Eu2+
LiBaH3:Eu2+ and LiBaD3:Eu2+ (0.5 mol%) show an intense green emission (see Fig. 8).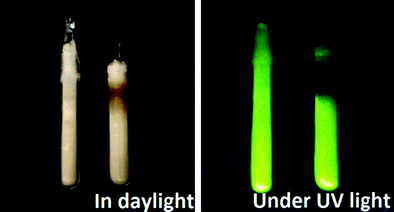 | ||
| Fig. 8 From left to right: LiBaD3:Eu2+ and LiBaH3:Eu2+ sealed in silica ampoules at daylight and under UV excitation (360 nm). | ||
Crystallography
Neutron powder diffraction experiments show that LiBaH3 crystallizes in the inverse perovskite structure, thus confirming earlier results on LiBaH3 and LiBaD3.7 For the distances given in Table 3, a statistical occupation of the barium site 1(b) by europium and barium was assumed. Just as for the Sr-compounds, slightly smaller distances are obtained for the deuterides.| LiBaH3:Eu2+a = 402.284(3) | |
| Eu/Ba–H | 284.458(2) |
| Li–H | 201.142(2) |
| LiBaD3:Eu2+a = 401.459(3) | |
| Eu/Ba–D | 283.750(2) |
| Li–D | 200.730(2) |
Luminescence spectra
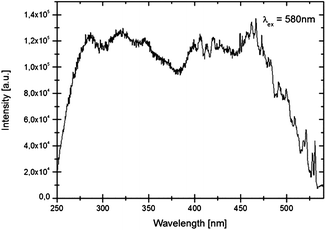
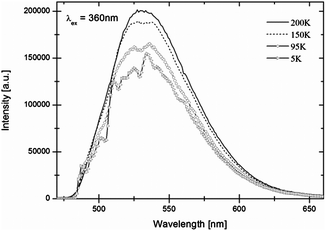
In Fig. 9 the emission spectrum of Eu2+ in LiBaH3 is shown. A broad emission band with a maximum at around 530 nm, in the green spectral region, is observed at room temperature.With decreasing temperature, intensities first increase slightly, but then below approx. 130 K show a significant decrease. Below 65 K, the spectra of LiBaH3:Eu2+ (50 K in the case of LiBaD3:Eu2+) show a vibrational fine structure, which is, however, not as well-resolved as for the strontium compounds. As for the strontium compounds, emission intensities of the deuteride are higher than for the hydride but an accurate quantitative comparison is difficult, as discussed before, for luminescent materials in ampoules. Due to the less well-resolved vibrational structure only a few vibrational energies can be determined (for vibrational energies see Table S1 of the ESI†).
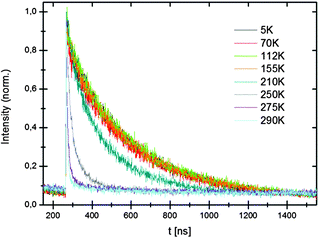
Lifetimes at low temperatures and 550 nm are about 295 ns for the hydride and 280 ns for the deuteride. The luminescence lifetimes are shorter than for the Eu2+ in the Sr-compounds and this is partly due to the shorter emission wavelength (530 nm vs. 570 nm). Based on the λ3 dependence of the luminescence lifetime a 1.25 shorter lifetime is expected. The temperature dependence of the decay times (see Fig. 10) shows a decrease of the lifetimes at temperatures above 200 K which is due to luminescence quenching. Just as for the Sr-hydrides, the quenching is attributed to thermally activated photoionization.
Discussion
To gain insight into the factors determining the red shift of the emission in hydrides in comparison to fluorides, it is important to separate the contribution due to the nephelauxetic effect (covalence) and crystal field splitting. Since LiBaF3, LiBaH3 and LiSrH3 all have the same perovskite structure a meaningful comparison can be made. In Table 4 information obtained from the spectra is collected. The crystal field splitting is determined from the onset of the low energy 4f65d excitation band (zero-phonon line in the excitation spectrum) and the onset of the second excitation band (4f65d(t2g)) observed in the excitation spectrum. The barycenter of the 4f65d state is the degeneracy weighted average of the two 4f65d states. The data show that the large redshift of the 4f65d emission is primarily caused by the strong nephelauxetic effects of the covalent hydride ligands, shifting the barycenter of the 4f65d state to some 10![[thin space (1/6-em)]](https://www.rsc.org/images/entities/char_2009.gif) 000 cm−1 lower energy. Also the larger crystal field splitting contributes to a red shift but the influence is ten times smaller. For comparison, the zero-phonon line of the Eu2+ 4f7(6P7/2) to 4f7(8S7/2) intraconfigurational transition is located at 27
000 cm−1 lower energy. Also the larger crystal field splitting contributes to a red shift but the influence is ten times smaller. For comparison, the zero-phonon line of the Eu2+ 4f7(6P7/2) to 4f7(8S7/2) intraconfigurational transition is located at 27![[thin space (1/6-em)]](https://www.rsc.org/images/entities/char_2009.gif) 535 cm−1 in BaFCl and the transition from the lowest 4f65d state to the 4f7(8S1/2) ground state near 26
535 cm−1 in BaFCl and the transition from the lowest 4f65d state to the 4f7(8S1/2) ground state near 26![[thin space (1/6-em)]](https://www.rsc.org/images/entities/char_2009.gif) 000 cm−1, respectively.28
000 cm−1, respectively.28
| LiBaF3:Eu2+ | LiBaH3:Eu2+ | LiSrH3:Eu2+ | |
|---|---|---|---|
| Onset eg (nm) | 335 | 485 | 530 |
| Onset t2g (nm) | 275 | 355 | 375 |
| Crystal field splitting (cm−1) | 6500 | 7500 | 7800 |
| Barycenter (cm−1) | 33![[thin space (1/6-em)]](https://www.rsc.org/images/entities/char_2009.gif) 760 760 |
25![[thin space (1/6-em)]](https://www.rsc.org/images/entities/char_2009.gif) 150 150 |
23![[thin space (1/6-em)]](https://www.rsc.org/images/entities/char_2009.gif) 550 550 |
Conclusion
Hydrides doped with Eu2+ form an exciting class of luminescent materials with a long wavelength 4f65d emission. Here we have investigated Eu2+ luminescence in LiMH3 and LiMD3 (M = Sr, Ba) and observed a bright yellow (M = Sr) and green (M = Ba) 4f65d emission. For Eu2+ luminescence in the strontium compounds a well-resolved vibrational fine structure is observed in both the emission and excitation spectra. The complex vibronic structure can be explained by coupling with three vibrational modes of ∼100, ∼370 and ∼970 cm−1 with a small Huang Rhys phonon coupling parameter S of 0.7–1 for the different vibrations. Comparison of the vibrational energies in emission and excitation spectra reveals a 5–10% higher energy for the emission spectra, indicating a stronger bonding in the 4f7 ground state compared to the 4f65d(eg) excited state, in line with recent ab initio calculations. For the deuterides the vibrational frequencies are slightly smaller than for the hydrides, but less than expected for the large change in effective mass. The small change indicates that vibronic lines observed in the emission spectra originate from coupling with acoustic phonons which are less affected by the D–H isotope substitution.For Eu2+ in the LiBaH3 a bright green emission is observed. The radiative lifetime of the Eu2+ 4f65d emission in the hydrides and deuterides is 300–400 ns, shorter than observed in oxide and halide hosts. The short emission lifetime is explained by the high refractive index of hydrides. Analysis of the spectra reveals that the large redshift observed for Eu2+ 4f65d emission in hydrides is largely due to the strong nephelauxetic effects of the hydride ligands which shifts the barycenter of the 4f65d state to some 10![[thin space (1/6-em)]](https://www.rsc.org/images/entities/char_2009.gif) 000 cm−1 lower energy in comparison with isostructural fluorides. The larger crystal field splitting for hydride coordination has a small (∼1000 cm−1) contribution to the red shift of the emission. The present results on the 4f65d emission of Eu2+ in hydrides have provided new insights that further the understanding of this class of luminescent materials. Based on the high symmetry and detailed information from the well-resolved vibrational fine structure, LiSrH3:Eu2+ and LiBaH3:Eu2+ are very suitable as model systems for theoretical (ab initio) calculations to better understand excited 4fn−15d states of lanthanides.
000 cm−1 lower energy in comparison with isostructural fluorides. The larger crystal field splitting for hydride coordination has a small (∼1000 cm−1) contribution to the red shift of the emission. The present results on the 4f65d emission of Eu2+ in hydrides have provided new insights that further the understanding of this class of luminescent materials. Based on the high symmetry and detailed information from the well-resolved vibrational fine structure, LiSrH3:Eu2+ and LiBaH3:Eu2+ are very suitable as model systems for theoretical (ab initio) calculations to better understand excited 4fn−15d states of lanthanides.
Funding sources
We are grateful to the Deutsche Forschungsgemeinschaft (DFG) for financial support (grants KO1803/3-1 and KO1803/7-1) and the Landesgraduiertenförderung (LGF) Saarland for a PhD research fellowship.Acknowledgements
Dr Robert Haberkorn is acknowledged for taking the photographs shown and Prof. Michael Springborg for insightful discussions.Notes and references
- P. Dorenbos, J. Lumin., 2003, 104, 239 CrossRef CAS.
- P. Dorenbos, J. Phys.: Condens. Matter, 2003, 15, 575 CrossRef CAS.
- H. Höppe, Angew. Chem., Int. Ed., 2009, 48, 3572 CrossRef PubMed.
- M. Zeuner, S. Pagano and W. Schnick, Angew. Chem., 2011, 123, 7898 CrossRef.
- N. Kunkel, H. Kohlmann, A. Sayede and M. Springborg, Inorg. Chem., 2011, 50, 5873 CrossRef CAS PubMed.
- C. E. Messer, J. Eastman, R. G. Mers and A. J. Maeland, Inorg. Chem., 1964, 3, 776 CrossRef CAS.
- A. J. Maeland and A. F. Andresen, J. Chem. Phys., 1968, 48, 4660 CrossRef CAS PubMed.
- H. Kohlmann and K. Yvon, J. Alloys Compd., 2000, 299, L16 CrossRef CAS.
- K. Yvon and B. Bertheville, J. Alloys Compd., 2006, 425, 101 CrossRef CAS PubMed.
- H. Kohlmann, Eur. J. Inorg. Chem., 2010, 2582 CrossRef CAS.
- H. Kohlmann, R. O. Moyer Jr., T. Hansen and K. Yon, J. Solid State Chem., 2003, 174, 35 CrossRef CAS.
- H. Kohlmann, K. Yvon and Y. Wang, J. Alloys Compd., 2005, 393, 11 CrossRef CAS PubMed.
- K. Yvon, H. Kohlmann and B. Bertheville, Chimia, 2001, 55, 505 CAS.
- A. Meijerink, J. Lumin., 1993, 55, 125 CrossRef CAS.
- A. J. Maeland and W. D. Lahar, Z. Phys. Chem., 1993, 179, 181 CrossRef CAS.
- M. N. Popova, S. A. Klimin, E. P. Chukalina, G. N. Zhizhin, S. L. Korableva and R. Yu Abdulsabirov, Opt. Spectrosc., 2004, 97, 50 CrossRef CAS.
- L. Van Pieterson, R. P. A. Dullens, P. S. Peijzel and A. Meijerink, J. Chem. Phys., 2001, 115, 9393 CrossRef CAS PubMed.
- A. P. Tanner, C. S. K. Mak, N. M. Edelstein, K. M. Murdoch, G. Liu, J. Huang, L. Seijo and Z. Barandiarán, J. Am. Chem. Soc., 2003, 125, 13225 CrossRef PubMed.
- C. K. Duan, P. A. Tanner, A. Meijerink and V. Makhov, J. Phys. Chem. A, 2011, 115, 9188 CrossRef CAS PubMed.
- L. Ning, C. S. K. Mak and P. A. Tanner, Phys. Rev. B: Condens. Matter Mater. Phys., 2005, 72, 085127 CrossRef.
- S. Lizzo, A. H. Velders, A. Meijerink, G. J. Dirksen and G. Blasse, J. Lumin., 1996, 65, 303 CrossRef.
- Z. Barandiarán, N. M. Edelstein, B. Ordejón, F. Ruipérez and L. Seijo, J. Solid State Chem., 2005, 178, 464 CrossRef PubMed.
- H. Dammak, E. Antoshchenkova, M. Hayoun and F. Finocchi, J. Phys.: Condens. Matter, 2012, 24, 435402 CrossRef PubMed.
- A. C. Ho, R. C. Hanson and A. Chizmeshya, Phys. Rev. B: Condens. Matter Mater. Phys., 1997, 55, 14818 CrossRef CAS.
- S. H. M. Poort, A. Meijerink and G. Blasse, J. Phys. Chem. Solids, 1997, 58, 1451 CrossRef CAS.
- A. H. Reshak, M. Y. Shalaginov, Y. Saeed, I. V. Kityk and S. Auluck, J. Phys. Chem. B, 2011, 115, 2836 CrossRef CAS PubMed.
- T. Sato, D. Noréus, H. Takesita and U. Häussermann, J. Solid State Chem., 2005, 178, 3381 CrossRef CAS PubMed.
- G. K. Liu, X. Y. Chen and J. Huang, Mol. Phys., 2003, 101, 1029 CrossRef CAS.
Footnote |
| † Electronic supplementary information (ESI) available: Experimental details and detailed luminescence spectra. See DOI: 10.1039/c3cp55102d |
| This journal is © the Owner Societies 2014 |

