 Open Access Article
Creative Commons Attribution 3.0 Unported Licence
Lithium diffusion in congruent LiNbO3 single crystals at low temperatures probed by neutron reflectometry
E.
Hüger
a,
J.
Rahn
a,
J.
Stahn
b,
T.
Geue
b,
P.
Heitjans
cd and
H.
Schmidt
*ad
aClausthal University of Technology, Institute of Metallurgy, Microkinetics Group, Clausthal-Zellerfeld, Germany. E-mail: harald.schmidt@tu-clausthal.de
bLaboratory for Neutron Scattering, Paul Scherrer Institut, Villigen PSI, Switzerland
cInstitut für Physikalische Chemie und Elektrochemie, Leibniz Universität Hannover, Germany
dZFM – Centre for Solid State Chemistry and New Materials, Leibniz University Hannover, Germany
First published on 2nd January 2014
Abstract
The self-diffusion of lithium in congruent LiNbO3 single crystals was investigated at low temperatures between 379 and 523 K by neutron reflectometry. From measurements on 6LiNbO3 (amorphous film)/natLiNbO3 (single crystal) samples, Li self-diffusivities were determined in single crystals down to extremely low values of 1 × 10⁻²⁵ m2 s−1 on small length scales of 1–10 nm. The measured diffusivities are in excellent agreement with (extrapolated) literature data obtained by experiments based on Secondary Ion Mass Spectrometry and Impedance Spectroscopy. The tracer diffusivities can be described by a single Arrhenius line over ten orders of magnitude with an activation enthalpy of 1.33 eV, which corresponds to the migration energy of a single Li vacancy. A deviation from the Arrhenius behaviour at low temperatures, e.g., due to defect cluster formation is not observed.
1. Introduction
Lithium niobate (LiNbO3) is still one of the most technologically important materials for optical, opto-electronic and piezoelectric applications due to its unique combination of efficient pyroelectric, piezoelectric, electrocaloric, acousto-optical, giant-photovoltaic, ferroelectric, electro-optical, photorefractive and non-linear optical properties.1–4 These properties are combined with a high available quality, easy fabrication and low cost of single crystals.1,5 Large ferroelectric, pyroelectric and piezoelectric coefficients are present due to the polar asymmetry of the Li–O cage in the hexagonal crystal structure (space group R3c).6–8 Due to its versatile applications in the field of advanced photonics and opto-electronics, LiNbO3 is often termed as the ‘silicon of photonics’.9,10LiNbO3 shows a wide solid solution region from 44 mol% to about 50.5 mol% Li2O.11 Single crystals produced by the Czochralski method show the congruent composition of about 48.5 mol% Li2O. However, by using the vapor transport equilibration (VTE) (or other) methods the synthesis of near stoichiometric crystals is also possible.12 The change of composition from the lithium-poor to the stoichiometric side results in significant changes in the physical properties like the Curie temperature, the ferroelectric coercive field, and photorefractive properties.13,14 These changes in physical properties are expected to be the result of defect clusters, which are also responsible for the non-stoichiometry. From the models proposed,15–19,48 the most reliable model consists of a niobium antisite atom which is charge compensated by four lithium vacancies ( ) as supported by atomistic simulations18,49 and density calculations.50
Many of the above mentioned physical properties can be used in commercial devices only after a low-temperature thermal treatment (<500 K) of LiNbO3 in air or inert gas. The annealing induces the redistribution and diffusion of Li+ and/or H+ ions, which improve the technologically useful properties of LiNbO3. Characteristic processes are thermal fixing for optical data storage,2,3,20–22 purification from unwanted photo-active electrons (optical damage inhibition),2,3,9,10,23 waveguide fabrication by proton-exchange,1,2,24–26 and the improvement of ferroelectric domain switching.3,14,27 In addition, the formation, stability and dissociation of defect clusters are closely related to diffusion properties.18
In the literature, several studies on impurity diffusion are available for single crystalline LiNbO3, however, reliable data for Li self-diffusion are very rare (for reviews see ref. 18,28). Li is expected to be the most mobile species compared to Nb and O.28 Li diffusion experiments are almost exclusively restricted to nuclear magnetic resonance (NMR) studies28–33 limited to the high-temperature range above 773 K. A diffusion study based on mass tracers and stable isotopes was done at high temperatures above 1000 K.28,34 We recently presented a study on Li self-diffusion in congruent LiNbO3 single crystals at low temperatures down to 423 K which was based on secondary ion mass spectrometry experiments.35 A dependence of Li diffusion on the crystallographic orientation was not found.36 In addition, impedance spectroscopy measurements were done on the same type of single crystal,43 proving that Li is the species that governs conductivity at least down to 473 K. For temperatures below 423 K we are not aware of any Li tracer experiments in the literature. However, a great variety of conductivity measurements done by impedance spectroscopy or by the four-probe dc method are published.29,37–42 These techniques are not selectively sensitive to Li and often it is unclear which species contributes to conductivity. As well as lithium, hydrogen and electrons are possible charge carriers.
Recently, neutron reflectometry (NR) was applied44 to bulk materials and this study demonstrated the possibility of determining Li diffusivities in LiNbO3 single crystals. The basic principle of these experiments is the following: first, about 50 nm thick amorphous films of 6LiNbO3 with a high Li diffusivity were ion-beam sputtered onto the (001) faces of natLiNbO3 single crystals (containing 92.5% 7Li) having a considerably lower diffusivity at the same temperature. Such structures are termed 6LiNbO3 (amorphous film)/natLiNbO3 (single crystal) isotope heterostructures. Due to the fact that the two Li isotopes have different bound coherent neutron scattering lengths, characteristic interference patterns (fringes) are observed if measured by NR. Diffusion annealing leads to a 6Li/7Li interdiffusion process and to a modification of the NR pattern. This modification is dominated by the slow diffusion of 6Li into the single crystal. The amorphous 6LiNbO3 film itself is a 6Li tracer reservoir, where self-diffusion is tremendously faster than in the LiNbO3 single crystal.457Li ions that enter the amorphous film from the crystal quickly spread out over the whole film thickness. This process does not significantly alter the NR pattern for small diffusion length up to 10 nm. In contrast, 6Li diffusion in the single crystal is much slower and consequently controls the interdiffusion process. The diffusion of 6Li into the single crystal is modelled by a complementary error-function (see below). From the modification of the neutron reflectivity patterns during annealing, the Li self-diffusivity can be extracted using the fitting procedure Parratt32,46 which calculates reflectivity using a recursive algorithm.
The diffusion results at 473 and 523 K are in agreement with the Li diffusivities determined by NR on small length scales (1–6 nm) and by SIMS on large length scales (>35 nm).44 The approach described is applied in the present study to measure the temperature dependence of Li self-diffusivities in lithium niobate below 473 K down to 379 K.
2. Experimental details
For the diffusion experiments, 40–50 nm thick isotope enriched 6LiNbO3 films were deposited by ion-beam sputtering on commercial c-axis oriented natLiNbO3 single crystals (CrysTec, Berlin) with a Li2O content of 48.5 mol%.35 Ion beam sputtering was performed using a commercial set-up (IBC 681, Gatan) equipped with two Penning ion sources. Deposition was done at 5 keV and at a current of about 200 μA in argon at an operating pressure of 5 × 10⁻⁵ mbar. The base vacuum was better than 5 × 10⁻⁷ mbar. As sputter targets, sintered 6LiNbO3 was used. Details of sputter target preparation are given elsewhere.35 During deposition, the specimen is rotated (30 rotations per minute) and rocked (rock angle: 30° and rock speed: 12° per second) to ensure a uniform coating of the sample.The isothermal diffusion anneals were carried out in ambient air in the temperature range between 379 and 523 K. A conventional resistance furnace or alternatively, a rapid thermal annealing set-up (AO 500, MBE, Germany) was used for annealing in ambient air. During such anneals the sputtered LiNbO3 layers stay amorphous, as illustrated in ref. 45.
Neutron reflectometry measurements were carried out on two different reflectometers at the Swiss spallation neutron source (SINQ), Villigen, Switzerland. The time-of-flight reflectometer AMOR was used at incoming neutron wavelengths between 0.2 and 0.9 nm. Reflectivity patterns were measured at incident angles between 0.3° and 3°. Further measurements were carried out using the reflectometer MORPHEUS in the θ/2θ mode in 0.005° or 0.01° angle steps using a neutron wavelength of 0.5 nm. Profile fitting was done using the Parratt32 code46 using a resolution of Δqz/qz = 5%.
3. Results and discussion
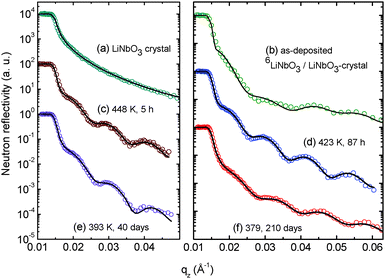
Fig. 1 presents characteristic measured neutron reflectivity patterns and the corresponding Parratt32 simulations from which the Li diffusivity in LiNbO3 single crystals is determined. All measured data can be perfectly described by Parratt32 simulations using the model described in detail in ref. 44. The edge of total reflection is seen for all measurements at a critical value of about qz = 0.014 Å−1. For higher qz values, the reflectivity decreases. The bare natLiNbO3 single crystal (Fig. 1a) does not show any superimposed fringes, as can be expected for a bulk single crystal with a smooth surface. Low amplitude fringes appear in Fig. 1b for a single crystal with a sputtered 6LiNbO3 layer on top, in the as-deposited state. The reason for these fringes is an interference effect due to a superposition of the neutron beams reflected at the surface and at the 6LiNbO3/natLiNbO3 interface. As is obvious from Fig. 1c–f, diffusion annealing leads to a modification of the neutron reflectivity as a result of 6,7Li isotope interdiffusion. The slight fringes of the as-deposited sample are enhanced. This is especially visible in Fig. 2 where the reflectivity of the 6LiNbO3 film/natLiNbO3 structure (termed the NR sample) is normalized to that of the pure natLiNbO3 crystal (termed the NR crystal) and plotted on a linear scale. This effect of fringe enhancement is due to the diffusion of 6Li into the natLiNbO3 single crystal, leading to an increase in scattering length density (SLD) of the crystal close to the isotope interface as shown in Fig. 3.44 The amorphous 6LiNbO3 film is used as a 6Li tracer reservoir, where self-diffusion is tremendously faster than in the LiNbO3 single crystal.457Li ions that enter the amorphous film from the crystal quickly spread out over the whole film thickness. In contrast, 6Li diffusion in the single crystal is much slower and consequently controls the interdiffusion process. Lithium diffusion data (diffusion length and diffusivity) are extracted from this penetration of 6Li into the natLiNbO3 single crystal according to the procedure given in ref. 44. Penetration of the 6Li isotope into the single crystal is modelled by a complementary error-function.44 Consequently, the SLD, ρ, also shows a complementary error-function dependence according to | (1) |
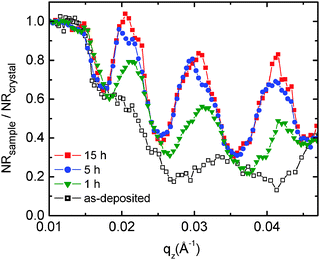 | ||
| Fig. 2 Normalized reflectivity patterns (NR sample/NR crystal) for a better visualization of the fringe enhancement during diffusion annealing at 448 K for different times. | ||
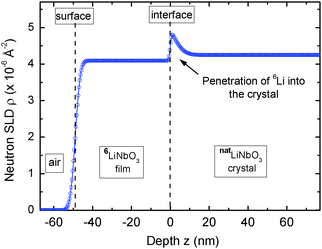 | ||
| Fig. 3 Neutron scattering length density (SLD) as obtained from the Parratt32 simulations given in Fig. 1d. The space coordinate z is set to zero at the film/crystal interface. For further details it is referred to the text. | ||
| Temperature (K) | Annealing time (h) | d (nm) | D (m2 s−1) |
|---|---|---|---|
| 523 | 0.067 | 4.0 ± 1.0 | (3.3 ± 1.7) × 10−20 |
| 523 | 0.250 | 8.0 ± 3.0 | (3.5 ± 2.4) × 10−20 |
| 473 | 0.166 | 1.5 ± 0.5 | (1.8 ± 1.2) × 10−21 |
| 473 | 2 | 3.5 ± 1.0 | (0.9 ± 0.3) × 10−21 |
| 473 | 8 | 6.0 ± 2.0 | (0.6 ± 0.4) × 10−21 |
| 448 | 1 | 2.0 ± 1.0 | (5.6 ± 5.6) × 10−22 |
| 448 | 5 | 4.0 ± 1.0 | (4.4 ± 2.2) × 10−22 |
| 423 | 4 | 1.5 ± 0.5 | (7.8 ± 5.2) × 10−23 |
| 423 | 87 | 5.0 ± 1.5 | (4.0 ± 2.4) × 10−23 |
| 423 | 192 | 7.0 ± 2.5 | (3.6 ± 2.5) × 10−23 |
| 393 | 192 | 1.5 ± 0.5 | (1.6 ± 1.0) × 10−24 |
| 393 | 960 | 3.5 ± 1.0 | (1.8 ± 1.0) × 10−24 |
| 379 | 5040 | 3.0 ± 1.0 | (2.4 ± 1.6) × 10−25 |
The Li tracer diffusivities obtained by NR are plotted in Fig. 4 as a function of reciprocal temperature. Fig. 5 presents the Li tracer diffusivities obtained by NR in comparison to tracer diffusivities derived from SIMS experiments on the same type of samples35 and with charge diffusivities as derived from impedance spectroscopy (IS) measurements on the same type of samples.43 The diffusion data obtained by the different methods (NR, SIMS and IS) are in good agreement with each other. This indicates that the Li+ is the dominant species that governs conductivity in this type of sample.
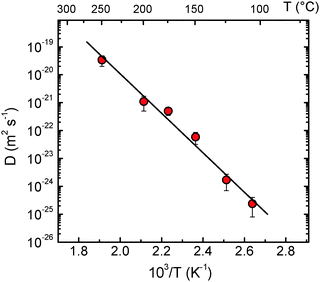 | ||
| Fig. 4 Diffusivities of Li in LiNbO3 single crystals measured by NR as a function of reciprocal temperature. The straight line corresponds to the Arrhenius fit of the data obtained by NR. The diffusivities at 473 and 523 K were already given in preliminary work, where the realization of the new methodology was demonstrated.44 The diffusivity given at a certain temperature is an average of the data given in Table 1 for different annealing times. | ||
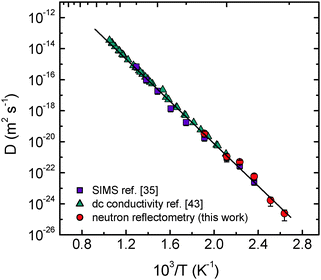 | ||
| Fig. 5 Diffusivities of Li in LiNbO3 single crystals as a function of reciprocal temperature, in comparison to charge diffusivities as obtained by impedance spectroscopy (ref. 43) and to diffusivities as obtained by SIMS (ref. 35) on the same type of crystal as used in the present study. | ||
The Li diffusivities determined by NR (Fig. 4) follow the Arrhenius law
| D = D0 exp(ΔH/kBT) | (2) |
![[thin space (1/6-em)]](https://www.rsc.org/images/entities/char_2009.gif) D0/m2 s−1 = ±2.4). The tracer diffusivities determined by SIMS and NR jointly follow the Arrhenius law over ten orders of magnitude (Fig. 5). An activation enthalpy of ΔH = (1.33 ± 0.02) eV and a pre-exponential factor of D0 = 1.6 × 10⁻⁷ m2 s−1 (error: ln
D0/m2 s−1 = ±2.4). The tracer diffusivities determined by SIMS and NR jointly follow the Arrhenius law over ten orders of magnitude (Fig. 5). An activation enthalpy of ΔH = (1.33 ± 0.02) eV and a pre-exponential factor of D0 = 1.6 × 10⁻⁷ m2 s−1 (error: ln![[thin space (1/6-em)]](https://www.rsc.org/images/entities/char_2009.gif) D0/m2 s−1 = ± 0.7) can be derived in the temperature range between 379 and 773 K. As pointed out in ref. 35, the activation enthalpy of ΔH = 1.3–1.4 eV can be identified as the activation enthalpy of ionic motion, which is identical to the migration of a single charged Li vacancy in a frozen-in defect structure, even if the temperature is changed.
D0/m2 s−1 = ± 0.7) can be derived in the temperature range between 379 and 773 K. As pointed out in ref. 35, the activation enthalpy of ΔH = 1.3–1.4 eV can be identified as the activation enthalpy of ionic motion, which is identical to the migration of a single charged Li vacancy in a frozen-in defect structure, even if the temperature is changed.
According to the measurements presented in Fig. 5, no significant effect of the formation of defect clusters on diffusion at low temperatures down to 379 K is observed. Such clusters are expected to be composed of a niobium antisite atom that is surrounded by three lithium vacancies in nearest neighbour positions plus one independent lithium vacancy along the z direction ( ).18 At temperatures close to room temperature defect complexes in high concentration are expected to be present in order to explain the variation of physical properties within the solid solution range.18 Increasing temperature leads to a dissociation of these complexes and the formation of free migrating vacancies. An upper limit for the fraction of these vacancies is provided by the off-stoichiometry of the crystal, which is about 4% at the congruent composition.19 Lowering the temperature should lead to a decrease of the free vacancy concentration and consequently of the diffusivities by complex formation. Such a lowering of diffusivities is not observed down to 379 K, meaning that the number of complexes is much smaller than the number of free vacancies. For the isostructural compound LiTaO3, a significant recovery of the internal electrical field from a domain reversed state is taking place around 373 K on a time scale of 1–2 h.47 This means that defect complexes which might be responsible for such a field have to dissociate and vacancies become mobile at the given temperature. The presence of a high number of mobile vacancies can be confirmed in light of the present diffusion experiment on LiNbO3.
4. Conclusion
We carried out diffusivity measurements using neutron reflectometry in order to obtain lithium self-diffusivities in LiNbO3 single crystals at temperatures below 473 K. The methodology allows the temperature range to be extended down to 379 K and the diffusivities to be measured over four orders of magnitude. Together with literature data obtained on the same type of single crystals by various methods (SIMS, impedance spectroscopy) the lithium diffusivity in the temperature range between 379 and 984 K can be described by the Arrhenius law with a single activation energy of 1.3 eV over ten orders of magnitude. A deviation from the Arrhenius behaviour at low temperatures due to defect cluster formation is not observed.Acknowledgements
This work is based on experiments performed at the Swiss spallation source SINQ, at the instruments AMOR and MORPHEUS, Paul Scherrer Institut, Villigen, Switzerland. Financial support from the Deutsche Forschungsgemeinschaft (projects: Schm 1569/18 and He 1574/13) in the framework of the Research Unit FOR 1277 (‘molife’) is gratefully acknowledged. This research has also been supported by the European Commission under the 7th Framework Programme through the ‘Research Infrastructures’ action of the ‘Capacities’ Programme, Contract No: CP-CSA_INFRA-2008-1.1.1 Number 226507-NMI3. Thanks are due to B. Ruprecht (Leibniz Universität Hannover) for preparing the LiNbO3 sputter targets.References
- Q. Peng and R. E. Cohen, Phys. Rev. B: Condens. Matter Mater. Phys., 2011, 83, 220103 CrossRef.
- Properties of Lithium Niobate, INSPEC Institution of Electrical Engineers, ed. K. K. Wong, London, 2002 Search PubMed.
- The Handbook of Photonics, ed. M. C. Gupta and J. Ballato, CRC Press Taylor & Francis Group, Boca Raton, 2007 Search PubMed.
- T. Volk and M. Wöhleke, Lithium Niobate, Springer, Berlin, 2010 Search PubMed.
- F. Lüdtke, K. Buse and B. Sturman, Phys. Rev. Lett., 2012, 109, 026603 CrossRef.
- S. C. Abrahams, J. M. Reddy and J. L. Bernstin, J. Phys. Chem. Solids, 1966, 27, 997 CrossRef CAS.
- H. D. Megaw, Acta Crystallogr., Sect. A: Cryst. Phys., Diffr., Theor. Gen. Crystallogr., 1968, 24, 583 CrossRef CAS.
- R. S. Weis and T. K. Gaylord, Appl. Phys. A: Solids Surf., 1985, 37, 191 CrossRef.
- B. Sturman, M. Kösters, D. Haertle, C. Becher and K. Buse, Phys. Rev. B: Condens. Matter Mater. Phys., 2009, 80, 245319 CrossRef.
- M. Kösters, B. Sturman, P. Werheit, D. Haertle and K. Buse, Nat. Photonics, 2009, 3, 510 CrossRef.
- P. Lerner, C. Legras and J. Dumas, J. Cryst. Growth, 1968, 3, 231 CrossRef.
- P. F. Bordui, R. G. Norwood, D. H. Jundt and M. M. Fejer, J. Appl. Phys., 1992, 71, 875 CrossRef CAS PubMed.
- V. Gopalan, V. Dierolf and D. A. Scrymgeou, Annu. Rev. Mater. Res., 2008, 37, 449 CrossRef.
- V. Gopalan, T. E. Mitchell, Y. Furukawa and K. Kitamura, Appl. Phys. Lett., 1998, 72, 1981 CrossRef CAS PubMed.
- O. F. Schirmer, O. Thiemann and M. Wohlecke, J. Phys. Chem. Solids, 1991, 52, 185 CrossRef CAS.
- A. Prokhorov and I. Kuzminov, Physics and Chemistry of Crystalline Lithium Niobate, Hilger, Bristol, 1990 Search PubMed.
- S. C. Abrahams and P. Marsh, Acta Crystallogr., Sect. B: Struct. Sci., 1986, 42, 61 CrossRef.
- H. Xu, D. Lee, S. B. Sinnott, V. Dierolf, V. Gopalan and S. R. Phillpot, J. Phys.: Condens. Matter, 2010, 22, 135002 CrossRef PubMed.
- J. Shi, H. Fritze, G. Borchardt and K.-D. Becker, Phys. Chem. Chem. Phys., 2011, 13, 6925 RSC.
- D. L. Staebler and J. J. Amodei, Ferroelectrics, 1972, 3, 107 CrossRef CAS.
- A. Yariv, S. S. Orlov and G. A. Rakuljic, J. Opt. Soc. Am. B, 1996, 13, 2513 CrossRef CAS.
- K. Buse, S. Breer, K. Peithmann, S. Kapphan, M. Gao and E. Krätzig, Phys. Rev. B: Condens. Matter Mater. Phys., 1996, 56, 1225 CrossRef.
- M. Falk, Th. Wolke and K. Buse, J. Appl. Phys., 2007, 102, 063529 CrossRef PubMed.
- J. Jackel, A. M. Glass and G. E. Peterson, J. Appl. Phys., 1983, 55, 269 CrossRef PubMed.
- D. P. Birnie, Ferroelectrics, 1996, 185, 29 CrossRef.
- A. Alcazar, J. Rams, J. M. Cabrera and F. Agullo-Lopez, J. Appl. Phys., 1997, 82, 4752 CrossRef PubMed.
- H. Steigerwald, M. Lilienblum, Y. J. Ying, R. W. Eason, S. Mailis, B. Sturman, E. Soergel and K. Buse, Phys. Rev. B: Condens. Matter Mater. Phys., 2010, 82, 214105 CrossRef.
- D. Birnie III, J. Mater. Sci., 1993, 28, 302 CrossRef.
- P. Heitjans, M. Masoud, A. Feldhoff and M. Wilkening, Faraday Discuss., 2007, 134, 67 RSC.
- M. Wilkening, D. Bork, S. Indris and P. Heitjans, Phys. Chem. Chem. Phys., 2002, 4, 3246 RSC.
- M. Wilkening and P. Heitjans, Solid State Ionics, 2006, 177, 3031 CrossRef CAS PubMed.
- T. K. Halstead, J. Chem. Phys., 1970, 53, 3427 CrossRef CAS PubMed.
- D. Bork and P. Heitjans, J. Phys. Chem. B, 2001, 105, 9162 CrossRef CAS.
- V. B. Ptashnik, T. Y. Dunaeva and I. V. Myasnikov, Inorg. Mater., 1985, 21, 1814 Search PubMed.
- J. Rahn, E. Hüger, L. Dörrer, B. Ruprecht, P. Heitjans and H. Schmidt, Phys. Chem. Chem. Phys., 2012, 14, 2427 RSC.
- J. Rahn, L. Dörrer, B. Ruprecht, P. Heitjans and H. Schmidt, Defect Diffus. Forum, 2013, 333, 33 CrossRef.
- A. Mehta, E. K. Chang and D. M. Smyth, J. Mater. Res., 1991, 6, 851 CrossRef CAS.
- S. Klauer, M. Wöhlecke and S. Kapphan, Phys. Rev. B: Condens. Matter Mater. Phys., 1992, 45, 2786 CrossRef CAS.
- A. V. Yatsenko, S. V. Yevdokimov, A. S. Pritulenko, D. Y. Sugak and I. M. Solskii, Phys. Solid State, 2012, 54, 2231 CrossRef CAS.
- W. Bollmann and M. Gernand, Phys. Status Solidi, 1972, 9, 301 CrossRef CAS.
- K. Brands, M. Falk, D. Haertle, T. Woike and K. Buse, Appl. Phys. B: Lasers Opt., 2008, 91, 279 CrossRef CAS PubMed.
- A. Weidenfelder, J. Shi, P. Fielitz, G. Borchardt, K. D. Becker and H. Fritze, Solid State Ionics, 2012, 225, 26 CrossRef CAS PubMed.
- B. Ruprecht, J. Rahn, H. Schmidt and P. Heitjans, Z. Phys. Chem., 2012, 226, 431 CrossRef CAS.
- E. Hüger, J. Rahn, J. Stahn, T. Geue and H. Schmidt, Phys. Rev. B: Condens. Matter Mater. Phys., 2012, 85, 214102 CrossRef.
- J. Rahn, E. Hüger, L. Dörrer, B. Ruprecht, P. Heitjans and H. Schmidt, Z. Phys. Chem., 2012, 226, 439 CrossRef CAS.
- C. Braun, Parratt32 or the reflectometry tool, HMI, Berlin, 1997–1999, http://www.helmholtz-berlin.de.
- S. Kim, V. Gopalan, K. Kitamura and Y. Furukawa, J. Appl. Phys., 2001, 90, 2949 CrossRef CAS PubMed.
- H. J. Donnerberg, S. M. Tomlinson and C. R. A. Catlow, J. Phys. Chem. Solids, 1991, 52, 201 CrossRef CAS.
- R. M. Araujo, K. Lengyel, R. A. Jackson, L. Kovacs and M. E. G. Valerio, J. Phys.: Condens. Matter, 2007, 19, 046211 CrossRef.
- L. Kovacs and K. Polgar, Cryst. Res. Technol., 1986, 21, K101 CrossRef CAS.
| This journal is © the Owner Societies 2014 |

