 Open Access Article
Creative Commons Attribution 3.0 Unported Licence
Cation diffusion in La0.6Sr0.4CoO3−δ below 800 °C and its relevance for Sr segregation
Markus
Kubicek
*a,
Ghislain M.
Rupp
a,
Stefanie
Huber
a,
Alexander
Penn
ab,
Alexander K.
Opitz
a,
Johannes
Bernardi
b,
Michael
Stöger-Pollach
b,
Herbert
Hutter
a and
Jürgen
Fleig
a
aInstitute of Chemical Technologies and Analytics Vienna University of Technology, Getreidemarkt 9, A-1060 Vienna, Austria. E-mail: markus.kubicek@tuwien.ac.at
bUniversity Service Center for Transmission Electron Microscopy, Vienna University of Technology, Wiedner Hauptstr. 8-10, A-1040 Vienna, Austria
First published on 3rd December 2013
Abstract
Cation diffusion was investigated in La0.6Sr0.4CoO3−δ (LSC) thin films on (100) yttria stabilized zirconia in the temperature range 625–800 °C. Isotopic (86Sr) and elemental tracers (Fe, Sm) were used to establish diffusion profiles of the cations in bi- and multi-layered thin films. The profiles were analyzed by time of flight-secondary ion mass spectrometry (ToF-SIMS). Grain and grain boundary diffusion coefficients of the cations were determined for LSC thin films with columnar grains – diffusion along grain boundaries is shown to be about three orders of magnitude faster than in grains. This could be verified for thin films with different grain size. A- and B-site cations showed very similar temperature dependencies with activation energies of ∼3.5 eV for bulk and ∼4.1 eV for grain boundary diffusion. The importance of cation diffusivities for surface segregation of Sr and thus for a major degradation mechanism of LSC cathodes in solid oxide fuel cells is discussed.
Introduction
Mixed ionic and electronic conducting (MIEC) perovskite-type oxides are attractive cathode materials for solid oxide fuel cell (SOFC) applications. A number of these MIEC oxides exhibit high catalytic activity for oxygen reduction and high oxide ion conductivity and thus they are especially of interest for intermediate SOFC operation temperatures (below 700 °C).1–3 Under these operation conditions MIEC oxides are usually considered to consist of immobile cation lattices with mobile oxide ions. However, although oxygen mobility is indeed many orders of magnitude higher, cation mobility cannot be neglected even at these moderate temperatures. This can be concluded, for example, from changes in surface termination of (La,Sr)(Cr,Mn)O3−δ4 and degradation phenomena involving segregation of cation species, for example Sr segregation on (La,Sr)CoO3−δ surfaces5–8 well below 700 °C. On the other hand, experiments directly probing the cation mobility and measuring diffusion coefficients of cations are mostly restricted to temperatures of 900–1500 °C.9–21 Typically, in these studies on bulk samples Arrhenius-type temperature dependencies of the cation diffusion coefficients are observed with activation energies in the range 2–4 eV.Several types of experiments can be employed to determine the diffusion coefficients of cations in perovskite-type oxides. One technique uses two polished bulk samples (often called diffusion couples), which are brought into contact and are then heated to high temperatures. At these temperatures, the kinetics of a solid state reaction9–11 forming a third phase at the interface, or diffusion profiles of one or more species crossing the phase boundary12,13,22 can be investigated. Other experiments use only one polished bulk sample and fabricate a thin tracer source on top, either by applying a solution that is later dried,14–20 by pulsed laser deposition,23 or by ion implantation.21 Cation diffusion profiles are subsequently generated by annealing for a certain time at constant temperature. In all cases the resulting cation distribution is analyzed by either secondary ion mass spectrometry (SIMS), by electron microscopy and energy dispersive X-ray spectroscopy (EDX), or via the radiation emitted from radioactive tracer isotopes.
The diffusion lengths in all these experiments have to be considerably longer than the roughness of the sample surfaces and interfaces and the depth sensitivity of the detection method. Often, diffusion lengths in the range of several 100 nm to 50 μm are aspired, which is the reason for usually choosing high temperatures in such diffusion experiments. In order to determine diffusion coefficients at lower temperatures it is necessary to measure very short diffusion profiles with high accuracy. For example, this is possible by depth profiling with time of flight-secondary mass spectrometry (ToF-SIMS) and requires a very good quality of surfaces and interfaces. Thin films grown by pulsed laser deposition (PLD) on epi-polished single crystalline substrates can help obtaining such smooth surfaces and interfaces.24 Depositing two or more of these layers on top of one another yields high quality “thin film diffusion couples”. Owing to the small diffusion lengths which can be investigated in such samples, cation diffusion may be studied at lower temperatures than with conventional samples.
Here we apply this type of diffusion experiment to analyze the cation diffusion in La0.6Sr0.4CoO3−δ (LSC) thin films at 625–800 °C by using different isotopic (86Sr/88Sr) and elemental tracers (Co/Fe, La/Sm). Thus experiments were performed at the typical temperatures employed in SOFCs during operation. This gives us the possibility to also investigate the relationships between cation mobility, reaction kinetics of the oxygen exchange, and segregation effects found in such LSC thin films when used as model SOFC cathodes.25
Experimental
Sample preparation
Powders of the desired cation compositions were prepared via the nitrate/citrate (Pechini) route. The detailed powder preparation procedure is described elsewhere.26 The following high purity base materials were applied to ensure a low level of impurities: Co 99.995%, Fe 99.999%, SrCO3 99.995%, La2O3 99.999%, Sm2O3 99.9%, HNO3 70% in H2O, 99.999% purity, Citric acid monohydrate 99.9998% (all Sigma-Aldrich), SrCO3 99.99%, 96.4% 86Sr isotope-enriched (Trace Sciences, Canada). Pulsed laser deposition (PLD) targets were produced by isostatic pressing (5.2 kbar, 2 min) and sintering (1150 °C, 12 h). As very slight deviations in composition (∼1–2%) were observed between an LSC target and a PLD thin film deposited from the target,27 powder compositions were optimized such that the thin films had the desired stoichiometry. Three different powder compositions were prepared, one to obtain thin films of the natural isotope composition La0.6Sr0.4CoO3−δ (denoted LSC), one 86Sr-tracer enriched La0.686Sr0.4CoO3−δ (L86SC), and one containing 90% of the same composition as the LSC target and 10% tracer of all cations (Sm, 86Sr, Fe) to yield the stoichiometry La0.54Sm0.06Sr0.3686Sr0.04Co0.9Fe0.1O3−δ (LSC-T10).All thin films were prepared on 10 × 10 × 0.5 mm3 (100) YSZ single crystals (9.5 mol% Y2O3, Crystec, Germany) by PLD. A KrF laser (COMPex Pro 101F, Lambda Physics, Germany) set to 400 mJ per pulse and 10 Hz was used. The deposition was performed in 0.04 mbar O2, the heated substrate was positioned 6.7 cm from the target. Two different substrate temperatures, 450 °C and 600 °C, were employed during deposition – measured using a pyrometer (KT-19.99, Heitronics, Germany). This leads to dense thin films with different microstructures subsequently denoted as LSC-LT (450 °C) and LSC-HT (600 °C). Growth rates of 6–7 nm min−1 were realized with these parameters. By variation of the deposition time, films of different thickness (50–200 nm) were deposited. A rotatable 3-target-holder allowed changing targets during deposition. In this way several bi- and multi-layers of LSC and LSC + tracer were deposited for the subsequent diffusion experiments. In Fig. 1, a sketch of the sample geometries is given. Symmetric 3- and 4-layered structures as shown in Fig. 1a with different layer sequence and thickness were used to investigate the existence of any depth dependence of the diffusion coefficients in a 200 nm LSC film. Bilayers of the sequence YSZ|LSC|LSC + tracer and of ∼100–200 nm layer thickness as shown in Fig. 1b were used to quantify the tracer diffusion coefficients.
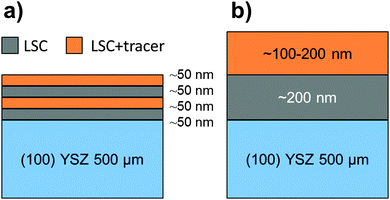 | ||
| Fig. 1 Sketch of the sample geometries used: (a) multilayers to verify spatially homogeneous diffusion, (b) bilayers to determine the tracer diffusion coefficients. | ||
After deposition, 10 × 10 × 0.5 mm3 samples were scratched with a diamond on the substrate-side and fractured into 3–4 pieces of ∼3 × 10 × 0.5 mm3. One of these samples was kept as a reference and the others were annealed for a certain temperature (625–800 °C) and time (10–250 h) in air in a chamber furnace to generate cation diffusion profiles in the LSC multilayers.
Sample characterization
Phase purity of PLD targets was investigated by X-ray Diffraction (XRD) in Bragg-Brentano geometry (X'Pert PRO diffractometer PW 3050/60, PANalytical). For thin films, XRD measurements were performed in parallel beam geometry on a D8-Discover instrument (Bruker AXS) which was equipped with a General Area Detection Diffraction System (GADDS). Information along the theta axis and the chi axis (tilted grains) could be obtained at the same time. For the thin film analysis, the samples were precisely positioned by aligning the polished (100) YSZ-plane parallel to the sample holder. Thin film diffraction patterns were obtained at an accelerating voltage of 45 kV and a measuring time of 200 s per frame and a step size of 0.2° 2Theta per frame. The thin films were further investigated by optical microscopy and scanning electron microscopy (SEM) to ensure that the samples had a smooth surface with no cracks. The thin film thickness was determined from SIMS measurements using the sputter coefficient of LSC to convert sputter times and currents into depths. These film thickness measurements were referenced by digital holography microscopy (DHM, Lyncée Tec, Switzerland) of SIMS craters and SEM cross-section images of fractured substrates with thin films. The microstructure across 200 nm LSC thin films was analyzed by transmission electron microscopy (TEM) imaging and diffraction (FEI TECNAI F20). The surface roughness before and after thermal annealing was investigated by atomic force microscopy (AFM, Nanoscope V Multimode, Bruker, Germany).SIMS depth profiling
Diffusion profiles were analyzed by ToF-SIMS measurements, performed on a TOF.SIMS 5 (ION-TOF, Germany) instrument. 25 keV Bi5+ clusters were used in high current bunched mode, allowing optimal mass resolution. Areas of 100 × 100 μm2 were investigated using a raster of 512 × 512 measured points. Positive secondary ions and clusters were analyzed up to mass 317 and secondary ion intensities of all relevant isotopes and clusters were analyzed simultaneously. For depth-profiling, 2 keV O2+ ions (500 × 500 μm2, ca. 600 nA) were used for sequential ablation of the surface between measuring mass spectra – resulting in average depth steps of ca. 1.5 nm. A low energy electron flood gun (20 eV) was employed for charge compensation.Results and discussion
Sample characterization
Very similar diffraction patterns indicating a pseudo-cubic perovskite phase were observed for all target materials (LSC, L86SC, LSC-T10), and are exemplarily shown in Fig. 2 for LSC and the Fe and Sm co-doped LSC-T10.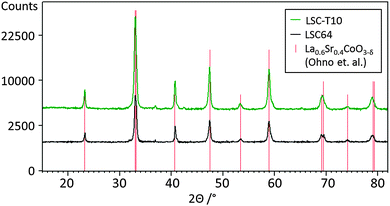 | ||
| Fig. 2 XRD diffraction patterns of the PLD targets LSC-T10 and LSC (baselines shifted for clarity) and stick pattern of rhombohedral La0.6Sr0.4CoO3−δ from ref. 28. | ||
No significant differences in terms of lattice parameters or relative peak intensities were found between pure and tracer containing LSC, therefore we expect negligible lattice strain between LSC|LSC + tracer thin films and undisturbed growth at the corresponding interfaces. Minor impurities at 2Θ ≈ 37° and 42° could be attributed to Co-oxides, Co3O4 or CoO, as a consequence of the slightly deviating stoichiometry of the powders. The stick pattern of rhombohedral R-3m La0.6Sr0.4CoO3−δ28 PDF 00-36-1393 (ICDD, 201029) is shown for comparison and corresponds well to the measured diffraction patterns. Pseudo-cubic lattice parameters of a = 0.3835 ± 0.0001 nm were extracted for all targets.
The PLD thin films were investigated by Theta–2Theta scans and only pseudo-cubic reflexes were observed. Lattice parameters were extracted for LSC-LT and LSC-HT thin films from analyzing four strong reflexes each, yielding 0.3826 ± 0.0006 nm for LSC-LT and 0.3830 ± 0.0003 nm for LSC-HT. Chi-scans at strong reflexes showed significant differences between LSC-LT and LSC-HT.
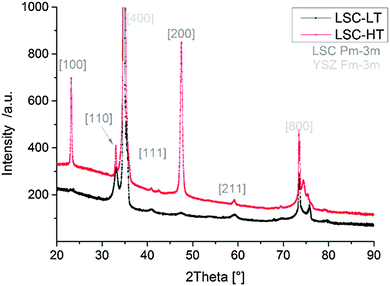
In Fig. 3 the diffraction patterns of LSC-LT and LSC-HT, integrated over the whole measured Chi and Theta range, are shown. Phase and lattice planes were assigned to all visible peaks in the range of 20–80° 2Theta, except for the peaks close to the (400) YSZ reflex. These were largely overshadowed by the strong substrate peak, which impedes a clear phase and lattice plane assignment. A much higher intensity for most of the peaks of the LSC-HT thin film in comparison to the LSC-LT thin film was obtained due to the higher degree of crystallinity. This can even be better seen by the detector frames shown in Fig. 4a. For both thin films the (200) YSZ substrate peak overshadows the (110) LSC peak at 0° Chi. However, the much broader (110) peak visible for the tilted grains at the LSC-LT points to smaller coherent scattering domains in comparison with the LSC-HT (110) peak. Furthermore, some crystallites show a preferably tilted (110) plane of 20° with respect to the (200) YSZ plane for the LSC-HT thin film, as shown in Fig. 4b. For the LSC-LT thin film a homogenous distribution of intensity along the Chi-axis was found, typical for a polycrystalline sample without any preferred crystal orientation.
 | ||
| Fig. 4 (a) 2-Dimensional detector frames of LSC-LT and LSC-HT thin films at 32.8° 2Theta = (110) LSC. (b) Integration along the Chi-axis for LSC-LT and LSC-HT thin film at 32.8° 2Theta = (110) LSC. | ||
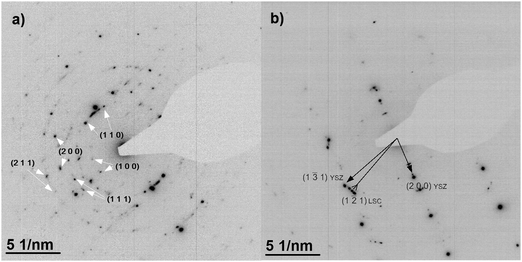
The microstructure of 200 nm PLD thin films prepared from the LSC target was investigated by TEM imaging and diffraction. Cross section images of LSC-LT and LSC-HT are shown in Fig. 5. Dense thin films with columnar growth are observed for both deposition temperatures with different column diameters of about 30–35 nm for LSC-LT and 50–70 nm for LSC-HT. For LSC-LT these columns show diffraction images resembling polycrystalline materials with only slightly preferred orientation of LSC (110) on YSZ (200) as shown in Fig. 6a. LSC-HT in contrast grows highly ordered on YSZ (200), predominantly in the same direction (LSC (110)). Additionally these (110) columns are oriented (with respect to rotation along the column axis) on the YSZ substrate (LSC (121)) on YSZ (131) as shown in Fig. 6b. Due to the large lattice mismatch several different, slightly tilted orientations are realized at film growth. For both thin films, close to the interface, a zone of about 10 nm with a different structure is observed, consisting of very small grains with diameters of only a few nanometers. The observed microstructures with columnar and textured LSC grains for the bigger part of the film are in good agreement with microstructures of La0.58Sr0.4Co0.2Fe0.8O3−δ PLD thin films reported in the literature30 for similar deposition parameters.
Diffusion profiles measured by ToF-SIMS
Poisson corrected secondary ion counts of 56Fe+, 59Co+, 84Sr+, 86Sr+, 87Sr+, 88Sr+, 139La+, and 152Sm+ were used to calculate the normalized tracer fractions denoted as: cFe, cSr, cSm. In the case of Sr, the value of the isotope fraction of c(86Sr) is calculated following eqn (1) and normalized with the values measured in thin films prepared by the three different targets cLSC, cLSC+tracer according to eqn (2). | (1) |
 | (2) |
The values cFe and cSm are normalized values of the atomic distribution of Co/Fe and La/Sm, respectively, with the same initial average values of 1 and 0 in the different virgin layers. However, a slightly different correction is necessary for the two cases to account for the different secondary ion yields in ToF-SIMS for different elements. Additionally, it is necessary to consider that for the determination of cFe and cSm only the majority isotopes, and not all isotopes as in the case of Sr, were analyzed. The normalization was performed by using correction factors (corrCo and corrLa) to account for the differences in atomic composition and the measured secondary ion signals.
 | (3) |
 | (4) |
These corrections are possible, because SIMS matrix effects affecting the secondary ion yields should not play a role in the chemically very similar layers LSC and LSC-T10. Therefore all count rates can be expected to be linear which is necessary for the corrections to be valid. The normalization step is possible as only relative values are necessary to determine diffusion coefficients, and was performed to allow the same fitting procedure for all cations. It has to be noted that only in the case of Sr, true tracer interdiffusion is analyzed, while for the other cations interdiffusion of Fe and Co, as well as Sm and La is studied. Cation interdiffusion coefficients are in general dependent on the concentration. In the investigated depth profiles, however, no indication of concentration dependent diffusion coefficients such as significantly asymmetric concentration profiles, or a shift in depth of the LSC|LSC + tracer interface with annealing time (Kirkendall effect) was observed within the accuracy of the experiment. Consequently, the interdiffusion coefficients of Fe(Co) and Co(Co,Fe) were described by only one diffusion coefficient, and the same was done for the interdiffusion coefficients of Sm(La) and La(La,Sm).
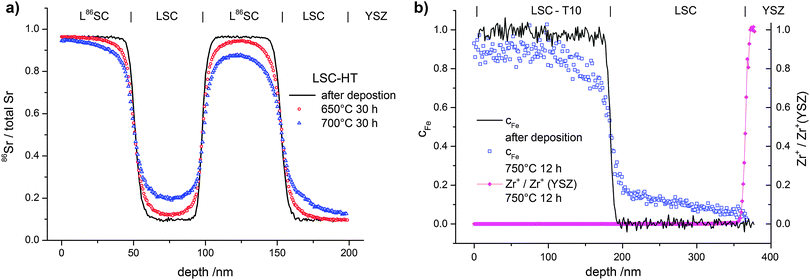
In Fig. 7 typical diffusion profiles before and after annealing are shown. Fig. 7a shows cSr in alternating 4-layers of LSC and L86SC as sketched in Fig. 1a after different annealing steps. In Fig. 7b, the value of cFe in a LSC|LSC-T10 bilayer as sketched in Fig. 1b is plotted before and after annealing. All profiles showed very sharp concentration steps after deposition (before annealing). The smoothening of this step due to annealing indicates that cation diffusion has occurred. The symmetry of the profiles in Fig. 7a indicates constant diffusion coefficients through the entire depth of the 200 nm LSC films. Microstructure or strain related variations of diffusion properties were thus largely negligible, which simplifies the quantitative analysis. Only very close to the YSZ interface (∼10 nm) more pronounced diffusion was observed for similar samples with smaller layer thickness. This could be attributed to the higher grain boundary density in this area (see TEM results). However, the effects of this short zone at the YSZ interface on diffusion profiles in the main part of the 200 nm thick layers were negligible.
The surface quality of the thin films is crucial to verify that real diffusion profiles are measured. In ToF-SIMS depth profiling, an increase of the surface roughness (e.g. during the annealing step) would lead to blurred cation profiles that can easily be misinterpreted as diffusion profiles. The surface roughness of LSC bilayers was therefore investigated by AFM before and after annealing and values of Rs ∼ 2–4 nm (LSC-LT) films and Rs ∼ 4–6 nm (LSC-HT) indicate that no significant increase took place. Further, an adverse effect from an increase of surface roughness could be excluded by investigating the sharpness of the LSC|YSZ interface. As shown in Fig. 7b, after annealing a sample for 12 h at 750 °C the increase of the Zr+ secondary ion signal at the LSC|YSZ is very sharp, even though a considerable profile is visible for cFe in the same measurement.
Fitting procedure
The equation for analyzing depth profiles in order to determine the diffusion coefficient D* is given by Fick's second law: | (5) |
 | (6) |
However, concentration profiles governed by this equation fail to reproduce the measured diffusion profiles. The most probable reason for this is the existence of different cation diffusion coefficients in grains and along grain boundaries. For analyzing grain and grain boundary diffusion in polycrystalline materials, a method introduced by Whipple32 and Le Claire33 is often used. There, a plot of the concentration vs. x6/5 can yield the grain boundary diffusion coefficient. This method, however, is only valid for semi-infinite media, while in our case of thin films only numeric methods could be employed for fitting the tracer depth profiles.
COMSOL Multiphysics 4.0a finite elements software was used to simulate cation diffusion in a 3D model resembling the sample geometry with columnar grains. A modified brick-layer model shown in Fig. 8 was established. The unit cell of the geometry (Fig. 8), which consists of 1/4 grain with two half grain-boundaries on two adjacent sides, was considered in the simulations. The thickness of half a grain boundary was set to 1 nm, as a typical grain boundary thickness of ∼1–2 nm can be expected from literature values for similar oxides.34,35 The width of the 1/4 grain was chosen (16 nm for LSC-LT, 30 nm for LSC-HT) to match the grain sizes observed in TEM images of the thin films (∼32 nm for LSC-LT and ∼60 nm for LSC-HT). The layer thickness of the different thin films (tracer/no tracer) was modeled according to the respective layer thicknesses derived via sputter time and sputter rates and currents from SIMS measurements of virgin bi- or multilayered samples. No grain boundary is expected or modeled at the LSC|LSC + tracer interface.
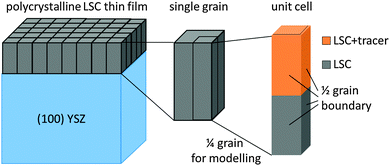 | ||
| Fig. 8 Modified brick-layer model used to model the columnar microstructure of LSC thin films. 1/4 grain of the thin film was used as a unit cell for finite elements simulation. | ||
Fick's second law (eqn (5)) was solved with different bulk and grain boundary diffusion coefficients. Examples of calculated 3D concentration distributions and diffusion profiles obtained by this method are shown in Fig. 9. A simulation of a symmetric 200 nm|200 nm bilayer with Dgb = 1 × 10⁻¹⁵ cm2 s−1, Dg = 1 × 10⁻¹⁸ cm2 s−1, and a diffusion time of 100 h is shown for the two different models (different grain sizes) used for LSC-LT (Fig. 9a) and LSC-HT (Fig. 9b). Faster tracer exchange along the fast grain boundaries and exchange of tracer from the grain boundary into the grains (governed by the smaller grain diffusion coefficient) are visible. Depth profiles were calculated by integration in x–y planes and results are shown in Fig. 9c. The different effective diffusion lengths of the two models are only a consequence of the different grain size and grain boundary density.
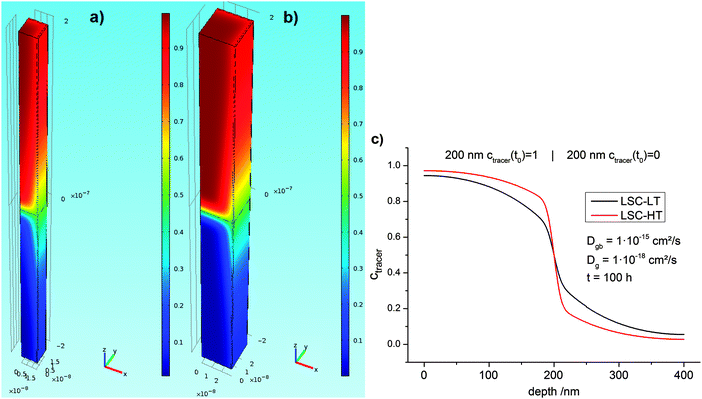 | ||
| Fig. 9 Finite elements simulation of a 1/4 grain with two half grain boundaries as a unit cell of the model shown in Fig. 8. Concentration of the two different grain sizes of LSC-LT (a) and LSC-HT (b) was modeled with the same parameters. Colors indicate concentrations; the initial concentrations are 1 in the upper part and 0 in the lower part of the unit cell. The corresponding integrated depth profiles are shown in (c) and obvious differences in tracer concentration are only caused by the different grain size. | ||
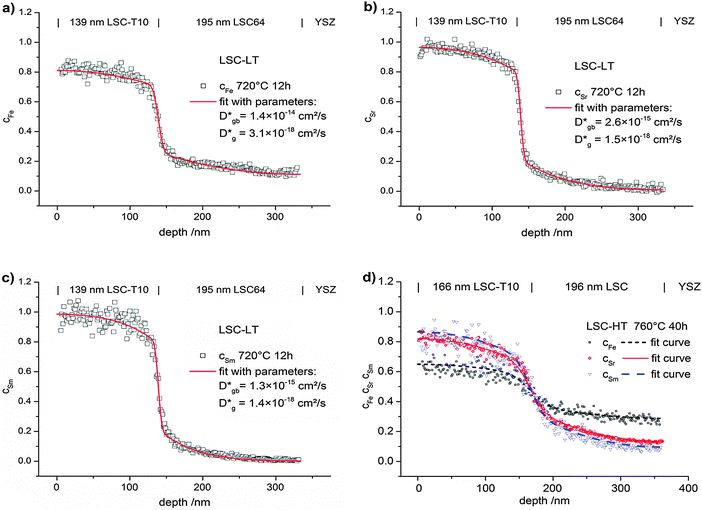
The diffusion coefficients Dgb and Dg were varied manually until the calculated profiles fit the depth profiles recorded by ToF-SIMS. The latter ones were obtained by in-plane integration of the signals in the entire 100 × 100 μm2 area under investigation. Fig. 10 shows typical cation diffusion depth profiles of an LSC bilayer (LSC-T10|LSC|YSZ-substrate) after 12 h at 720 °C. The normalized values of cFe, cSr and cSm which were extracted from the measurements are shown together with the fitting curve from finite elements simulation. The model including grain and grain boundary diffusion describes the experimental data well. Also profiles of LSC bilayers prepared at high temperatures (LSC-HT) can be described by the model. This is exemplarily shown in Fig. 10d for cation diffusion after 40 h at 760 °C.
Temperature dependence and the mechanism of diffusion
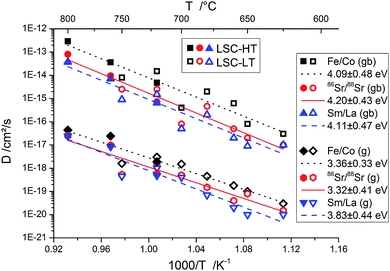
In this work the temperature range of 625–800 °C was selected to investigate cation diffusion. The lower boundary is given by the extremely slow diffusion below 625 °C and the consequently long annealing times (several 100 h) necessary for creating evaluable depth profiles. The upper boundary is caused by the reactivity of LSC with YSZ at high temperatures.6,36 At temperatures above 800 °C and at diffusion times of several hours, the formation of a secondary phase of several nanometers thickness at the LSC|YSZ interface could be observed in ToF-SIMS depth profiles. This formation of a new phase distorts the tracer profiles and changes the thickness of the LSC phase, thus making an evaluation of D values impossible.Fig. 11 shows the Arrhenius-type diagram of the diffusion coefficients in grain boundaries and in grains for the different cations. One has to keep in mind that the diffusion coefficients denoted Fe/Co and Sm/La describe interdiffusion of cations in a diffusion couple. For Sr, the interdiffusion of isotopes is studied and consequently indeed a tracer diffusion coefficient is measured.
From these temperature dependencies of the diffusion coefficients a number of conclusions can be drawn: (i) within the accuracy of the data, each diffusion coefficient can be described by a single activation energy. A systematic deviation of the D values of LSC-LT from those of LSC-HT bilayers was not found. Different diffusion lengths were thus most probably only a consequence of the different grain sizes (60 nm and 32 nm, respectively), cf.Fig. 9. (ii) Grain boundary diffusion was found to be about 3 orders of magnitude faster than diffusion in grains. (iii) All three cations showed very similar activation energies of ∼4.1 eV for grain boundaries and ∼3.5 eV for grains. The diffusion coefficients of all cations were found to be typically within one order of magnitude, and consequently the differences between the three cations were much smaller than the differences between the grain and grain boundary diffusion coefficients. Fe/Co showed the highest diffusion coefficients (grain and grain boundary). This is also visible in Fig. 10 and corresponds well to observations of kinetic demixing of cations reported for La0.5Sr0.5Co1−xFexO3−δ oxygen permeable membranes,37 which suggest Co/Fe to be the most mobile cations in LSC, LSCF, and LSF. The A-site cations Sr and Sm/La showed very similar D values.
Fig. 12 displays a comparison of the data from this work with data reported in the literature for bulk samples of similar MIEC perovskite-type oxides. The activation energies observed in this study are similar to many values found in the literature. Also the similarity of activation energies for A- and B-site cation diffusion was repeatedly reported.17,20,23,38,39 Concerning the absolute values of the diffusion coefficients, there seems to be large scatter in literature values. This might be caused not only by the different perovskite compositions which were investigated, but also by using different types of experiments (impurity diffusion/solid state reaction). Another factor might be that slight deviations from the nominal stoichiometry can have an influence on the concentration of A-site and B-site vacancies and thereby on the measured impurity diffusion coefficients. Because of the exceptionally low temperatures used in this study, values of the diffusion coefficients can only be compared with values extrapolated from literature data. Very similar bulk as well as grain boundary diffusion coefficients can be extrapolated from data for (Ba,Sr)(Co,Fe)O3−δ.23 The large difference in grain and grain boundary diffusion also matches with differences found on (La,Ca)CrO3,15 or (La,Sr)CrO340 at higher temperature.
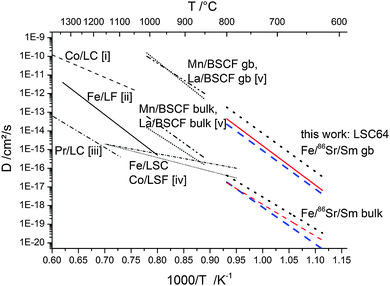 | ||
| Fig. 12 Comparison of diffusion coefficients with values reported in the literature for similar mixed conducting perovskite-type oxides obtained by different methods; solid state reaction: (i) Co in LaCoO3,10 (ii) Fe in LaFeO3;11 impurity diffusion: (iii) Pr in LaCoO3,16 (iv) Co in La0.8Sr0.2FeO3−δ and Fe in La0.8Sr0.2CoO3−δ,22 (v) La and Mn in Ba0.5Sr0.5Co0.8Fe0.2O3−δ.23 | ||
The fact that similar activation energies were observed for all three cations and the differences of ∼4.1 eV for grain boundaries and ∼3.5 eV for grains need further discussion. The higher activation energies of the grain boundaries seem to be contradictory at first, as for the difference of ca. 103 in the absolute values of the diffusion coefficient rather a lower activation energy in grain boundaries would be expected. For the same pre-exponential factor at 700 °C, a 0.55 eV lower activation energy for grain boundaries would explain the 103 higher values of D. A possible explanation of the experimental results is a different formation enthalpy of cation defects in the measured temperature range in grains and grain boundaries. While the cation vacancy concentration in the grains could still be fixed by the stoichiometry (extrinsic) for the investigated temperature range, in grain boundaries the temperature might already be high enough for additional formation of cation vacancies (intrinsic). Under this assumption the activation of the mobility could be ∼3.5 eV in grains with almost no additional contribution from cation vacancy formation, while in grain boundaries the activation of the mobility is lower, but an additional contribution from cation vacancy formation increases the activation energy to the measured value of ∼4.1 eV.
Also the fact that very similar activation energies for the different cations were measured seems to be very surprising when considering the perovskite lattice with respect to A- and B-site barrier heights. The A-site which is occupied by Sr and La(Sm) is twelvefold coordinated by oxygen and much bigger than the B-site, with six-fold octahedral coordination, occupied by Co(Fe). Besides that, the bond type with oxygen and local bond strengths are different for a transition metal on the B-site and a regular metal on the A-site. It would consequently be extremely improbable that a cation migrating from the A-site to an A-site-vacancy has to overcome about the same activation barrier as a cation jumping from the B-site to a B-site-vacancy. Nevertheless, several studies on perovskite-type oxides such as (Ba,Sr)(Co,Fe)O3−δ,23 (La,Sr)(Ga,Mg)O3−δ,17 SrTiO3,21,41 and BaTiO320,38 observed similar activation energies for A- and B-site cations. This raises questions about the exact mechanism relevant for cation diffusion, as the simple picture of cation mobility governed by A- and B-site vacancy migration does not explain the experimental data.
Simulations in perovskite oxide systems consistently found that the formation of vacancy pairs (Schottky disorder) is energetically more favorable (about 3–4.5 eV for LaMnO3,42 LaFeO3,43 and LaGaO344) compared with cation Frenkel disorder (about 9 eV42–44). This large difference practically rules out cation mobility via interstitial sites. The lowest activation energies of 3.9–4.3 eV for a cation vacancy migration in simulations on LaMnO3 were found for A-site vacancies (La) in the (100) direction.42 For the B-site jump the lowest activation energy is on a curved path along the (100) direction, which is activated with 7.7–9.9 eV.42
One possible mechanism capable of explaining the similar activation energies would be A-site cations (Sr and La/Sm) migrating via the normal (100) path to an A-site-vacancy, while B-site cations (Co, Fe) migrate by first switching to an A-site vacancy, and from there to a B-site vacancy.21,41 Another mechanism would involve a defect complex including both an A-site vacancy and a B-site-vacancy17,42,44 that is governing the mobility of both A- and B-site cations, and is therefore leading to the same activation energy for the diffusion coefficients of all cations. Despite oxygen vacancies are far more numerous than cation vacancies in LSC, their effect on the energy barriers and pathways of cation migration is sparsely investigated. One recent theoretical study on SrTiO3 finds a reduction of the activation energy of the Sr vacancy migration by about 0.7 eV, when one or two oxygen vacancies are present in the vicinity.45 Cation mobility in oxides with significant oxygen non-stoichiometry might therefore also be strongly affected by oxygen vacancies. A final conclusion about which migration mechanism is relevant for the diffusion investigated in this work is not possible.
Changes in surface chemistry
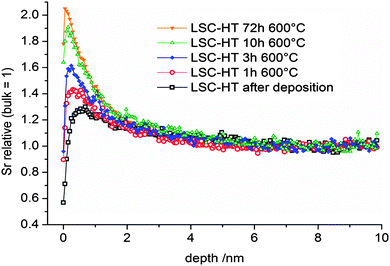
Many perovskite-type oxides have a tendency towards cation segregation at the surface. For LSC and similar oxides such as (La,Sr)(Co,Fe)O3−δ or (La,Sr)MnO3−δ, particularly a segregation of Sr to the surface is often observed.5,7,25,46–49 The Sr enriched surfaces are usually formed at elevated temperatures and are frequently found to inhibit the oxygen reduction reaction and may thus strongly affect SOFC cathode performance.5,7,25,47 A removal of the Sr-rich surface by chemical etching was shown to again expose oxide with bulk composition and higher catalytic activity for oxygen reduction.25,46 The exact driving force of Sr enrichment at the surface is still under debate. Among the factors which are discussed are kinetic demixing under electrical, thermal, or oxygen partial pressure gradients,50–52 or compressive stress on Sr,53 arising from the fact that the ion radius of Sr2+ (144 pm, CN 12) is larger than the radius of La3+ (136 pm, CN 12).54In this work we want to focus on the kinetics of the Sr enrichment and discuss a possible connection to the diffusion of cations. Several driving forces are discussed for the Sr segregation such as reactants at the surface from the gas phase7,55 or elastic and electrostatic contributions in the LSC lattice.56 Assuming any driving force and leaving aside possible dependencies of driving force and kinetics, it seems to be possible that the rate of Sr enrichment is limited by the transport of Sr in LSC to the surface. In order to investigate the possible connection of cation diffusion and the segregation rate, kinetic information on the growth of Sr-rich surface phases is necessary. From ToF-SIMS measurements of the surface, we get first qualitative information of the process. Fig. 13 shows the secondary ion intensity of Sr, relative to its bulk value, in the near surface region of 200 nm LSC-HT films on (100) YSZ for different annealing times at 600 °C in air. It has to be noted that, due to SIMS-artifacts at the surface, no quantitative information on the amount or the diffusion lengths can be extracted from these measurements. Only the qualitative enrichment of Sr with time and the approximate depth of the Sr enrichment (within the first two nm) are extractable information.
For quantification of the surface Sr, inductively coupled plasma-optical emission spectrometry (ICP-OES) was adapted as an analytical method to quantitatively analyze the Sr enrichment of similar LSC thin films, as reported in a preceding work.25 200 nm LSC-HT thin films annealed at 600 °C for 72 h showed an excess of about 0.5 μg cm−2 Sr (∼3.4 × 10¹⁵ Sr ions per cm2) at the surface. This would be equivalent to ∼1 nm of SrO or Sr(OH)2 which are assumed to be the chemical states in which the surface Sr is present.49 Connected with this change in composition at the surface was a one order of magnitude increase of the surface polarization resistance of LSC used as a SOFC cathode.
To compare these kinetic results with the cation diffusion parameters of this work, the measured diffusion coefficients need to be transferred into an amount of Sr that is transported to the surface. First we calculate the diffusion lengths of Sr from the diffusion coefficients according to:
 | (7) |
![[thin space (1/6-em)]](https://www.rsc.org/images/entities/char_2009.gif) 000 h, as an estimate value of aspired durability of a SOFC. The last column represents effective values for combined grain and grain boundary diffusion, see the text
000 h, as an estimate value of aspired durability of a SOFC. The last column represents effective values for combined grain and grain boundary diffusion, see the text
However, several considerations need to be made prior to an interpretation of these data in terms of a possibly rate limiting diffusion. First, not diffusion lengths, but the amount of Sr (MSr) that is transferred from LSC to the surface and from there into the new phase is of interest. Those two parameters are related as shown for a semi-infinite medium and only one diffusion coefficient.31
 | (8) |
Most importantly the segregation, i.e. the diffusion into a different phase is a chemical diffusion and not tracer diffusion. Hence the expected differences between the chemical diffusion coefficient (Dchem) and the tracer diffusion coefficient (D*) need to be discussed. Formally, chemical diffusion is a diffusion of neutral components.57 For charged particles (such as Sr2+), ambipolar diffusion of at least two species is necessary. In our case the other diffusing particles could be either oxide ions (O2−) or electrons. Dchem of neutral Sr or SrO includes diffusion coefficients and concentration of all relevant defects.57 As both possible counter defects (oxygen vacancies, electron holes) have a much higher concentration than Sr vacancies ( ) in LSC and are many orders of magnitude faster, their influence can be neglected and only the diffusion of Sr vacancies is relevant.
To a good approximation the chemical diffusion coefficient is therefore given by the Sr vacancy diffusion coefficient. The difference to the tracer diffusion coefficient of Sr is that, even if there are vacancies necessary for diffusion, the coefficient is referred to the cations, not their vacancies. As the number of vacancies is typically very much smaller than that of ions, (cf. also the high cation vacancy formation energies of 3–4.5 eV discussed above) a difference of at least 2 orders of magnitude can be expected. That would cause the chemical diffusion coefficient to also be at least 2 orders of magnitude higher than the tracer diffusion coefficient. The tracer diffusion coefficient is even further smaller than the chemical diffusion coefficient, particularly since correlation effects which are present in tracer experiments need to be considered. For a perovskite lattice, a further increase of the chemical diffusion coefficient by a factor of 1/fc ∼ 1.45 (ref. 58) can be expected compared to the tracer diffusion coefficient.
Summarizing we can say that chemical diffusion lengths of Sr of ∼5 nm in LSC are already enough for a significant electrochemical degradation of LSC as SOFC cathode. Even though the cation defect concentration and thus the exact ratio between the chemical diffusion coefficient Dchem and the tracer diffusion coefficient D* is not known in our case, Dchem most probably exceeds D* by at least two orders of magnitude. Hence the tracer diffusion length that is sufficient to cause a chemical diffusion length of 5 nm is 0.5 nm or lower (eqn (7)). For combined grain and grain boundary diffusion such an effective diffusion length is achieved already after about 2 h at 600 °C.
According to these considerations it is extremely difficult to control Sr segregation by limiting the diffusion of Sr. Inhibiting Sr segregation of a complete Sr monolayer (requiring ∼0.9 nm diffusion length in LSC) over technologically interesting durations of several 10![[thin space (1/6-em)]](https://www.rsc.org/images/entities/char_2009.gif) 000 hours, e.g. 30
000 hours, e.g. 30![[thin space (1/6-em)]](https://www.rsc.org/images/entities/char_2009.gif) 000 h as in the table, by freezing the cation lattice, and thus keeping Sr from segregating to the surface, would require very low chemical diffusion coefficients of Dchem < 8 × 10⁻²³ cm2 s−1 corresponding to D* < 8 × 10⁻²⁵ cm2 s−1. From extrapolation of the measured bulk tracer diffusion coefficients, it becomes clear that such low diffusion coefficients could only be reached at temperatures of about 460 °C or lower, even in the absence of fast grain boundary diffusion. Therefore, optimizing the microstructure and thus avoiding fast grain boundary diffusion is also not a promising approach. Moreover, working at the low temperatures (≤460 °C) is not a successful strategy, as the polarization resistance of the oxygen reduction reaction on LSC is too high for reasonable SOFC cathode operation.
000 h as in the table, by freezing the cation lattice, and thus keeping Sr from segregating to the surface, would require very low chemical diffusion coefficients of Dchem < 8 × 10⁻²³ cm2 s−1 corresponding to D* < 8 × 10⁻²⁵ cm2 s−1. From extrapolation of the measured bulk tracer diffusion coefficients, it becomes clear that such low diffusion coefficients could only be reached at temperatures of about 460 °C or lower, even in the absence of fast grain boundary diffusion. Therefore, optimizing the microstructure and thus avoiding fast grain boundary diffusion is also not a promising approach. Moreover, working at the low temperatures (≤460 °C) is not a successful strategy, as the polarization resistance of the oxygen reduction reaction on LSC is too high for reasonable SOFC cathode operation.
Therefore we can conclude that Sr diffusion in LSC is too fast for avoiding segregation to the surface within the limits set by its applicability as a SOFC cathode. It also means that diffusion of Sr in LSC is not rate limiting for the growth of Sr-rich surface phases and we suppose the same for similar perovskite oxides. A deeper knowledge of the driving forces and of the exact mechanism of cation segregation in perovskite oxides seems to be necessary to tailor materials properties and/or microstructures for optimal performance and stability in SOFCs.
Conclusions
Cation tracer diffusion was investigated in La0.6Sr0.4CoO3−δ thin films prepared by PLD on single crystalline (100) YSZ substrates. By using high quality bi- and multilayered diffusion couples and ToF-SIMS, cation tracer depth profiles were measured before and after thermal annealing steps in air at comparatively low temperatures of 625–800 °C. The profile shapes as well as the grain size dependence of the profiles indicate that fast grain boundary diffusion strongly affects the measurements. A numerical analysis using finite element calculations allowed the extraction of cation diffusion coefficients for all cations and grains as well as grain boundaries. B-site Fe/Co interdiffusion showed the highest diffusion coefficients, followed by the A-site cations Sr and Sm/La. However, differences were surprisingly small and also similar activation energies of D were found for all cations, which strongly suggest a coupled migration mechanism for A- and B-site cations. Activation energies were slightly higher for grain boundary diffusion (∼4.1 eV) than for grain diffusion (∼3.5 eV) and grain boundary diffusion showed about 3 orders of magnitude larger diffusion coefficients. Moreover, the potential correlation between the diffusion of Sr and surface enrichment and segregation of Sr was investigated. Sr mobility was found to be by far high enough to explain significant surface segregation within short times even below 600 °C. Diffusion of Sr in LSC is thus indirectly shown to be not rate limiting for Sr segregation to the surface. Suppression of cation segregation to the surface at SOFC operation temperatures therefore requires further knowledge and control of the driving forces governing segregation.Acknowledgements
Financial support from Austrian Science Fund (FWF) project P 21960-N17 is gratefully acknowledged.References
- B. C. H. Steele and A. Heinzel, Nature, 2001, 414, 345–352 CrossRef CAS PubMed.
- A. J. Jacobson, Chem. Mater., 2009, 22, 660–674 CrossRef.
- S. B. Adler, Chem. Rev., 2004, 104, 4791–4843 CrossRef CAS PubMed.
- M. Rohnke, M. Falk, A.-K. Huber and J. Janek, J. Power Sources, 2013, 221, 97–107 CrossRef CAS.
- D. Oh, D. Gostovic and E. D. Wachsman, J. Mater. Res., 2012, 27, 1992–1999 CrossRef CAS.
- M. Sase, D. Ueno, K. Yashiro, A. Kaimai, T. Kawada and J. Mizusaki, J. Phys. Chem. Solids, 2005, 66, 343–348 CrossRef CAS.
- E. Bucher, W. Sitte, F. Klauser and E. Bertel, Solid State Ionics, 2012, 208, 43–51 CrossRef CAS.
- G. C. Kostogloudis, G. Tsiniarakis and C. Ftikos, Solid State Ionics, 2000, 135, 529–535 CrossRef CAS.
- T. Akashi, M. Nanko, T. Maruyama, Y. Shiraishi and J. Tanabe, J. Electrochem. Soc., 1998, 145, 2090–2094 CrossRef CAS.
- M. Palcut, K. Wiik and T. Grande, J. Phys. Chem. B, 2007, 111, 2299–2308 CrossRef CAS PubMed.
- J. B. Smith and T. Norby, Solid State Ionics, 2006, 177, 639–646 CrossRef CAS.
- M. Palcut, R. Knibbe, K. Wiik and T. Grande, Solid State Ionics, 2011, 202, 6–13 CrossRef CAS.
- J. B. Smith, T. Norby and A. Fossdal, J. Am. Ceram. Soc., 2006, 89, 582–586 CrossRef CAS.
- S. Miyoshi and M. Martin, Phys. Chem. Chem. Phys., 2009, 11, 3063–3070 RSC.
- T. Horita, M. Ishikawa, K. Yamaji, N. Sakai, H. Yokokawa and M. Dokiya, Solid State Ionics, 1999, 124, 301–307 CrossRef CAS.
- M. Palcut, J. S. Christensen, K. Wiik and T. Grande, Phys. Chem. Chem. Phys., 2008, 10, 6544–6552 RSC.
- O. Schulz, M. Martin, C. Argirusis and G. Borchardt, Phys. Chem. Chem. Phys., 2003, 5, 2308–2313 RSC.
- I. Waernhus, N. Sakai, H. Yokokawa, T. Grande, M. A. Einarsrud and K. Wiik, Solid State Ionics, 2004, 175, 69–71 CrossRef CAS.
- I. Waernhus, N. Sakai, H. Yokokawa, T. Grande, M. A. Einarsrud and K. Wiik, Solid State Ionics, 2007, 178, 907–914 CrossRef CAS.
- S. Koerfer, R. A. De Souza, H. I. Yoo and M. Martin, Solid State Sci., 2008, 10, 725–734 CrossRef CAS.
- K. Gomann, G. Bochardt, M. Schulz, A. Gomann, W. Maus-Friedrichs, B. Lesage, O. Kaitasov, S. Hoffman-Eifert and T. Schneller, Phys. Chem. Chem. Phys., 2005, 7, 2053–2060 RSC.
- H. Kishimoto, N. Sakai, T. Horita, K. Yamaji, M. E. Brito and H. Yokokawa, Solid State Ionics, 2007, 178, 1317–1325 CrossRef CAS.
- S. P. Harvey, R. A. De Souza and M. Martin, Energy Environ. Sci., 2012, 5, 5803–5813 CAS.
- D. P. Norton, in Pulsed Laser Deposition of Thin Films, ed. R. Eason, John Wiley & Sons, Inc., 2007, ch, 1 Search PubMed.
- M. Kubicek, A. Limbeck, T. Frömling, H. Hutter and J. Fleig, J. Electrochem. Soc., 2011, 158, B727–B734 CrossRef CAS.
- J. Januschewsky, M. Ahrens, A. Opitz, F. Kubel and J. Fleig, Adv. Funct. Mater., 2009, 19, 3151–3156 CrossRef CAS.
- G. Rupp, Master thesis, Vienna University of Technology, 2012.
- Y. Ohno, S. Nagata and H. Sato, Solid State Ionics, 1983, 9–10, 1001–1007 CrossRef CAS.
- e. b. D. S. K. ICDD. PDF-4/Organics 2011 (Database), International and N. S. Centre for Diffraction Data, PA, USA, 2010.
- P. Plonczak, A. Bieberle-Hutter, M. Sogaard, T. Ryll, J. Martynczuk, P. V. Hendriksen and L. J. Gauckler, Adv. Funct. Mater., 2011, 21, 2764–2775 CrossRef CAS.
- J. Crank, The Mathematics of Diffusion, Oxford University Press, Oxford, 2nd edn, 1979 Search PubMed.
- R. T. P. Whipple, Philos. Mag. Ser. 7, 1954, 45, 1225–1236 CrossRef CAS.
- A. D. Le Claire, Br. J. Appl. Phys., 1963, 14, 351–356 CrossRef.
- A. Subramaniam, C. T. Koch, R. M. Cannon and M. Rühle, J. Mater. Sci. Eng. A, 2006, 422, 3–18 CrossRef.
- J. Xing, H. Gu, Y. U. Heo and M. Takeguchi, J. Mater. Sci., 2011, 46, 4361–4367 CrossRef CAS.
- O. Yamamoto, Y. Takeda, R. Kanno and M. Noda, Solid State Ionics, 1987, 22, 241–246 CrossRef CAS.
- H. L. Lein, K. Wiik and T. Grande, Solid State Ionics, 2006, 177, 1587–1590 CrossRef CAS.
- H. I. Yoo, C. E. Lee, R. A. De Souza and M. Martin, Appl. Phys. Lett., 2008, 92, 252103 CrossRef.
- J. S. Xu, D. Yamazaki, T. Katsura, X. P. Wu, P. Remmert, H. Yurimoto and S. Chakraborty, J. Geophys. Res.: Solid Earth, 2011, 116, B12205 CrossRef.
- N. Sakai, K. Yamaji, T. Horita, H. Negishi and H. Yokokawa, Solid State Ionics, 2000, 135, 469–474 CrossRef CAS.
- R. Meyer, R. Waser, J. Helmbold and G. Borchardt, Phys. Rev. Lett., 2003, 90, 105901 CrossRef PubMed.
- R. A. De Souza, M. S. Islam and E. Ivers-Tiffee, J. Mater. Chem., 1999, 9, 1621–1627 RSC.
- A. Jones and M. S. Islam, J. Phys. Chem. C, 2008, 112, 4455–4462 CAS.
- R. A. De Souza and J. Maier, Phys. Chem. Chem. Phys., 2003, 5, 740–748 RSC.
- A. Walsh, C. R. A. Catlow, A. G. H. Smith, A. A. Sokol and S. M. Woodley, Phys. Rev. B Condens. Matter Mater. Phys., 2011, 83, 220301 CrossRef.
- S. P. Jiang and J. G. Love, Solid State Ionics, 2001, 138, 183–190 CrossRef CAS.
- P. Hjalmarsson, M. Sogaard and M. Mogensen, Solid State Ionics, 2008, 179, 1422–1426 CrossRef CAS.
- Z. Cai, Y. Kuru, J. W. Han, Y. Chen and B. Yildiz, J. Am. Chem. Soc., 2011, 133, 17696–17704 CrossRef CAS PubMed.
- Z. H. Cai, M. Kubicek, J. Fleig and B. Yildiz, Chem. Mater., 2012, 24, 1116–1127 CrossRef CAS.
- D. Monceau, M. Filal, M. Tebtoub, C. Petot and G. Petot-Ervas, Solid State Ionics, 1994, 73, 221–225 CrossRef CAS.
- K. Szot, W. Speier, J. Herion and C. Freiburg, Appl. Phys. A: Mater. Sci. Process., 1996, 64, 55–59 CrossRef.
- M. Y. Oh, A. Unemoto, K. Amezawa and T. Kawada, J. Electrochem. Soc., 2012, 159, F659–F664 CrossRef CAS.
- W. Jung and H. L. Tuller, Energy Environ. Sci., 2012, 5, 5370–5378 CAS.
- R. Shannon, Acta Crystallogr., Sect. A: Fundam. Crystallogr., 1976, 32, 751–767 CrossRef.
- E. Bucher, C. Gspan, F. Hofer and W. Sitte, Solid State Ionics, 2013, 238, 15–23 CrossRef CAS.
- W. Lee, J. W. Han, Y. Chen, Z. Cai and B. Yildiz, J. Am. Chem. Soc., 2013, 135, 7909–7925 CrossRef CAS PubMed.
- J. Maier, Physical Chemistry of Ionic Materials. Ions and Electrons in Solids, John Wiley & Sons, Ltd, Chichester, 2004 Search PubMed.
- T. Ishigaki, S. Yamauchi, K. Kishio, J. Mizusaki and K. Fueki, J. Solid State Chem., 1988, 73, 179–187 CrossRef CAS.
| This journal is © the Owner Societies 2014 |

