 Open Access Article
Creative Commons Attribution 3.0 Unported Licence
Competition between hydrogen bonding and dispersion interactions in the crystal structures of the primary amines†‡
Andrew G. P.
Maloney
a,
Peter A.
Wood
b and
Simon
Parsons
*a
aEaStCHEM School of Chemistry and Centre for Science at Extreme Conditions, The University of Edinburgh, King's Buildings, West Mains Road, Edinburgh, Scotland EH9 3JJ, UK. E-mail: s.parsons@ed.ac.uk; Fax: +44 (0)131 650 4743; Tel: +44 (0)131 650 5804
bCambridge Crystallographic Data Centre, 12 Union Road, Cambridge, England CB2 1EZ, UK
First published on 3rd March 2014
Abstract
The crystal structures of the primary amines from ethylamine to decylamine have been determined by X-ray diffraction following in situ crystallisation from the liquids. In the series from propylamine to decylamine structures remain in the same phase on cooling from the melting point to 150 K, and the structures of these compounds were determined by single-crystal methods. By contrast, ethylamine undergoes a slow reconstructive phase transition on cooling to 150 K. The structure of the high-temperature form was determined by single-crystal methods at 180 K, while that of the low-temperature form was determined by powder diffraction at 150 K. The stability of the low-temperature form can be ascribed in part to more energetic hydrogen bond formation. PIXEL calculations indicate that hydrogen bonding and methyl–methyl interactions at the chain ends are optimised in the early members of the series, with particularly inefficient inter-chain interactions observed for propylamine and pentylamine. In the later members of the series dispersion interactions become the principal structure-directing interaction and the energies of the hydrogen bonds and methyl–methyl interactions become weaker to accommodate more efficient inter-chain packing. The weakest methyl–methyl interactions occur in heptyl- and nonyl-amines. Overall, intermolecular interactions in the even membered amines are stronger and the packing more efficient than in the odd members, leading to an alternation in melting points along the series, an effect reminiscent of results obtained for the alkanes, carboxylic acids and several α–ω alkyl derivatives.
1. Introduction
Provided suitable functional groups are present, crystal packing in molecular materials is often considered to be directed by hydrogen bond formation. The predictability and robustness of hydrogen bonds make them natural choices for synthons in crystal engineering: a recent survey1 of the most important and reproducible supramolecular synthons was dominated by hydrogen-bonded dimers with energies of up to 70 kJ mol−1. When interpreting crystal structures, too, hydrogen bonds are easily recognised because they are both short and highly directional, and their formation provides convincing explanation for why a particular structure has formed.While the directionality of H-bonds makes them very useful in design of strategies for crystal engineering, it is possible to over-emphasise their importance when interpreting crystal structures, for example when identifying which contacts might be amenable to modification by changing temperature or pressure or formation of a co-crystal. The point has recently been made by Gavezzotti2 that this can lead us to ignore other significant, but less easily recognised, intermolecular interactions. The crystal structure of serine hydrate is an illustrative example.3 It consists of layers of serine molecules connected together by layers of water molecules, which form hydrogen bonds to serine molecules in the layers above and below. But this interpretation of the structure completely neglects the importance of interlayer electrostatic interactions between the NH3+ and CO2− moieties of zwitterionic serine molecules. The energies of these interactions are 48 kJ mol−1 for a centroid–centroid distance of over 8 Å compared to energies of 49 and just 2 kJ mol−1 for the water⋯serine interactions in which the H⋯O distances are ca. 1.9 Å.
The serine hydrate example shows that electrostatic interactions have substantial energies over much longer distances than are usually considered for intermolecular interactions, and this makes them difficult to recognise. Likewise, significant dispersion (or van der Waals) interactions are also hard to identify from geometrical data alone because they contain no distinctive interatomic contacts. Stacking interactions might be considered to be an exception, but even here the range of possible geometries seen in crystal structures is substantial, and interactions with large ring off-sets may still be stabilising. In aniline,4 for example, π⋯π stacking interactions with a centroid–centroid distance of 5.8 Å have the same interaction energies (12 kJ mol−1) as the NH⋯N hydrogen bonds. Indeed, the NH⋯N hydrogen bonds are not the strongest intermolecular interactions in aniline at all, being about half the strength of NH⋯π contacts. They even become destabilising at elevated pressure.
A complete view of the relative importance of different intermolecular interactions in the examples cited above was only obtained by evaluating intermolecular energies rather than relying on geometrical analysis alone. Though a number of methods are available for calculating intermolecular interaction energies, the PIXEL method is becoming established as a rapid and accurate method for this application.5–10 In the PIXEL method an intermolecular energy is evaluated by summing energy contributions arising from all pairs of volume elements (‘pixels’) contained in the electron density distributions of the two molecules in question. The electron densities can be obtained using conventional quantum mechanical methods, such as MP2 or DFT. The calculations yield a lattice energy broken down into contributions from individual intermolecular interactions for a crystal structure. The lattice energies show good agreement with experimental sublimation energies and individual contact energies are as accurate as those from high-level quantum mechanical methods.1,11,12 Moreover, the contact energies are broken down into chemically meaningful electrostatic, polarisation, dispersion and repulsion terms. These calculations, which take only a few hours on a desktop computer, are having a transformative effect on the analysis of crystal structures.
In this paper we describe the crystal structures of the primary amines from ethylamine to decylamine, and use PIXEL calculations to identify the point at which inter-chain dispersion interactions become the dominant intermolecular contacts. We also describe the effect that this dominance has on the hydrogen bonds. Amines were chosen for this study because NH⋯N interactions are amongst the weakest conventional H-bonds, having energies of 10–20 kJ mol−1; for comparison OH⋯O energies are 20–40 kJ mol−1 in phenols and carboxylic acids.9 The primary amines are therefore an ideal system to investigate the extent of stabilisation provided by H-bonding relative to dispersion interactions as the latter increase with chain length.
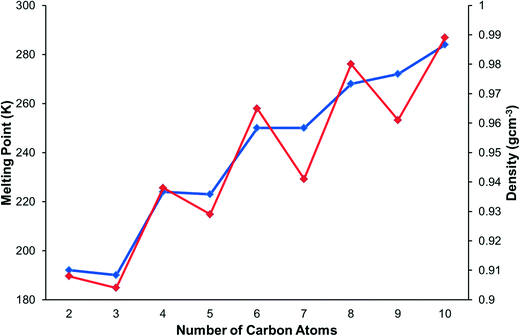
Improvements in in situ crystallisation instrumentation and techniques have allowed for studies of n-alkanes and their derivatives to become much more practical in the last twenty years. The structures of the alkanes themselves are described in a classic paper by Boese,13 who also studied the α,ω-alkanediols and α,ω-alkanediamines,14 α,ω-alkanedithiols,15 and α,ω-alkanedicarboxylic acids.16 Bond has investigated the structures of the n-alkyl carboxylic acids.17 Topological analysis of the alkane structures showed that the shapes of the odd numbered alkanes leads to inefficient packing in the regions where methyl groups are positioned next to each other. This resolved the long-standing question of the source of the alternation of melting points along the series, in which the odd alkanes have lower melting points than their neighbouring even-membered homologues. The melting points of the primary amines also alternate, with odd members of the series having lower melting points than the even members (Fig. 1). This appears counter-intuitive in the context of Boese's results since an even amine has an odd chain length (e.g. butylamine has a five-membered chain containing 4C + 1N), and this study will also reveal how hydrogen bonding modifies the packing of the alkyl chains.
2. Experimental
2.1 General procedure
All compounds were obtained from Sigma Aldrich or Acros Organics and used as received; all are liquid at room temperature. In a typical experiment the sample was drawn into a thin glass capillary (o.d. 0.2–0.3 mm) and sealed before being cooled to 10 K below the literature melting point, to form a polycrystalline solid. An OHCD Laser Assisted Crystal Growth Device was then used to crystallise the sample for X-ray analysis by way of zone-melting procedures outlined by Boese18 and Guru Row.19 Crystal growth was effected by running the laser up the capillary over the course of between five and ten three minute cycles, with the starting point moved further up the capillary for each cycle. This process yielded oriented “oligocrystalline” samples containing a number of individual needle-like crystals. The diffraction pattern of one crystallite was extracted and indexed using RLATT.20X-ray data were collected at 150 K on a Bruker three-circle Apex II diffractometer equipped with an Oxford Cryosystems low-temperature device.21 Following integration by SAINT,22 a multi-scan absorption correction was applied (SADABS).23 The structures were solved by direct methods (SIR92)24 and refined against |F|2 using all data (CRYSTALS).25 Hydrogen atoms were located in difference maps and refined subject to restraints placed on bond distances, angles and isotropic displacement parameters. Carbon and nitrogen atoms were refined freely with anisotropic displacement parameters. Crystal and refinement parameters for all structures are listed in Table 1. CCDC 978652–978661 contains the supplementary crystallographic data for this paper.
| Ethylamine 1 | Ethylamine 2 | Propylamine | Butylamine | Pentylamine | |
|---|---|---|---|---|---|
| Crystal data | |||||
| Chemical formula | C2H7N | C2H7N | C3H9N | C4H11N | C5H13N |
| M r | 45.08 | 45.09 | 59.11 | 73.14 | 87.16 |
| Crystal system | Monoclinic | Monoclinic | Orthorhombic | Orthorhombic | Orthorhombic |
| Space group | P21/c | P21/c | Pbcn | Pbcn | Pbcn |
| Temperature (K) | 180 | 150 | 150 | 150 | 150 |
| a (Å) | 8.2633(3) | 8.97420(18) | 23.2870(13) | 26.7852(8) | 33.546(4) |
| b (Å) | 7.3098(3) | 5.21927(8) | 6.2354(4) | 6.8166(2) | 6.4878(8) |
| c (Å) | 5.5317(2) | 7.40243(16) | 5.9794(4) | 5.6703(2) | 5.7295(7) |
| α (°) | 90 | 90 | 90 | 90 | 90 |
| β (°) | 99.088(3) | 112.9722(13) | 90 | 90 | 90 |
| γ (°) | 90 | 90 | 90 | 90 | 90 |
| V (Å3) | 329.94(2) | 319.22(1) | 868.23(9) | 1035.31(6) | 1247.0(3) |
| Z | 4 | 4 | 8 | 8 | 8 |
| Radiation type | Mo Kα | Cu Kα1, l = 1.540596 Å | Mo Kα | Mo Kα | Mo Kα |
| μ (mm−1) | 0.06 | 0.45 | 0.06 | 0.06 | 0.06 |
| Specimen size (mm) | 2.00 × 0.20 × 0.20 | 2.00 × 0.20 × 0.20 | 2.00 × 0.30 × 0.30 | 2.00 × 0.45 × 0.45 | 2.00 × 0.30 × 0.30 |
| Data collection | |||||
| Diffractometer | Bruker Apex2 diffractometer | Bruker D8 Advance diffractometer | Bruker Apex2 diffractometer | Bruker Apex2 diffractometer | Bruker Apex2 diffractometer |
| Specimen mounting | — | Capillary | — | — | — |
| Data collection mode | — | Transmission | — | — | — |
| Data collection method | ω scans | Step | ω scans | φ & ω scans | ω scans |
| Absorption correction | Multi-scan SADABS | — | Multi-scan SADABS | Multi-scan SADABS | Multi-scan SADABS |
| T min, Tmax | 0.79, 0.99 | — | 0.80, 0.98 | 0.82, 0.98 | 0.75, 0.98 |
| No. of measured, independent and observed [I > 2.0σ(I)] reflections | 3375, 679, 614 | — | 9836, 890, 690 | 7989, 1572, 1327 | 7311, 1275, 547 |
| R int | 0.027 | — | 0.059 | 0.026 | 0.075 |
| θ values (°) | θ max = 26.4, θmin = 2.5 | θ min = 2 θmax = 32.5 | θ max = 26.4, θmin = 1.8 | θ max = 30.5, θmin = 1.5 | θ max = 26.4, θmin = 1.2 |
| (sin θ/λ)max (Å−1) | 0.625 | — | 0.626 | 0.714 | 0.626 |
| Refinement | |||||
| R factors and goodness of fit | R 1[F2 > 2σ(F2)] = 0.038, wR2(F2) = 0.085, S = 0.93 | R p = 3.211, Rwp = 4.943, Rexp = 2.370, χ2 = 4.347 | R 1[F2 > 2σ(F2)] = 0.060, wR2(F2) = 0.149, S = 0.99 | R 1[F2 > 2σ(F2)] = 0.047, wR2(F2) = 0.142, S = 1.11 | R 1[F2 > 2σ(F2)] = 0.061, wR2(F2) = 0.196, S = 0.96 |
| No. of reflections/data points | 679 | 6694 | 883 | 1572 | 1274 |
| No. of parameters | 56 | 60 | 73 | 90 | 107 |
| No. of restraints | 27 | 6 | 36 | 45 | 54 |
| H-atom treatment | Restrained refall | Rigid body | Restrained refall | Restrained refall | Restrained refall |
| Δρmax, Δρmin (e Å−3) | 0.18, −0.12 | — | 0.29, −0.29 | 0.26, −0.11 | 0.18, −0.20 |
| Hexylamine | Heptylamine | Octylamine | Nonylamine | Decylamine | |
|---|---|---|---|---|---|
| Crystal data | |||||
| Chemical formula | C6H15N | C7H17N | C8H19N | C9H21N | C10H23N |
| M r | 101.19 | 115.22 | 129.25 | 143.27 | 157.30 |
| Crystal system | Orthorhombic | Monoclinic | Orthorhombic | Monoclinic | Orthorhombic |
| Space group | Pca21 | P21/c | Pca21 | P21/c | Pca21 |
| Temperature (K) | 150 | 150 | 150 | 150 | 150 |
| a (Å) | 6.9725(3) | 5.5669(5) | 7.0309(5) | 5.5458(2) | 7.0660(4) |
| b (Å) | 17.7977(6) | 41.700(4) | 22.3077(15) | 50.6527(17) | 26.8352(15) |
| c (Å) | 5.6105(2) | 6.9982(7) | 5.5826(4) | 7.0521(2) | 5.5730(3) |
| α (°) | 90 | 90 | 90 | 90 | 90, |
| β (°) | 90 | 90 | 90 | 90.040(2) | 90 |
| γ (°) | 90 | 90 | 90 | 90 | 90 |
| V (Å3) | 696.23(5) | 1624.6(3) | 875.59(11) | 1981.00(11) | 1056.74(10) |
| Z | 4 | 8 | 4 | 8 | 4 |
| Radiation type | Mo Kα | Mo Kα | Mo Kα | Mo Kα | Mo Kα |
| μ (mm−1) | 0.06 | 0.06 | 0.06 | 0.06 | 0.06 |
| Specimen size (mm) | 1.00 × 0.41 × 0.41 | 2.00 × 0.45 × 0.45 | 2.00 × 0.23 × 0.23 | 2.00 × 0.40 × 0.40 | 2.00 × 0.25 × 0.25 |
| Data collection | |||||
| Diffractometer | Bruker Apex2 diffractometer | Bruker Apex2 diffractometer | Bruker Apex2 diffractometer | Bruker Apex2 diffractometer | Bruker Apex2 diffractometer |
| Data collection method | ω scans | ω scans | ω scans | ω scans | φ & ω scans |
| Absorption correction | Multi-scan SADABS | Multi-scan SADABS | Multi-scan Twinabs | Multi-scan SADABS | Multi-scan SADABS |
| T min, Tmax | 0.83, 0.98 | 0.67, 0.98 | 0.65, 0.99 | 0.86, 0.98 | 0.81, 0.99 |
| No. of measured, independent and observed [I > 2.0σ(I)] reflections | 8013, 913, 794 | 2893, 2893, 1116 | 16![[thin space (1/6-em)]](https://www.rsc.org/images/entities/char_2009.gif) 559, 998, 980 559, 998, 980 |
3641, 3641, 1162 | 9645, 1286, 1182 |
| R int | 0.033 | 0.097 | 0.075 | 0.078 | 0.048 |
| θ values (°) | θ max = 28.7, θmin = 1.1 | θ max = 26.4, θmin = 2.0 | θ max = 26.5, θmin = 1.8 | θ max = 25.4, θmin = 1.6 | θ max = 27.1, θmin = 1.5 |
| (sin θ/λ)max (Å−1) | 0.675 | 0.626 | 0.627 | 0.602 | 0.641 |
| Refinement | |||||
| R factors and goodness of fit | R 1[F2 > 2σ(F2)] = 0.042, wR2(F2) = 0.108, S = 1.01 | R 1[F2 > 2σ(F2)] = 0.075, wR2(F2) = 0.313, S = 1.09 | R 1[F2 > 2σ(F2)] = 0.054, wR2(F2) = 0.108, S = 1.00 | R 1[F2 > 2σ(F2)] = 0.037, wR2(F2) = 0.143, S = 0.88 | R 1[F2 > 2σ(F2)] = 0.054, wR2(F2) = 0.123, S = 0.98 |
| No. of reflections/data points | 910 | 2893 | 998 | 2585 | 1281 |
| No. of parameters | 124 | 282 | 158 | 350 | 192 |
| No. of restraints | 64 | 144 | 82 | 180 | 100 |
| H-atom treatment | Restrained refall | Constrained | Restrained refall | Restrained refall | Restrained refall |
| Δρmax, Δρmin (e Å−3) | 0.26, −0.13 | 0.54, −0.50 | 0.17, −0.17 | 0.09, −0.13 | 0.30, −0.16 |
2.2 Heptylamine, octylamine and nonylamine
The structures of heptylamine, octylamine and nonylamine were found to form twinned crystals. Heptylamine and nonylamine are monoclinic but with β close to 90°, and a two-fold axis about a was used to model pseudomerohedral twinning in both cases. The twin scale factors were found to be 0.227(6) and 0.205(2) for heptylamine and nonylamine, respectively.The crystal of octylamine was a non-merohedral twin with the following twin law:
Overlap of reflections from the different domains was modest and only data from the more intense domain was used for refinement.
2.3 Ethylamine
A crystal of ethylamine grown at 180 K underwent a phase transition upon cooling to 150 K, becoming polycrystalline. Single crystal diffraction data collected at 180 K were used to determine the structure of the high-temperature phase as described above; that of the low-temperature phase was investigated using powder methods.A sample of ethylamine in a glass capillary was mounted onto a Bruker D8 Advance powder diffractometer equipped with a Lynxeye position-sensitive detector and an Oxford Cryosystems low-temperature device. The radiation source was Ge-monochromated CuKα1. The sample froze immediately to a polycrystalline powder on mounting at 180 K. Powder diffraction data were collected in 2 hour scans between 2θ = 5–65°. Successive patterns showed that a phase transition was occurring slowly, but even after 12 hours the pattern consisted of a mixture of phase 1 (which had been identified previously by single-crystal diffraction) and a new phase 2.
The temperature was cycled between 100 and 150 K, monitoring a characteristic phase 1 peak at 2θ = 16°. After three cycles this peak was no longer present. Data were then collected at 150 K in eight 2 hour scans; the patterns were summed to give a single data set for further analysis.
The first 2 hour pattern collected at 180 K could be modelled (Topas-Academic)26 as pure phase 1 using the coordinates determined by single crystal diffraction. The instrument contribution to the line shape was modelled using fundamental parameters, with a pseudo-Voigt convolution to account for sample broadening. A nine-term Chebychev polynomial was used for the background. The coordinates were held fixed at the values obtained from the single crystal study. Amines form needle-like crystals, and preferred orientation was severe; it was modelled with a spherical harmonic expansion to eighth order. Rwp = 7.44%, S = 1.33. The final Rietveld fit is shown in Fig. 2a.
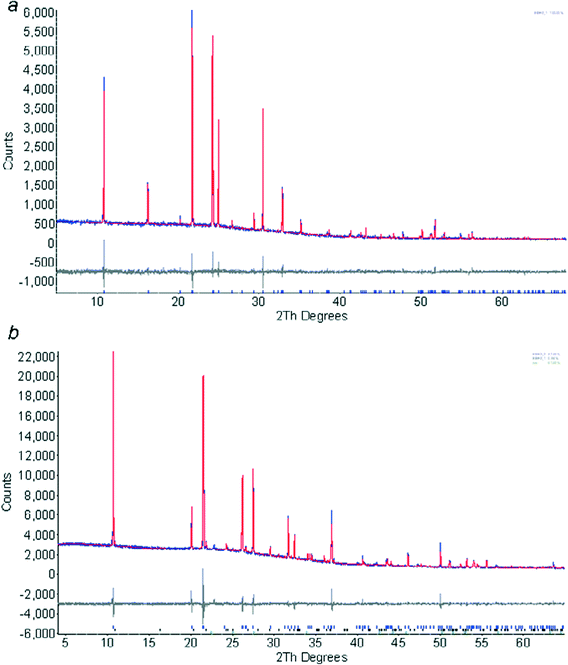 | ||
| Fig. 2 Final fits obtained after Rietveld refinement of ethylamine phase 1 at 180 K (a) and phase 2 at 150 K (b). The colour scheme is blue (observed), red (calculated) and grey (difference). | ||
The powder pattern of phase 2 was indexed using DICVOL27 as incorporated into DASH Version 3.228 on the basis of 16 reflections. The M(16) parameter for the indexing was 73.0. Attempts to solve the structure by simulated annealing in DASH were not successful, presumably because of the extreme preferred orientation present in the sample. Instead the structure was solved in Topas, treating the ethylamine molecule as a rigid body, but allowing spherical harmonic preferred orientation parameters to optimise as well. The structure was solved in a few minutes by this procedure. The positions of the NH2 hydrogen atoms were confirmed by carrying out geometry optimisations using periodic DFT-D calculations (DMOL3 code29 as implemented in Materials Studio).30 The PBE exchange correlation functional31 was used with the DNP basis set,32 a cut-off of 3.7 Å and a correction for dispersion as described by Grimme.33 Integrations were carried out on a 2 × 3 × 2 k-point grid. The cell parameters were held fixed at values from a Pawley refinement. Three calculations were performed, starting from different values of the H–N–C–C torsion angle. An initial torsion angle of 60° yielded the lowest energy optimised structure, with an amino conformation which is similar to those in the rest of the series. Optimisation starting from torsion angles of 180° and −60° gave structures which were 12.2 and 65.0 kJ mol−1 higher in energy, the latter because of unfavourable H⋯H intermolecular interactions. The model was refined, restraining the orientation and position of the molecule to the DMOL3 values in the manner described in ref. 4. Internal geometry (i.e. the distances, angles and torsions) were constrained to values derived from the DFT-optimisations, allowing them to vary had negligible effect on the data fitting parameters. Also included in the model was a single peak to model ice (which had begun to accumulate on the sample tube) and a small amount of phase 1. Rwp = 4.94%, S = 2.09. The final Rietveld fit is shown in Fig. 2b.
The total DFT-D energy of phase 2 was found to be 2.9 kJ mol−1 lower than that of phase 1. The fact that it is lower inspires some confidence in the solution of this phase obtained from the powder diffraction study.
2.4 PIXEL calculations
Electron densities were calculated using Gaussian0934 at the MP235 level of theory with the 6-31G** basis set using molecular geometries derived from the crystal structures with NH and CH distances extended to 1.015 and 1.089 Å.36 This ‘normalisation’ corrects approximately for the effects of asphericity of H-atom electron densities which lead to systematic shortening of distances involving hydrogen atoms when determined by X-ray diffraction. The PIXEL method, as implemented in the program suite OPiX,37 was then used to calculate the intermolecular interaction energies. The principal intermolecular contact energies are listed in the ESI,‡ Section S1. The sublimation enthalpies of the primary monoamines have apparently not been determined, so the lattice energies obtained cannot be compared with experimental data.2.5 Molecular modeling
Optimization of model structures of propylamine, butylamine and pentylamine was carried out in Materials Studio. For example, the structure of propylamine was optimized starting from a model consisting of propylamine molecules occupying the molecular positions in the crystal structure of butylamine. To create this model, space group symmetry was removed from the crystal structure of butylamine to leave a single molecule. The terminal methyl group was changed into a hydrogen atom, and molecular geometry optimization was performed by DFT (DMOL3). The PBE exchange correlation functional was used with the DNP basis set. The original space group symmetry and lattice translations of the butylamine crystal structure were then re-imposed to obtain a model of propylamine molecules on butylamine positions. The Forcite module of Materials Studio was then used to perform a geometry optimization, using the Conjugate Gradient algorithm with the COMPASS force-field38 and Hirshfeld charges calculated in the DFT optimization. The same method was used to optimize the crystal structures of propyl-, butyl- and pentylamine from different starting geometries.2.6 Void calculations
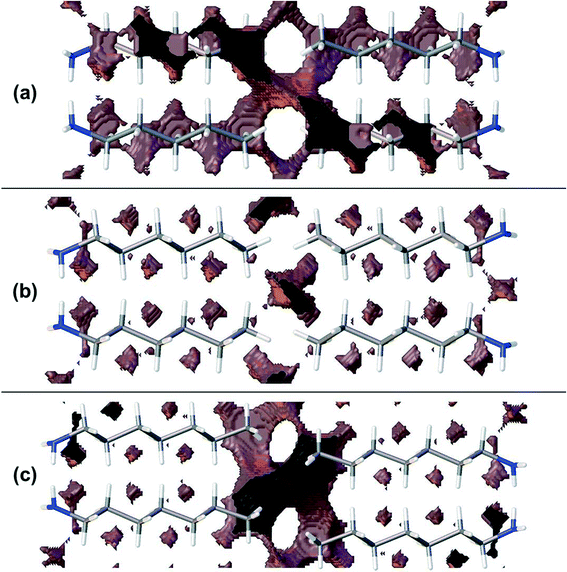
Void calculations were performed using OLEX2 v.1.2.2.39 This program allows control of void searches through specification of the distance from the molecular surface used to define the boundary of interstitial voids. Void analysis at a distance of 0.5 Å from the molecular surface yielded an overall view of void space in the structures. It was found to be possible to quantify void space in the Me⋯Me region only by carrying out the analysis using a distance of 0.7 Å, enabling differences in packing efficiency in this region of the structures to be quantified.2.7 Other programs used
Crystal structures were visualized in Mercury.40 Searches of the Cambridge Structural Database utilized the program ConQuest41 with database updates up to November 2012. Geometric calculations were carried out using PLATON.42 Hirshfeld surface analysis was accomplished with CrystalExplorer version 3.433. Results and discussion
3.1 Melting point and density alternation
The melting points and densities (calculated from crystal structures) of the primary amines are plotted in Fig. 1. The melting points alternate, with the odd members of the series having a systematically lower melting point than their even neighbours. The densities also alternate in a way that matches the trend of the melting points.3.2 Crystal structures and intermolecular energy calculations
Table 1 lists the unit cell parameters of the primary monoamines from ethylamine to decylamine. With the exception of ethylamine all structures are orthorhombic or, in the case of heptylamine and nonylamine, pseudo-orthorhombic. The unit cells have one dimension of ~5.7 Å and another of ~7.0 Å; the third axis is much longer. The identities of the short, medium and long axes vary according to the space group setting used. The alkyl chains are oriented along the long axis which generally increases in length with chain length, though from hexylamine to decylamine it should be noted that the length of the long axis alternates between even and odd numbered carbon chains. This is a result of the number of molecules in the unit cell varying from 4 for even numbered carbon chains to 8 for odd numbered chains. Propylamine, butylamine and pentylamine can be seen to pack in a different space group to the longer-chain compounds. However, Pca21 (in its Pbc21 setting) is related to Pbcn by removal of an inversion centre.In the series of compounds investigated, N–C bond distances range from 1.451(4) Å to 1.465(1) Å and the C–C bond distances from 1.508(8) Å to 1.529(3) Å, while the N–C–C–C and C–C–C–C torsion angles along the chains lie between 176.5(18)° and 184.5(3)°. This shows that the C–N skeleton of all of the molecules is approximately planar. When viewed along the NC bond the orientation of the amino group is such that the two NH bonds lie either side of the first C–C bond of the alkyl chain.
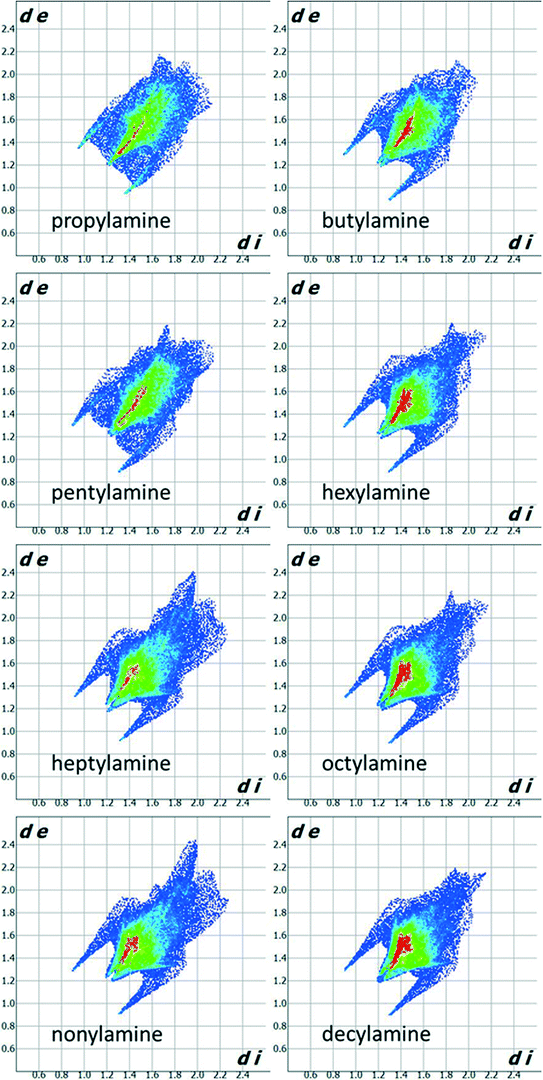
Fig. 3 shows Hirshfeld fingerprint plots44 which summarise similarities and differences in packing. The two spikes present for all compounds in the series are characteristic of hydrogen bonding interactions. The collection of points between the spikes in the propylamine and pentylamine plots distinguishes these from the other members of the series. The red area down the diagonal of the plots arises from the interactions between carbon chains. The higher incidence of red points on the plot for the even amines indicates that there are more short contacts present between the carbon chains and thus more efficient packing, consistent with the melting point and density alternation discussed in Section 3.1.
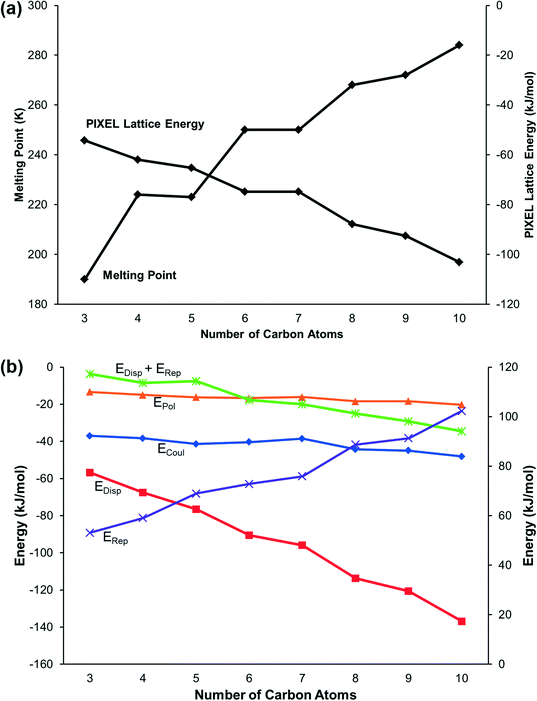
Lattice energies, calculated using the PIXEL method, alternate between odd and even members of the series in correlation with the melting points (Fig. 4a). The constituent energy terms (Fig. 4b) show that while the Coulombic and polarisation interactions remain relatively constant, dispersion and repulsion energies vary significantly. The dispersion interaction increases with the length of the carbon chain but not monotonically: there is an alternation between odd and even membered carbon chains which reflects the alternation in packing efficiency discussed above.
The energy calculations identify the five principal intermolecular contacts as two hydrogen bonding and three dispersion interactions formed parallel to long axes of the molecules (see ESI,‡ Section S1). Fig. 5 shows the sums of the energies of the hydrogen bonds and the dispersion interactions and the total energies of these contacts for each compound. For the early primary amines (propylamine to pentylamine) the hydrogen bonding interaction is dominant, while for the later compounds (hexylamine to decylamine) the dispersion interactions dominate.
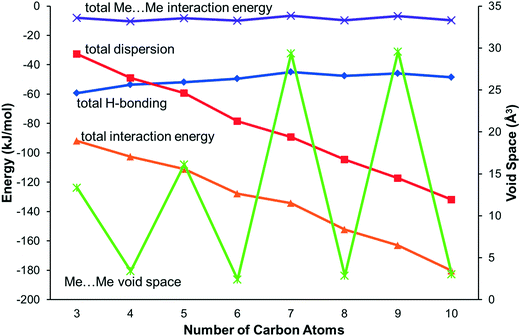 | ||
| Fig. 5 The principal interaction energies for the primary amines along with methyl–methyl void space. Interaction energies refer to the left-hand axis, and Me⋯Me void space to the right-hand axis. | ||
3.3 Hydrogen bonds
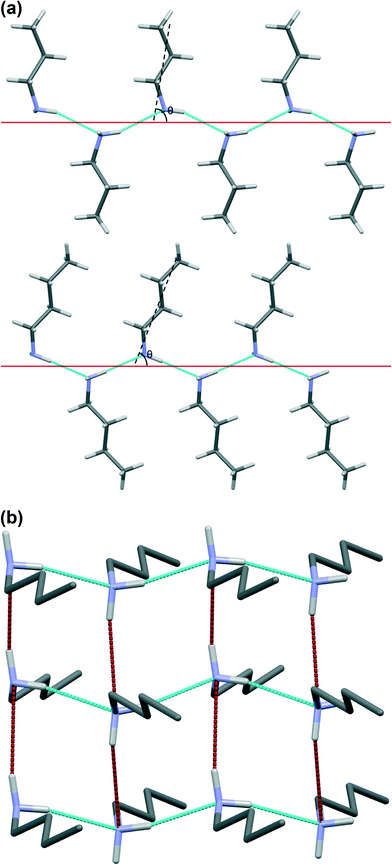
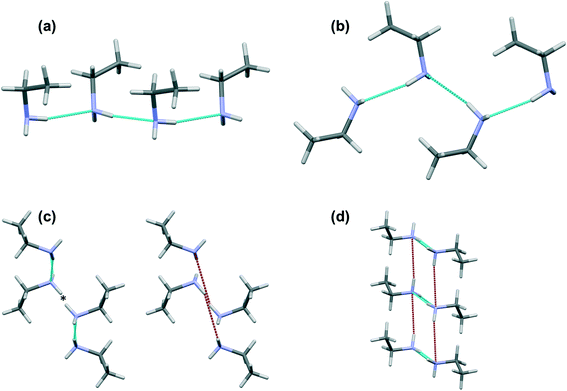
Hydrogen bonding interactions are shown for butylamine in Fig. 6, with the geometric parameters and energies for all members of the series listed in Table 2. In all cases a hydrogen bond is formed by each NH donor. For all of the even monoamines and the later odd compounds (heptylamine and nonylamine), one of these interactions is significantly shorter than the other, with differences in H⋯N distances between 0.53 and 0.67 Å. The PIXEL interaction energies (Table 2) reflect these geometric differences, with the longer interaction having about half to two-thirds of the energy of the shorter one. The H-bond distances and energies are more similar in propylamine and pentylamine (differences in length are 0.10 and 0.32 Å), recalling a distinction which had been evident in the fingerprint plots of Fig. 3.| Compound | N–H⋯N distance (Å) | N⋯N distance (Å) | N–H⋯N angle (°) | Energy (kJ mol−1) |
|---|---|---|---|---|
| Propylamine | 2.42(1) | 3.259(2) | 162(1) | −16.3 |
| 2.52(1) | 3.334(2) | 157(1) | −13.2 | |
| Butylamine | 2.30(1) | 3.173(1) | 169(1) | −17.1 |
| 2.83(1) | 3.608(1) | 150(1) | −9.5 | |
| Pentylamine | 2.34(2) | 3.182(3) | 173(2) | −15.6 |
| 2.66(2) | 3.464(4) | 157(2) | −10.3 | |
| Hexylamine | 2.30(2) | 3.162(4) | 166(2) | −16.4 |
| 2.93(1) | 3.702(2) | 150(2) | −8.2 | |
| Heptylamine | 2.35(3) | 3.164(8) | 158(5) | −13.7 |
| 2.94(3) | 3.730(7) | 154(5) | −8.8 | |
| Octylamine | 2.303(19) | 3.159(4) | 164(2) | −15.7 |
| 2.96(2) | 3.738(3) | 152(2) | −8.1 | |
| Nonylamine | 2.31(2) | 3.153(4) | 164(2) | −15.9 |
| 2.98(2) | 3.764(4) | 150(2) | −7.7 | |
| Decylamine | 2.317(18) | 3.158(4) | 165(2) | −16.7 |
| 2.99(2) | 3.756(3) | 151(2) | −7.5 |
The shorter hydrogen bonding interactions build C(2) chains45 of molecules that run along the ~5.7 Å axis (Fig. 6a and b, blue contacts). The chains interact with each other through the longer H-bonds, which also form C(2) chains along the ~7.0 Å axis (Fig. 6b, red contacts). The combination of the two chains gives rise to layers. In the cases of propylamine and pentylamine, short NH⋯HN contacts (2.53–2.56 Å) are present between hydrogen atoms along the longer C(2) chain, it is these contacts that are responsible for the diffuse region between the hydrogen bond spikes that is observed in the fingerprint plots for these molecules. Similar features are seen in the fingerprint plots of carboxylic acid R22(8) dimers.46
3.4 Interactions between carbon chains and their influence on H-bonding
The formation of long and short hydrogen bonds arises as the result of differences in the orientations of the molecules with respect to the direction of the hydrogen bonded chains. The solid red lines in Fig. 6a show the direction of the chains while the black dashed lines show the long molecular axis. The angles between these two lines (θ) are listed in Table 3.| No. carbon atoms | Average θ | Void volume as % of unit cell |
|---|---|---|
| 3 | 87.3(2) | 7.48 |
| 4 | 69.9(4) | 4.51 |
| 5 | 85.6(2) | 7.16 |
| 6 | 65.1(2) | 3.83 |
| 7 | 65.2(1) | 6.44 |
| 8 | 64.4(2) | 3.45 |
| 9 | 64.4(3) | 5.63 |
| 10 | 63.8(3) | 3.28 |
The values of θ for propylamine and pentylamine are much closer to 90° (hereafter referred to as the ‘perpendicular’ motif) than those for the even numbered and longer chain odd numbered amines, which lie in the range 63–70° (the ‘oblique’ motif). As the molecules tilt (decreasing the value of θ), the hydrogen bonds along the first C(2) chain become shorter and the N–H⋯N angle becomes more linear, while those along the other C(2) chain become longer with a decreased N–H⋯N angle. The H-bond energies in Table 2 follow the same parabolic trend with N–H⋯N angle as shown in Fig. 6 of ref. 47, which means that while the energies of the shorter, more linear H-bonds (Table 2) remain fairly constant at ~16 kJ mol−1 the energy of the longer H-bond diminishes rapidly as it becomes less linear. Overall, the perpendicular motif of propyl- and pentyl-amines results in a stronger hydrogen bonding network than is generated in the other amines by the oblique motif.
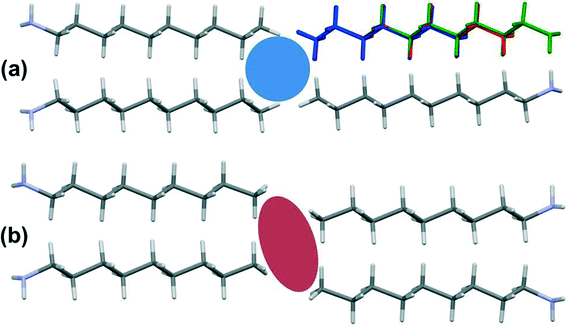
Though the perpendicular chain-packing motif facilitates H-bond formation in propyl and pentyl amine, the finger-print analysis of Fig. 3 shows that chain-packing is less efficient in these structures than in the even and later odd members of the amine series. Calculation of the void spaces (Fig. 7) and volumes (Table 3) demonstrates that more efficient interleaving of CH2 groups in neighbouring chains is promoted by the oblique motif. The interleaving is less effective in propylamine and pentylamine, which have larger voids between the carbon chains (cf.Fig. 7a and b), but stronger hydrogen bonds.
These geometric considerations, along with the energetic analysis depicted in Fig. 5, suggests that in the longer chain (C6 and above) compounds hydrogen bonding (promoted by the perpendicular motif) is “sacrificed” in the interests of stronger dispersion inter-chain interactions (promoted by the oblique motif). Butylamine appears to be a kind of ‘transition’ structure, its relatively short carbon chain packing in the oblique motif; this point is discussed further below.
3.5 Methyl–methyl interactions
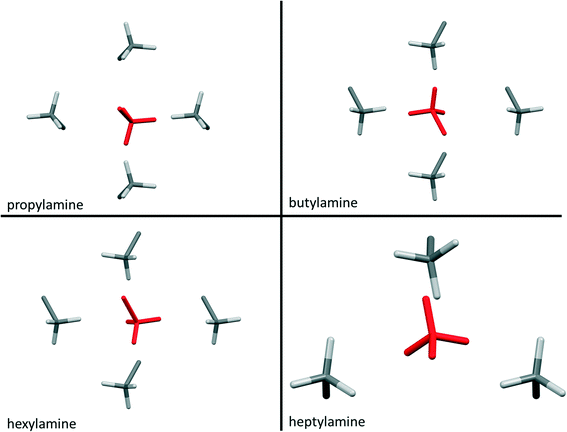
Contacts between terminal methyl groups have a decisive effect on the crystal structures of the alkanes and carboxylic acids.13,17 Even-membered alkanes pack in such a way as to allow equally short methyl–methyl interactions at both ends of the carbon chain. For odd alkanes, the methyl–methyl interaction at one end of the carbon chain is longer than those that are observed for the even molecules, resulting in a lower density and weakening of all three classes of intermolecular interaction. While the even amines have an odd number of atoms in the chain, differences in the packing of the methyl groups between odd and even members of the series similar to those in the alkanes are observed.In the amines the layers of molecules built-up by the hydrogen bonding motifs stack along the long unit cell axes, and the layers interact with each other by methyl–methyl contacts (Fig. 7–9). PIXEL calculations indicate that Me⋯Me interaction energies are in the range 1.7 to 4.1 kJ mol−1, and though these are individually weak, their combined energies range from 6.5 to 10.5 kJ mol−1 (Table 4), i.e. rather similar values to the weaker H-bonds. The energies of the methyl–methyl contacts are consistent across the even members of the series, but the contacts in heptyl- and nonyl-amines are weaker than those in propyl- and pentyl-amines. A “Crystal Packing Feature” search in Mercury§ focussing on methyl–methyl interactions shows that in the series from hexyl- to decyl-amine the even and odd structures fall into two separate classes (Table 5). The structures of propyl- and pentylamine form a third class, with butylamine in a class on its own, consistent with its status as a ‘transition’ structure (see above).
| Compound | Total methyl–methyl interaction energy (kJ mol−1) | Methyl–methyl void space (Å3) |
|---|---|---|
| Propylamine | −8.1 | 13.3 |
| Butylamine | −10.3 | 3.4 |
| Pentylamine | −8.2 | 16.1 |
| Hexylamine | −9.6 | 2.4 |
| Heptylamine | −6.5 | 29.4 |
| Octylamine | −10.0 | 2.9 |
| Nonylamine | −6.8 | 29.6 |
| Decylamine | −9.8 | 3.0 |
| Compound | RMS packing agreement (cf. hexylamine) | RMS packing agreement (cf. heptylamine) |
|---|---|---|
| Hexylamine | N/A | No match |
| Heptylamine | No match | N/A |
| Octylamine | 0.07 | No match |
| Nonylamine | No match | 0.065 |
| Decylamine | 0.097 | No match |
In the odd monoamines, the methyl group is on the opposite side of the long molecular axis as the amine group, whereas in even monoamines they are on the same side. Fig. 8 shows that this leads to a less efficient juxtaposition of opposing methyl groups for the odd amines. There is therefore a pronounced alternation in void volume along the series which correlates with the interaction energies (Fig. 5, Table 4). This result is strongly reminiscent of the packing effects originally described using a topological model by Boese in the alkanes.
Four Me⋯Me interactions are formed in hexyl-, octyl- and decyl-amines, but only three in heptyl- and nonyl-amines, reflecting the identification of different classes for these compounds in the Mercury Packing Feature analysis (Fig. 9). The perpendicular motif of propyl- and pentyl-amines leads to formation of four Me⋯Me contacts, distinguishing them from the longer-chain odd homologues. The result is that heptyl- and nonyl-amine have markedly higher void volumes and lower energies than propyl- and pentyl- amines. As in the longer chain even amines, butylamine forms four Me⋯Me interactions, but the relatively high value of θ changes the relative orientations of the methyl groups. The total Me⋯Me energy for butylamine is the highest in the series at 10.5 kJ mol−1.
Overall, the methyl⋯methyl interactions are more efficient for the even members of the series and short-chain odd amines than for the longer chain odd compounds. This trend in the odd compounds reflects the one seen for the H-bonds: as the chains become longer the end-of-chain interactions adopt less than optimal geometries in order to accommodate the energetically dominant dispersion interactions formed between chains.
3.6 Butylamine as a transition structure
It was noted in Sections 3.4 and 3.5 that the structure of butylamine appeared to be anomalous in adopting an oblique motif, and in Section 3.5 that its methyl groups interact in a motif that is different to the other even amines. It has θ ≈ 70°, higher than the other oblique structures. Additionally, it exhibits the strongest individual hydrogen bonding interaction (−17.3 kJ mol−1) which occurs at an N–H⋯N angle of 169(1)°, a more linear angle than any observed for the other even amines, and a strong total methyl–methyl interaction energy (−10.5 kJ mol−1). Butylamine can therefore be considered as a transition structure between the oblique and perpendicular motifs, where the lower dispersion interactions that result from its relatively short chain are compensated for by optimisation of the interactions that occur at the chain ends.Molecular modelling was used to explore the behaviour of the short-chained primary amines further by optimising model structures consisting of molecules of one amine placed on the sites occupied in a different amine structure. The results are shown in Table 6. In the case of propylamine, regardless of whether the starting structure adopted the oblique or perpendicular motif, the optimisation always yielded the perpendicular structure seen experimentally. This is consistent with the data shown in Fig. 5: propylamine is dominated by hydrogen bonding, and this favours the perpendicular motif. For butyl- and pentylamine, the optimised structure depends on the starting model: perpendicular and oblique motifs are both preserved on optimisation. This also seems to agree with the energies shown in Fig. 5 for these compounds; the dispersion and hydrogen bonding interactions are nearly balanced. An inspection of the energies calculated from the optimisations shows that in each case the different forms only differ by around 2 kJ mol−1, though the lower energy form in each case is that which is observed experimentally.
| Compound | Unit cell/molecular positions used | Input θ (°) | Output θ (°) | Energy (kJ mol−1) |
|---|---|---|---|---|
| a Indicates that a modified version of the hexylamine cell was used to ensure 8 molecules in the unit cell. | ||||
| Propylamine | Propylamine | 87.4 | 81.3 | −31.29 |
| Butylamine | 69.9 | 81.3 | −31.30 | |
| Butylamine | Butylamine | 69.9 | 61.3 | −40.92 |
| Pentylamine | 85.7 | 86.5 | −39.80 | |
| Pentylamine | Pentylamine | 85.7 | 85.2 | −47.03 |
| Hexylaminea | 65.1 | 64.1 | −44.95 | |
3.7 Ethylamine
While all of the other primary amines investigated showed no differences (other than a small amount of thermal contraction) in structure between the temperature of crystal growth and 150 K, ethylamine undergoes a phase transition (Fig. 10).In phase 1 the strongest intermolecular interaction is formed through H-bonding interactions N1H12⋯N1 in which the N⋯H distance is 2.387(11) Å and the angle <NH⋯N is 166.8(11)°. These H-bonds propagate along c to build chains (Fig. 10a). A chain motif occurs along b in phase 2 with the N1H12⋯N1 distance measuring 2.356(11) Å and <NH⋯N = 169.2(11)°, though the orientations of the molecules with respect to the chain direction are different in the two phases (Fig. 10b). While the primary H-bonds in phase 1 are slightly shorter and less linear than in phase 2, energetic analysis indicates that they are stronger; −18.4 kJ mol−1 in phase 1 and −17.0 kJ mol−1 in phase 2. These calculations are based on molecule–molecule energies however, and in phase 1 this interaction is enhanced by a favourable interaction between the carbon chain of one molecule and the NH2 group of the other.
In phase 2 the interactions between chains take the form of N1H11⋯N1 H-bonds with H⋯N = 2.868(10) Å, <NH⋯N = 167.0(9)° and energy −11.4 kJ mol−1. The distance is similar to the longer contact seen in the other even-membered amines, but the angle is more linear and it is therefore somewhat stronger (cf.Table 2).
While N1H11⋯N1 H-bonding interactions are formed in phase 1, they are long (NH⋯N = 3.167(12) Å, <NH⋯N = 154.1(10)°) and less than half the strength (−8.3 kJ mol−1) of the primary H-bond described above. Also formed are side-on dipole–dipole interactions between pairs of N–H bonds opposed across inversion centres, in which the N⋯H distance is 2.971(11) Å, and the interaction energy −12.7 kJ mol−1. A similar contact is formed in phase 2, but it is much longer (3.679(10) Å) and weaker (−5.3 kJ mol−1). The two interactions are compared in Fig. 11 which shows the Hirshfeld surfaces coloured according to electrostatic potential.
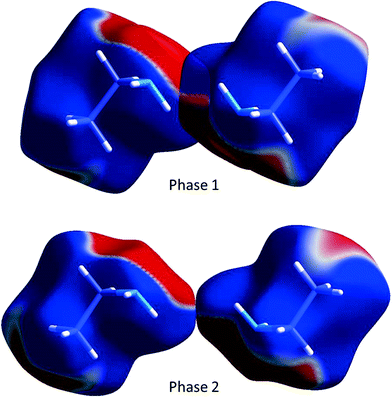 | ||
| Fig. 11 The dipole–dipole interaction in ethylamine shown using the electrostatic potential (ESP) mapped onto Hirshfeld surfaces. Ab initio wavefunctions were obtained at the Hartree–Fock level with a MIDI! basis set.48 The ESP is mapped from −0.005 au (red) to 0.005 au (blue). | ||
While the phase change results in a significant reduction of energy of the dipole–dipole interaction, phase 2 of ethylamine has a higher density (0.935 versus 0.908 g cm−3) and has stronger dispersion interactions than phase 1 (11 interactions with a dispersion term >5 kJ mol−1 for phase 2 compared to 9 for phase 1).
Overall, PIXEL analysis indicates that the lattice energy of phase 2 (−51.0 kJ mol−1) is 1.6 kJ mol−1 more negative than that of phase 1 (−49.4 kJ mol−1), a result in reasonable agreement with the DFT optimisations above (2.9 kJ mol−1). The difference in H-bonding contributes 1.7 kJ mol−1 in favour of phase 2, and rearrangement into a more efficient H-bonding network is an important component of the driving force of the transition, though the energetics of other contacts are also affected.
4. Conclusions
Though H-bonding is frequently identified as a structure-directing interaction, the role of other interactions can often be missed because they lack the characteristic interatomic features of hydrogen bonds, and they are therefore less easy to identify on the basis of geometric features alone. However, if a crystal structure is interpreted in the light of packing-energy calculations it becomes straight-forward to identify all intermolecular interactions and to rank them in the order of their importance. Tools such as Hirshfeld surface analysis and multivariate analysis enable similar structures to be grouped into classes; the transition from one class to another can also be interpreted in the light of the energy calculations. The aim of the present paper is to illustrate this approach to packing analysis by determining the change in the hierarchy of intermolecular interactions which occurs along a homologous series of compounds exhibiting relatively weak H-bonding. The series chosen was the primary amines from ethylamine to decylamine, the structures of which have been determined for the first time.The crystal structures of the primary amines consist of layers in which molecules interact though NH⋯N H-bonding and dispersion interactions between alkyl chains. The layers stack with dispersion interactions between methyl groups in opposing layers. In the early members of the series H-bonding is the strongest intermolecular interaction, and both amine H-atoms act as donors in H-bonds with energies of ~10 kJ mol−1 or higher. As the alkyl chains become longer the dispersion interactions between the chains become more stabilising than the H-bonds. The interactions are balanced for butylamine and pentylamine, but dispersion becomes dominant at hexylamine and beyond. In these later structures, while the energy of one NH⋯N H-bond is similar to those in the short-chain compounds, the energy of the other drops to ~8 kJ mol−1 or lower. At the same time packing of the chains becomes more efficient, with less free space between the chains promoted by a change in orientation of the molecules relative to the direction of chains formed by NH⋯N H–bonds.
The competition between optimisation of the packing at the ends of the alkyl chains versus packing along the lengths of the chains is also seen in the interlayer methyl–methyl interactions of the odd membered amines. Methyl–methyl interactions are consistently weaker for the odd members of the series because of the different positions of the terminal methyl and amine groups relative to the chain axes. The change in the molecular orientation that occurs between pentyl- and heptyl-amine, which improves dispersion contacts between chains, changes the number of methyl–methyl interactions from four to three at the layer interface, resulting in a drop in the total interaction energy of about 25%. By contrast the layer stacking in the even amines is fairly consistent along the series.
The principal classes of intermolecular interaction in the primary amines are thus NH⋯N H-bonding and the interchain and interlayer dispersion interactions. There is an alternation in the energy of all three between odd and even members of the series. As described above, and just as in the alkanes, the interlayer packing of methyl groups is less efficient for the odd-membered amines. The energy calculations show that the effect propagates to the H-bonds and the interchain dispersion contacts, and the combined effect is the alternation of melting points along the series.
In addition to revealing the subtle energy balances which exist in crystal structures, the use of energy calculations also suggests which structures in the series may be susceptible to phase modification. Molecular mechanics simulations support the conclusion based on geometrical and energy analysis that butylamine is something of a transition structure between the regimes dominated by H-bonding and dispersion interactions. It may be therefore possible to modify its packing, for example by applying pressure. Similarly the large interlayer void spaces in heptyl and nonyl amines will be strongly disfavoured at high pressure, so that these too may be modified under extreme conditions. Finally, in the presence of stronger hydrogen bonds the transition between H-bonded and dispersion dominated regimes is likely to occur at longer chain lengths than in the amines, and this is something we are presently investigating in simple alcohols.
Acknowledgements
We thank the Cambridge Crystallographic Data Centre and the EPSRC for provision of studentship funding to AGPM and the EaStCHEM Research Computing Facility for computing access.References
- J. D. Dunitz and A. Gavezzotti, Cryst. Growth Des., 2012, 12, 5873–5877 CAS.
- A. Gavezzotti, CrystEngComm, 2013, 15, 4027–4035 RSC.
- R. D. L. Johnstone, D. Francis, A. R. Lennie, W. G. Marshall, S. A. Moggach, S. Parsons, E. Pidcock and J. E. Warren, CrystEngComm, 2008, 10, 1758–1769 RSC.
- N. P. Funnell, A. Dawson, W. G. Marshall and S. Parsons, CrystEngComm, 2013, 15, 1047–1060 RSC.
- A. Gavezzotti, J. Phys. Chem. B, 2002, 106, 4145–4154 CrossRef CAS.
- A. Gavezzotti, J. Phys. Chem. B, 2003, 107, 2344–2353 CrossRef CAS.
- A. Gavezzotti, Z. Kristallogr., 2005, 220, 499–510 CAS.
- A. Gavezzotti, J. Chem. Theory Comput., 2005, 1, 834–840 CrossRef CAS.
- A. Gavezzotti, Molecular Aggregation - Structure Analysis and Molecular Simulation of Crystals and Liquids, 1st edn, Oxford University Press, New York, 2007 Search PubMed.
- J. D. Dunitz and A. Gavezzotti, Angew. Chem., Int. Ed., 2005, 44, 1766–1787 CrossRef CAS PubMed.
- L. Maschio, B. Civalleri, P. Ugliengo and A. Gavezzotti, J. Phys. Chem. A, 2011, 115, 11179–11186 CrossRef CAS PubMed.
- W. B. Schweizer and J. D. Dunitz, J. Chem. Theory Comput., 2006, 2, 288–291 CrossRef CAS.
- R. Boese, H. C. Weiss and D. Blaser, Angew. Chem., Int. Ed., 1999, 38, 988–992 CrossRef CAS.
- V. R. Thalladi, R. Boese and H. C. Weiss, Angew. Chem., Int. Ed., 2000, 39, 918–922 CrossRef CAS.
- V. R. Thalladi, R. Boese and H. C. Weiss, J. Am. Chem. Soc., 2000, 122, 1186–1190 CrossRef CAS.
- V. R. Thalladi, M. Nusse and R. Boese, J. Am. Chem. Soc., 2000, 122, 9227–9236 CrossRef CAS.
- A. D. Bond, New J. Chem., 2004, 28, 104–114 RSC.
- R. Boese and M. Nussbaumer, In Situ Crystallisation Techniques, Oxford University Press, 1994 Search PubMed.
- D. Chopra and T. N. Guru Row, J. Indian Inst. Sci., 2007, 87, 167–211 CAS.
- RLATT, ( 2000) Bruker AXS, RLATT, Madison WI Search PubMed.
- J. Cosier and A. M. Glazer, J. Appl. Crystallogr., 1986, 19, 105–107 CrossRef CAS.
- SAINT, ( 2006) Bruker-AXS, Madison, WI Search PubMed.
- G. M. Sheldrick, SADABS, ( 2008) University of Göttingen, Göttingen, Germany Search PubMed.
- A. Altomare, G. Cascarano, C. Giacovazzo and A. Guagliardi, J. Appl. Crystallogr., 1993, 26, 343–350 CrossRef.
- P. W. Betteridge, J. R. Carruthers, R. I. Cooper, K. Prout and D. J. Watkin, J. Appl. Crystallogr., 2003, 36, 1487 CrossRef CAS.
- A. Coelho, TOPAS-Academic: General Profile and Structure Analysis Software for Powder Diffraction Data., ( 2013), Brisbane, Australia Search PubMed.
- A. Boultif and D. Louer, J. Appl. Crystallogr., 1991, 24, 987–993 CrossRef CAS.
- W. I. F. David, K. Shankland, J. van de Streek, E. Pidcock, W. D. S. Motherwell and J. C. Cole, J. Appl. Crystallogr., 2006, 39, 910–915 CrossRef CAS.
- B. Delley, J. Chem. Phys., 2000, 113, 7756–7764 CrossRef CAS.
- Materials Studio Release Notes, ( 2008) Accelrys Software Inc., Materials Studio, Cambridge, UK Search PubMed.
- J. P. Perdew, K. Burke and M. Ernzerhof, Phys. Rev. Lett., 1996, 77, 3865–3868 CrossRef CAS PubMed.
- B. Delley, J. Chem. Phys., 1990, 92, 508–517 CrossRef CAS.
- S. Grimme, J. Comput. Chem., 2006, 27, 1787–1799 CrossRef CAS PubMed.
- G. W. T. M. J. Frisch, H. B. Schlegel, G. E. Scuseria, M. A. Robb, J. R. Cheeseman, G. Scalmani, V. Barone, B. Mennucci, G. A. Petersson, H. Nakatsuji, M. Caricato, X. Li, H. P. Hratchian, A. F. Izmaylov, J. Bloino, G. Zheng, J. L. Sonnenberg, M. Hada, M. Ehara, K. Toyota, R. Fukuda, J. Hasegawa, M. Ishida, T. Nakajima, Y. Honda, O. Kitao, H. Nakai, T. Vreven, J. A. Montgomery Jr., J. E. Peralta, F. Ogliaro, M. Bearpark, J. J. Heyd, E. Brothers, K. N. Kudin, V. N. Staroverov, R. Kobayashi, J. Normand, K. Raghavachari, A. Rendell, J. C. Burant, S. S. Iyengar, J. Tomasi, M. Cossi, N. Rega, J. M. Millam, M. Klene, J. E. Knox, J. B. Cross, V. Bakken, C. Adamo, J. Jaramillo, R. Gomperts, R. E. Stratmann, O. Yazyev, A. J. Austin, R. Cammi, C. Pomelli, J. W. Ochterski, R. L. Martin, K. Morokuma, V. G. Zakrzewski, G. A. Voth, P. Salvador, J. J. Dannenberg, S. Dapprich, A. D. Daniels, Ö. Farkas, J. B. Foresman, J. V. Ortiz, J. Cioslowski and D. J. Fox, Gaussian 09, ( 2009) Gaussian Inc., Wallingford, USA Search PubMed.
- M. Headgordon, J. A. Pople and M. J. Frisch, Chem. Phys. Lett., 1988, 153, 503–506 CrossRef CAS.
- F. H. Allen and I. J. Bruno, Acta Crystallogr., Sect. B: Struct. Sci., 2010, 66, 380–386 CrossRef CAS PubMed.
- A. Gavezzotti, OPiX, ( 2003), Milan, Italy Search PubMed.
- H. Sun, J. Phys. Chem. B, 1998, 102, 7338–7364 CrossRef CAS.
- O. V. Dolomanov, L. J. Bourhis, R. J. Gildea, J. A. K. Howard and H. Puschmann, J. Appl. Crystallogr., 2009, 42, 339–341 CrossRef CAS.
- C. F. Macrae, I. J. Bruno, J. A. Chisholm, P. R. Edgington, P. McCabe, E. Pidcock, L. Rodriguez-Monge, R. Taylor, J. van de Streek and P. A. Wood, J. Appl. Crystallogr., 2008, 41, 466–470 CrossRef CAS.
- I. J. Bruno, J. C. Cole, P. R. Edgington, M. Kessler, C. F. Macrae, P. McCabe, J. Pearson and R. Taylor, Acta Crystallogr., Sect. B: Struct. Sci., 2002, 58, 389–397 CrossRef.
- A. L. Spek, Acta Crystallogr., Sect. D: Biol. Crystallogr., 2009, 65, 148–155 CrossRef CAS PubMed.
- D. J. G. S. K. Wolff, J. J. McKinnon, M. J. Turner, D. Jayatilaka and M. A. Spackman, Crystal Explorer, ( 2012) Crystal Explorer, University of Western Australia Search PubMed.
- M. A. Spackman and J. J. McKinnon, CrystEngComm, 2002, 378–392 RSC.
- M. C. Etter, J. C. Macdonald and J. Bernstein, Acta Crystallogr., Sect. B: Struct. Sci., 1990, 46, 256–262 CrossRef.
- J. J. McKinnon, M. A. Spackman and A. S. Mitchell, Acta Crystallogr., Sect. B: Struct. Sci., 2004, 60, 627–668 CrossRef PubMed.
- P. A. Wood, F. H. Allen and E. Pidcock, CrystEngComm, 2009, 11, 1563–1571 RSC.
- R. E. Easton, D. J. Giesen, A. Welch, C. J. Cramer and D. G. Truhlar, Theor. Chim. Acta, 1996, 93, 281–301 CrossRef CAS.
Footnotes |
| † Celebrating 300 years of Chemistry at The University of Edinburgh. |
| ‡ Electronic supplementary information (ESI) available. CCDC 978652–978661. For ESI and crystallographic data in CIF or other electronic format see DOI: 10.1039/c3ce42639d |
| § This is not a common use of this search type, and instructions for performing the search are provided in the ESI,‡ Section S2. |
| This journal is © The Royal Society of Chemistry 2014 |

