 Open Access Article
Creative Commons Attribution 3.0 Unported Licence
Fabrication of self-assembled peptidomimetic microspheres and hydrogen peroxide responsive release of nicotinamide†
Suman Kumar
Maity
,
Santu
Bera
,
Arpita
Paikar
,
Apurba
Pramanik
and
Debasish
Haldar
*
Department of Chemical Sciences, Indian Institute of Science Education and Research Kolkata, Mohanpur, West Bengal 741252, India. E-mail: deba_h76@yahoo.com; deba_h76@iiserkol.ac.in; Fax: +91 3325873020; Tel: +91 3325873119
First published on 9th January 2014
Abstract
The self-assembly of peptidomimetic compounds containing urea and dipicolinic acid was studied to develop a targeted drug delivery vehicle using hydrogen peroxide as a stimulus. Peptidomimetic compound 1 capped with N,N′-dicyclohexylurea mimicked a peptide turn structure, while compound 2 adopted a rigid planar structure through intramolecular N–H⋯O and N–H⋯N hydrogen bonding interactions. The AFM and FE-SEM images revealed that peptidomimetic compound 1 formed microspheres, whereas compound 2 formed a tape-like structure. These microspheres were loaded with the anticancer drug nicotinamide. The microspheres disassembled in the presence of hydrogen peroxide. Hydrogen peroxide ruptured the microspheres composed of peptidomimetic compound 1, thereby enhancing the proportional release of the loaded drug molecules. The reported peptidomimetic microspheres hold future prospects for use as targeted drug delivery vehicles for cancer cells with high levels of H2O2.
Introduction
Stimuli responsive intelligent vehicles1 are of great research interest in targeted drug delivery and self-healing materials.2 Various stimuli such as pH,3 ionic strength,4 light,5 enzymes,6 magnetic fields,7 ultrasound,8 electrostatic interactions,9 and temperature10 are commonly used for targeted drug release. In recent years biologically available substrates have been used as external stimuli for controlled and localized drug delivery, for example, glucose triggered insulin delivery11 and glutathione triggered anticancer drug doxorubicin delivery.12 Hydrogen peroxide is a major reactive oxygen species (ROS) in living organisms, and its equilibrium can have diverse physiological and pathological consequences. The mammalian cells produce hydrogen peroxide (H2O2) to mediate diverse physiological responses such as cell proliferation, differentiation, and migration.13 There is much emerging evidence which supports that hydrogen peroxide acts as a second messenger in cellular signal transduction14 and a killing agent released by the immune cells.15 But the abnormal production of hydrogen peroxide leads to several physiological hazards such as oxidative stress, damage events associated with aging and severe pathologies such as cancer.16 Szatrowski and Nathan have established that the human tumor cells produce large amounts of hydrogen peroxide (250 μM in monocytes).17 Sobotta and co-workers have used physiologically relevant H2O2 concentrations (300 nM to 10 μM) over a physiological time span (up to 24 h) and compared the impacts of continuous low-dose and one-time high-dose treatments.16h The abnormal accumulation of hydrogen peroxide resulted in oxidative stress which leads to inflammation in tissues (tumor cells) and distinguishes from healthy tissue from tumor cells. Hence hydrogen peroxide can act as a potential stimulus for targeted anticancer drug delivery. Recently there have been a few reports on hydrogen peroxide triggered18 delivery of therapeutic substrates via nanoparticles. However, use of the microsphere matrix as a carrier for therapeutic substrates has several advantages over the other delivery systems.19 The therapeutic substrates can be dispersed into the core or adsorbed on the surface of the solid macrospheres.20The chemo- and radio-sensitizing agent nicotinamide enhances the tumor blood flow and reduces tumor hypoxia. Niacinamide inhibits poly(ADP-ribose) polymerases (PARP-1), enzymes involved in the rejoining of DNA strand breaks induced by radiation or chemotherapy. Nicotinamide is also used to prevent immunosuppression caused by UVA and UVB radiation.21 However, nicotinamide may be toxic to the liver at doses exceeding 3 g per day for adults.22 Hence, targeted delivery of the drug is highly recommended.
Recently we have reported the fabrication of mesoporous vesicles from a self-assembled peptide as a drug cargo and a supramolecular double helix capped with Boc and N,N′-dicyclohexylurea as a drug carrier.23 Herein we report the formation of microspheres by self-assembly of peptidomimetic compound 1 containing dipicolinic acid and two N,N′-dicyclohexylurea molecules. X-ray crystallography revealed that compound 1 self-assembled to form a supramolecular single helical architecture, whereas compound 2 containing dipicolinic acid and urea self-assembled to form a sheet-like structure. Peptidomimetic compound 1 formed microspheres with diameters ranging from 0.5 μm to 2 μm from the corresponding methanol–water (19![[thin space (1/6-em)]](https://www.rsc.org/images/entities/char_2009.gif) :
:![[thin space (1/6-em)]](https://www.rsc.org/images/entities/char_2009.gif) 1) solution. Hydrogen peroxide ruptured the microspheres composed of peptidomimetic compound 1. The microspheres were successfully loaded with nicotinamide (also referred to as vitamin B3). Hence, hydrogen peroxide can act as a trigger for the targeted and directly proportional release of the loaded drug from the peptidomimetic microspheres.
1) solution. Hydrogen peroxide ruptured the microspheres composed of peptidomimetic compound 1. The microspheres were successfully loaded with nicotinamide (also referred to as vitamin B3). Hence, hydrogen peroxide can act as a trigger for the targeted and directly proportional release of the loaded drug from the peptidomimetic microspheres.
Results and discussion
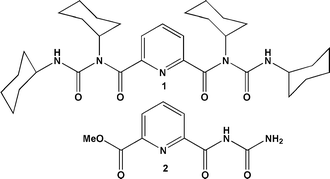
The compounds were designed to mimic the regular turn structure of a tripeptide. Peptidomimetic compounds 1 and 2 containing dipicolinic acid, N,N′-dicyclohexylurea and urea were synthesized by a conventional solution phase methodology, purified, characterized and studied (Fig. 1). The purpose of incorporating N,N′-dicyclohexylurea in the reported compounds is to increase intermolecular hydrogen bonding interactions as observed in other urea derivatives and also to enhance the hydrophobicity and crystallinity.To assess the formation of the self-assembled material, dynamic light scattering (DLS) experiments of peptidomimetic compound 1 were performed. DLS is a rapid scanning method used to identify nanostructures by size distribution. The DLS study shows that peptidomimetic compound 1 forms polydisperse particles with diameters ranging from 0.5 to 2 μm (Fig. 2) in methanol–water solution.
 | ||
| Fig. 2 DLS studies of the peptidomimetic compound 1 self-assembly in methanol–water solution at a concentration of 0.5 mg mL−1. | ||
The morphology of the reported self-assembled peptidomimetic compounds was studied by atomic force microscopy. The solution of the reported compounds in methanol–water (19![[thin space (1/6-em)]](https://www.rsc.org/images/entities/char_2009.gif) :
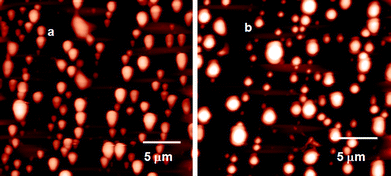
:![[thin space (1/6-em)]](https://www.rsc.org/images/entities/char_2009.gif) 1) (0.5 mg mL−1) was drop-casted on a microscopic glass coverslip, dried under vacuum at 30 °C for 2 days and investigated by AFM. Fig. 3a and b show the polydisperse spherical morphology of compound 1 with diameters ranging from 0.5 μm to 2 μm. The AFM images of compound 2 revealed that the compound adopted a tape-like morphology with a diameter of ca. 200 nm (ESI,† Fig. S1a).
1) (0.5 mg mL−1) was drop-casted on a microscopic glass coverslip, dried under vacuum at 30 °C for 2 days and investigated by AFM. Fig. 3a and b show the polydisperse spherical morphology of compound 1 with diameters ranging from 0.5 μm to 2 μm. The AFM images of compound 2 revealed that the compound adopted a tape-like morphology with a diameter of ca. 200 nm (ESI,† Fig. S1a).
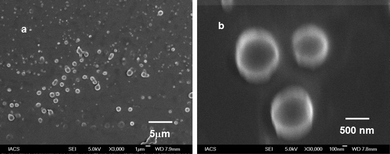
The morphology of peptidomimetic compound 1 was further studied by field emission scanning electron microscopy (FE-SEM). FE-SEM images of peptidomimetic compound 1 (Fig. 4a and b) showed the formation of polydisperse microspheres from methanol–water (19![[thin space (1/6-em)]](https://www.rsc.org/images/entities/char_2009.gif) :
:![[thin space (1/6-em)]](https://www.rsc.org/images/entities/char_2009.gif) 1) solution (0.5 mg mL−1).
1) solution (0.5 mg mL−1).
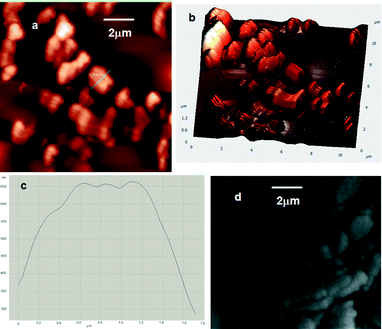
Hydrogen peroxide can alter the tight junction composed of proteins and peptides. To investigate the effect of H2O2 on the peptidomimetic microspheres, the microspheres of compound 1 were incubated with H2O2. The morphological change of the microspheres after incubation with 1 mM H2O2 for 5 minutes was studied by AFM and FE-SEM. From the AFM images it is clear that the spherical morphology of the reported compound 1 was disrupted by H2O2 (Fig. 5a, b). The height profile plot (Fig. 5c) of the microspheres (blue line marked in Fig. 5a) indicates that the surface is very rough. The FE-SEM image also exhibits the disrupted structures (Fig. 5d). There is no chemical change on compound 1 when treated with H2O2. The NMR spectrum of the reported compound after stirring with 50 mmol H2O2 for 48 hours remains almost the same as those of the as-synthesized compounds (ESI,† Fig. S2). Hence, we can conclude that hydrogen peroxide helps to alter the tight junction composed of the peptidomimetic compound in the microspheres.
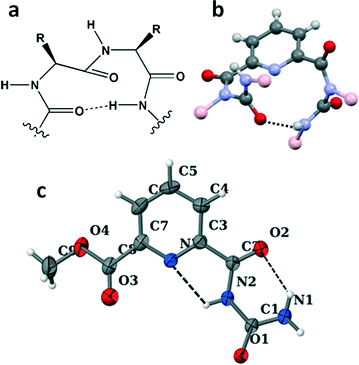
The structures of the reported compounds 1 and 2 were also studied by a single crystal X-ray diffraction experiment. A colourless orthorhombic crystal of compound 1 was obtained from ethyl acetate–hexane solution by slow evaporation.24 The reported compound 1 crystallized with two molecules in the asymmetric unit (ESI,† Fig. S3). From the crystal structure it is evident that peptidomimetic compound 1 adopted a 12-membered unusual turn structure (Fig. 6b). A colourless monoclinic crystal of compound 2 was obtained from ethyl acetate solution by slow evaporation. The solid state conformation of compound 2 revealed that it adopted a rigid planar structure through intramolecular N–H⋯O and N–H⋯N hydrogen bonding interactions. From Fig. 6c, it is evident that there exist a six-membered intramolecular hydrogen bond between dipicolinic acid C![[double bond, length as m-dash]](https://www.rsc.org/images/entities/char_e001.gif) O and urea NH (N1–H1B⋯O2) and a five-membered intramolecular hydrogen bond between dipicolinic acid N and urea NH (N2–H2⋯N3).
O and urea NH (N1–H1B⋯O2) and a five-membered intramolecular hydrogen bond between dipicolinic acid N and urea NH (N2–H2⋯N3).
Moreover, the individual turn-like molecules A and B of compound 1 are themselves regularly inter-linked one atop another through intermolecular hydrogen bonding interactions (N10–H10⋯O2 and N5–H5⋯O5), thereby forming a supramolecular helical structure along the crystallographic a direction (Fig. 7). However, in higher order packing, compound 2 molecules are interlinked via intermolecular hydrogen bonding interactions (N1–H1A⋯O1 and N1–H1B⋯O2) to form a sheet-like structure along the crystallographic c axis (ESI,† Fig. S4). The hydrogen bonding parameters of compounds 1 and 2 are listed in Table 1.
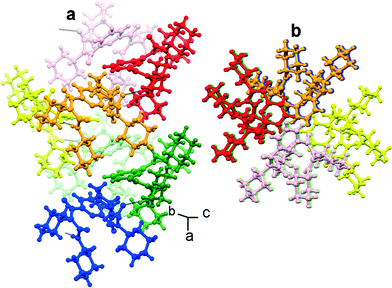 | ||
| Fig. 7 Ball-and-stick model of the (a) side view and (b) top view of a supramolecular helix obtained from compound 1. Intramolecular hydrogen bonds are shown as dotted lines. | ||
| D–H⋯A | H⋯A (Å) | D⋯A (Å) | D–H⋯A (°) | |
|---|---|---|---|---|
| a Symmetry equivalent positions: d = −x, 1/2 + y, 1/2 − z; n = 1/2 − x, 1 − y, −1/2 + z; b = 1 − x, 1 − y, 1 − z; e = 1 − x, 1 − y, 2 − z. | ||||
| Comp. 1 | N7–H7⋯O8 | 2.35 | 2.96 | 129 |
| N5–H5⋯O5d | 2.06 | 2.89 | 166 | |
| N10–H10⋯O2n | 1.96 | 2.82 | 176 | |
| Comp. 2 | N1–H1B⋯O2 | 2.07 | 2.72 | 132 |
| N1–H1B⋯O2b | 2.50 | 2.95 | 114 | |
| N1–H1A⋯O1e | 2.02 | 2.87 | 176 | |
| N2–H2⋯N3 | 2.17 | 2.62 | 112 | |
Previous reports have suggested that the peptidic microspheres have advantages as drug carriers due to their biocompatibility and responsive release.25 We tried to load an anti-inflammatory and anticancer drug, niacinamide, with the reported microspheres. From the crystal structure of nicotinamide26 it is evident that the length of the two longest points of the nicotinamide molecule is 6.791 Å. Hence nicotinamide can be loaded into the pores obtained by self-assembly of the reported peptidomimetic compound 1.
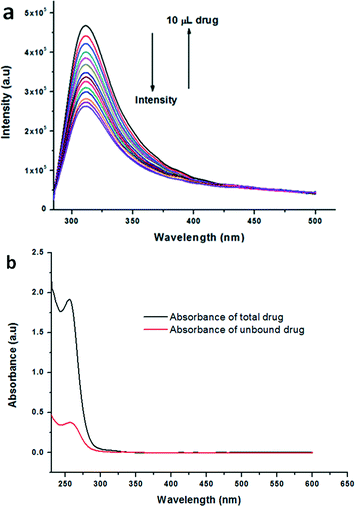
The drug binding efficacy of the microspheres obtained from methanol–water solution of the peptidomimetic compounds was studied by absorption and emission spectroscopy. Compound 2 was not loaded with nicotinamide in methanol–water solution. The fluorescence spectra of compound 1 show that with increasing concentration of nicotinamide, the fluorescence intensity decreases (Fig. 8a). In Fig. 8a, the fluorescence emission is from the reported peptidomimetic compound. In 2.5 mL solution of the reported compound in methanol, 10 μL aliquots of nicotinamide solution in methanol were gradually added and emission spectra were recorded. The decrease in the emission intensity indicates the interaction between compound 1 and the drug. We performed separately the absorption spectroscopic studies with peptidomimetic compound and the control experiment (ESI,† Fig. S5). The concentration of the drug bound with compound 1 was quantified by UV-visible spectroscopy (Fig. 8b) and the results were expressed as loading efficiency ((amount of drug added − amount of free drug)/(amount of drug added in %)). The loading efficiency is 60%. The drug loading content (i.e. (weight of the bound drug/weight of spheres used) × 100) for the spheres obtained from compound 1 is 4%. The experimental procedures described in the experimental section were applied to calculate the loading efficiency and drug loading content.
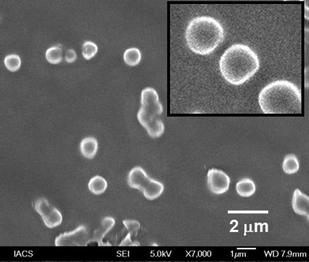
To investigate the morphological changes of the microspheres after drug loading, FE-SEM experiments were performed. Fig. 9 shows the FE-SEM images of compound 1 after drug loading. From the FE-SEM images it is clear that after drug loading there is almost no change in the size and morphology of the microspheres.
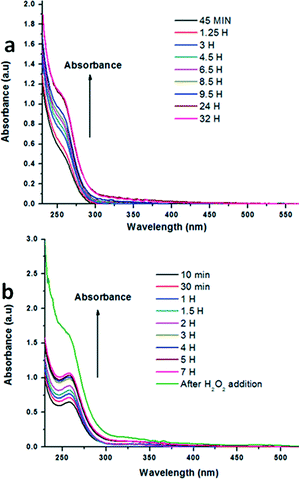
Human cancer cells produce large amounts of hydrogen peroxide.17 Hydrogen peroxide is known to alter the tight junction composed of integral membrane proteins and peripheral membrane proteins,27 thereby enhancing the permeability of the external molecules.28 We used hydrogen peroxide as an external stimulus at different concentrations to disassemble the peptidomimetic microspheres. 5 mg of nicotinamide loaded compound 1 microspheres were suspended in 5 mL water in a 15 mL centrifuge tube. 30% hydrogen peroxide was added to the suspension so that the final concentration of H2O2 in the suspension was 10 mM. The suspension was centrifuged at 5000 rpm for 5 minutes. Aliquots were taken from the suspension and monitored by UV-visible spectroscopy at different time intervals. Fig. 10a shows the UV-visible spectra of H2O2 triggered nicotinamide release kinetics from the nicotinamide loaded compound 1 microspheres. From Fig. 10a it is clear that nicotinamide concentration gradually increases in the aliquot with time and after 24 hours of increasing absorbance saturates, which indicates that no more nicotinamide is released from the microspheres. The control experiment was also done in which H2O2 was not added to the suspension of the nicotinamide loaded compound 1 microspheres. Fig. 10b shows that without H2O2 there is an increase in absorbance, although it saturates after 3 hours. However, with the addition of H2O2 to the same suspension (after 7 h), there is a large increase in absorbance by 0.6 units. We conclude that the nicotinamide that has been adsorbed on the surface of the spheres comes into contact with water and shows absorbance initially. After addition of H2O2, the spheres were ruptured and the loaded drug was released which shows further enhancement in absorbance.
Fluorescence spectroscopy was used to assess the H2O2 concentration dependence of nicotinamide release kinetics from compound 1 microspheres. Separately 10 mM and 1 mM of H2O2 were used as external stimuli. The drug release profile for compound 1 with these two concentrations of H2O2 is shown in Fig. 11 where the intensities at the emission maximum, i.e. 432 nm, are plotted. The excitation wavelength is 270 nm. Fig. 11 reveals that for 10 mM H2O2 there is an increase in the fluorescence intensity for the drug loaded compound 1 microspheres and it has reached a maximum at around 1 hour of incubation. After that the fluorescence intensity gradually decreased and stabilized after 22 hours. Comparing UV-visible and fluorescence spectra it is clear that the fluorescence intensity of nicotinamide decreases with the increase of its concentration in solution.
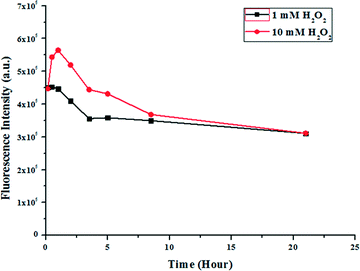 | ||
| Fig. 11 Drug release profile of nicotinamide loaded compound 1 microspheres obtained from fluorescence spectroscopy using 10 mM and 1 mM H2O2. | ||
The initial increase in the fluorescence intensity may be due to the rupturing phenomenon of the microspheres. With 1 mM H2O2 the effect is smaller, i.e. the increase of the intensity and the slope of the curve are smaller (Fig. 11). Hence, the release of the drug nicotinamide is directly proportional to the amount of H2O2.
To investigate the morphological changes of the microspheres during drug release by H2O2, FE-SEM experiments were performed. It may be that the addition of H2O2 changed the pH of the solution and caused the disruption of the microspheres and the release of drug molecules. Fig. 12a shows the FE-SEM images of partially ruptured drug loaded microspheres after 15 minutes of incubation with 5 mM H2O2. Fig. 12b shows the FE-SEM images of ruptured drug loaded microspheres after 22 hours of incubation with 5 mM H2O2. Since the addition of H2O2 could change the pH of the system, a controlled experiment without H2O2 at variable pH was performed. However, the vesicles were not ruptured at pH 6 or even at pH 1 (AFM images, ESI,†Fig. 6). This confirmed that the rupture of vesicles was caused by some H2O2 specific effect, just not by the change of the pH. The very high concentration and longer time treatment with H2O2 may have changed the assembly pattern of the reported compound.
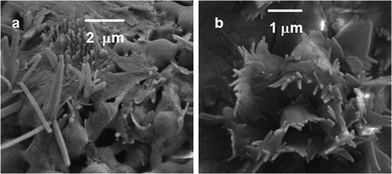 | ||
| Fig. 12 (a) FE-SEM images of partially ruptured drug loaded microspheres. (b) FE-SEM images of ruptured microspheres. | ||
Experimental
General methods and materials
Pyridine dicarboxylic acid was purchased from Sigma Chemicals while dicyclohexylcarbodiimide (DCC) was purchased from SRL.Synthesis of peptidomimetic compounds
The compounds were synthesized by a conventional solution-phase methodology. Coupling was mediated by dicyclohexylcarbodiimide (DCC). The compounds were fully characterized by 500 MHz 1H NMR spectroscopy and 125 MHz 13C NMR spectroscopy, FT-IR and mass spectroscopy. Compounds 1 and 2 were also characterized by X-ray crystallography.Preparation of the microspheres
Compound 1 (0.5 mg mL−1) was dissolved in methanol–water (19![[thin space (1/6-em)]](https://www.rsc.org/images/entities/char_2009.gif) :
:![[thin space (1/6-em)]](https://www.rsc.org/images/entities/char_2009.gif) 1) solution and was allowed to age for 12 h at room temperature.
1) solution and was allowed to age for 12 h at room temperature.
NMR spectroscopy
All NMR studies were carried out on a Brüker AVANCE 500 MHz spectrometer at 298 K. Compound concentrations were in the range 1–10 mmol in CDCl3.UV-Vis spectroscopy
UV-Vis absorption spectra of the reported compounds were recorded on a Perkin Elmer UV/Vis spectrophotometer.Fluorescence spectroscopy
Fluorescence spectra of the reported compound 1 were recorded on a fluorescence spectrometer (Horiba Jobin Yvon).Mass spectrometry
Mass spectra of the compounds were recorded on a Q-Tof Micro YA263 high-resolution (Waters Corporation) mass spectrometer by positive-mode electrospray ionization.FT-IR spectroscopy
FT-IR spectra were obtained using a Perkin Elmer Spectrum RX1 spectrophotometer.Dynamic light scattering
The particle sizes of the microspheres were determined using a DLS instrument (model ZETASIZER Nano Series Nano ZS) with the compound concentration of 0.5 mg mL−1 in methanol–water (19![[thin space (1/6-em)]](https://www.rsc.org/images/entities/char_2009.gif) :
:![[thin space (1/6-em)]](https://www.rsc.org/images/entities/char_2009.gif) 1).
1).
Atomic force microscopy
The morphology of the compounds was investigated by atomic force microscopy (AFM). The solution of the reported compound in methanol–water (19![[thin space (1/6-em)]](https://www.rsc.org/images/entities/char_2009.gif) :
:![[thin space (1/6-em)]](https://www.rsc.org/images/entities/char_2009.gif) 1) (0.5 mg ml−1) was drop-casted on a microscopic glass cover slip and dried under vacuum at 30 °C for 2 days. Images were taken using an NTMDT instrument, model no. AP-0100 in semi-contact mode.
1) (0.5 mg ml−1) was drop-casted on a microscopic glass cover slip and dried under vacuum at 30 °C for 2 days. Images were taken using an NTMDT instrument, model no. AP-0100 in semi-contact mode.
Field emission scanning electron microscopy
The morphology of the reported compounds was investigated using field emission scanning electron microscopy (FE-SEM). The solution of the reported compound in methanol–water (19![[thin space (1/6-em)]](https://www.rsc.org/images/entities/char_2009.gif) :
:![[thin space (1/6-em)]](https://www.rsc.org/images/entities/char_2009.gif) 1) (0.5 mg mL−1) was drop-casted on a microscopic glass cover slip and dried under vacuum at 30 °C for 2 days. The images were taken using an FE-SEM apparatus (Jeol scanning microscope JSM-6700F).
1) (0.5 mg mL−1) was drop-casted on a microscopic glass cover slip and dried under vacuum at 30 °C for 2 days. The images were taken using an FE-SEM apparatus (Jeol scanning microscope JSM-6700F).
X-ray crystallography
Single crystal X-ray analyses of the reported compounds were recorded on Bruker high-resolution X-ray diffractometer instruments.Loading procedure
18.5 mg of compound 1 was dissolved in 15 mL methanol containing 1.35 mg of nicotinamide. The solution was stirred overnight and drop-casted on a Petri dish and dried. Finally, the drug loaded spheres were dried under vacuum and washed with double distilled water (several times) to remove unbound drug molecules.Calculation of loading efficiency
First the absorption spectra of 2.7 mg of nicotinamide in 30 mL methanol were recorded (shown as the black spectrum in Fig. 8b). To the 15 mL drug solution, 18.5 mg of compound 1 was added and drug loaded spheres were prepared as described above. The unbound drug was washed with 50 mL double distilled water and the washed solutions were dried in a rotavapour. The resulting solid mass was dissolved in 15 mL methanol and the absorption spectrum was recorded (the red spectrum in Fig. 8b). From these absorption maxima, recorded before and after drug loading with compound 1, loading efficiencies and drug loading contents were calculated using the equations described above.Conclusions
In conclusion, a better understanding of the self-assembly and disassembly processes was achieved which may enhance the control over targeted drug delivery. The reported peptidomimetic compound 1 adopts a 12-membered unusual turn structure and forms a supramolecular helical structure in higher order assembly. Compound 1 also forms microspheres from methanol–water solution. The microspheres obtained from the peptidomimetic compound can be efficiently loaded with the anticancer drug nicotinamide. Moreover, hydrogen peroxide helps to rupture the microspheres of peptidomimetic compound 1 which leads to the proportional release of the loaded anticancer drug. Though this is a model “in vitro” experiment with higher concentrations of H2O2 than under the physiological conditions, this may foster new research for controlled and targeted drug delivery under physiological conditions exploiting high levels of hydrogen peroxide present in cancer cells.Acknowledgements
We acknowledge the CSIR, New Delhi, India, for financial assistance (project no. SR/FT/CS-01/2507/11-EMR-II). S. K. Maity and A. Pramanik wish to acknowledge the CSIR, India for the research fellowship. S. Bera and A. Paiker thank the UGC, India for the fellowship.Notes and references
- (a) F. Meng, Z. Zheng and J. Feijen, Biomacromolecules, 2009, 10, 198 CrossRef PubMed; (b) M.-H. Li and P. Keller, Soft Matter, 2009, 5, 927 RSC; (c) L. J. D. Cock, S. D. Koker, B. G. D. Geest, J. Grooten, C. Vervaet, J. P. Remon, G. B. Sukhorukov and M. N. Antipina, Angew. Chem., Int. Ed., 2010, 49, 6954 CrossRef PubMed.
- A. P. Esser-Kahn, S. A. Odom, N. R. Sottos, S. R. White and J. S. Moore, Macromolecules, 2011, 44, 5539 CrossRef CAS.
- (a) S. Maity, P. Jana, S. K. Maity and D. Haldar, Soft Matter, 2011, 7, 10174 RSC; (b) M. J. Heffernan and N. Murthy, Bioconjugate Chem., 2005, 16, 1340 CrossRef CAS PubMed; (c) C. Giacomelli, L. L. Men and R. Borsali, Biomacromolecules, 2006, 7, 817 CrossRef CAS PubMed; (d) P. Shi, K. Qu, J. Wang, M. Li, J. Ren and X. Qu, Chem. Commun., 2012, 48, 7640 RSC; (e) H. Hu, H. Wang and Q. Du, Soft Matter, 2012, 8, 2816 RSC; (f) L. Sheihet, K. Piotrowska, R. A. Dubin, J. Kohn and D. Devore, Biomacromolecules, 2007, 8, 998 CrossRef CAS PubMed; (g) J.-Z. Du, X.-J. Du, C.-Q. Mao and J. Wang, J. Am. Chem. Soc., 2011, 133, 17560 CrossRef CAS PubMed.
- (a) J. Naskar, S. Roy, A. Joardar, S. Das and A. Banerjee, Org. Biomol. Chem., 2011, 9, 6610 RSC; (b) P. Koley, A. Gayen, M. G. B. Drew, C. Mukhopadhyay and A. Pramanik, Small, 2012, 8, 984 CrossRef CAS PubMed.
- (a) Q. Jin, F. Mitschang and S. Agarwal, Biomacromolecules, 2011, 12, 3684 CrossRef CAS PubMed; (b) A. P. Goodwin, J. L. Mynar, Y. Ma, G. R. Fleming and J. M. J. Fréchet, J. Am. Chem. Soc., 2005, 127, 9952 CrossRef CAS PubMed; (c) X. Tong, G. Wang, A. Soldera and Y. Zhao, J. Phys. Chem. B, 2005, 109, 20281 CrossRef CAS PubMed; (d) Y. G. Jiang, Y. P. Wang, N. Ma, Z. Q. Wang, M. Smet and X. Zhang, Langmuir, 2007, 23, 4029 CrossRef CAS PubMed; (e) N.-C. Fan, F.-Y. Cheng, J.-A. Ho and C.-S. Yeh, Angew. Chem., Int. Ed., 2012, 51, 8806 CrossRef PubMed.
- (a) J. Hu, G. Zhang and S. Liu, Chem. Soc. Rev., 2012, 41, 5933 RSC; (b) P. D. Thornton, R. J. Mart and R. V. Ulijn, Adv. Mater., 2007, 19, 1252 CrossRef; (c) K. Haba, M. Popkov, M. Shamis, R. A. Lerner, C. F. Barbas and D. Shabat, Angew. Chem., Int. Ed., 2005, 44, 716 CrossRef CAS PubMed; (d) M. Zelzer, S. J. Todd, A. R. Hirst, T. O. McDonalde and R. V. Ulijn, Biomater. Sci., 2013, 1, 11 RSC; (e) B. L. Allen, J. D. Johnson and J. P. Walker, ACS Nano, 2011, 5, 5263 CrossRef CAS PubMed; (f) J. Hu, G. Zhang and S. Liu, Chem. Soc. Rev., 2012, 41, 5933–5949 RSC.
- (a) S. B. Lecommandoux, O. Sandre, F. Checot, J. Rodriguez-Hernandez and R. Perzynski, Adv. Mater., 2005, 17, 712 CrossRef CAS; (b) M. Krack, H. Hohenberg, A. Kornowski, P. Lindner, H. H. Weller and S. S. Forster, J. Am. Chem. Soc., 2008, 130, 7315 CrossRef CAS PubMed; (c) S. Xuan, F. Wang, J. M. Y. Lai, K. W. Y. Sham, Y.-X. J. Wang, S.-F. Lee, J. C. Yu, C. H. K. Cheng and K. C.-F. Leung, ACS Appl. Mater. Interfaces, 2011, 3, 237 CrossRef CAS PubMed; (d) Z. Zhao, D. Huang, Z. Yin, X. Chi, X. Wangb and J. Gao, J. Mater. Chem., 2012, 22, 15717 RSC; (e) A. Baeza, E. Guisasola, E. Ruiz-Hernández and M. Vallet-Regí, Chem. Mater., 2012, 24, 517 CrossRef CAS.
- W. Zhou, F. H. Meng, G. H. M. Engbers and J. Feijen, J. Controlled Release, 2006, 116, e60 CrossRef PubMed.
- A. Koide, A. Kishimura, K. Osada, W. D. Jang, Y. Yamasaki and K. Kataoka, J. Am. Chem. Soc., 2006, 128, 5988 CrossRef CAS PubMed.
- (a) A. Castonguay, E. Wilson, N. Al-Hajaj, L. Petitjean, J. Paoletti, D. Maysinger and A. Kakkar, Chem. Commun., 2011, 47, 12146 RSC; (b) Z. S. Al-Ahmady, W. T. Al-Jamal, J. V. Bossche, T. T. Bui, A. F. Drake, A. J. Mason and K. Kostarelos, ACS Nano, 2012, 6, 9335 CrossRef CAS PubMed.
- W. Zhao, H. Zhang, Q. He, Y. Li, J. Gu, L. Li, H. Lia and J. Shi, Chem. Commun., 2011, 47, 9459 RSC.
- U. Dembereldorj, M. Kim, S. Kim, E.-O. Ganbold, S. Y. Lee and S.-W. Joo, J. Mater. Chem., 2012, 22, 23845 RSC.
- (a) S. G. Rhee, Sci. STKE 2000, pe1 (2000) Search PubMed; (b) M. Sundaresan, Science, 1995, 270, 296 CAS; (c) S. G. Rhee, Science, 2006, 312, 1882 CrossRef PubMed.
- (a) Z. A. Wood, L. B. Poole and P. A. Karplus, Science, 2003, 300, 650 CrossRef CAS PubMed; (b) H. A. Woo, H. Z. Chae, S. C. Hwang, K.-S. Yang, S. W. Kang, K. Kim and S. G. Rhee, Science, 2003, 300, 653 CrossRef CAS PubMed; (c) A. V. Budanov, A. A. Slabina, E. Feinstein, E. V. Koonin and P. M. Chumakov, Science, 2004, 304, 596 CrossRef CAS PubMed.
- (a) E. A. Veal, A. M. Day and B. A. Morgan, Mol. Cell, 2007, 26, 1 CrossRef CAS PubMed; (b) R. A. Miller and B. E. Britigan, Clin. Microbiol. Rev., 1997, 10, 1 CAS.
- (a) T. Finkel, Curr. Opin. Cell Biol., 2003, 15, 247 CrossRef CAS PubMed; (b) H. Ohshima, M. Tatemichi and T. Sawa, Arch. Biochem. Biophys., 2003, 417, 3 CrossRef CAS PubMed; (c) A. M. Shah and K. M. Channon, Heart, 2004, 90, 486 CrossRef CAS PubMed; (d) K. J. Barnham, C. L. Masters and A. I. Bush, Nat. Rev. Drug Discovery, 2004, 3, 20 CrossRef PubMed; (e) B. C. Dickinson and C. J. Chang, J. Am. Chem. Soc., 2008, 130, 9638 CrossRef CAS PubMed; (f) M. T. Lin and M. F. Beal, Nature, 2006, 443, 787 CrossRef CAS PubMed; (g) T. Finkel, M. Serrano and M. A. Blasco, Nature, 2007, 448, 767 CrossRef CAS PubMed; (h) M. C. Sobotta, A. G. Barata, U. Schmidt, S. Mueller, G. Millonig and T. P. Dick, Free Radical Biol. Med., 2013, 60, 325 CrossRef CAS PubMed.
- (a) T. P. Szatrowski and C. F. Nathan, Cancer Res., 1991, 51, 794 CAS; (b) M. L. Lázaro, Cancer Lett., 2007, 252, 1 CrossRef PubMed.
- (a) C. G. Lux, S. Joshi-Barr, T. Nguyen, E. Mahmoud, E. Schopf, N. Fomina and A. Almutairi, J. Am. Chem. Soc., 2012, 134, 15758 CrossRef PubMed; (b) E. A. Mahmoud, J. Sankaranarayanan, J. M. Morachis, G. Kim and A. Almutairi, Bioconjugate Chem., 2011, 22, 1416 CrossRef CAS PubMed; (c) D. S. Wilson, G. Dalmasso, L. Wang, S. V. Sitaraman, D. Merlin and N. Murthy, Nat. Mater., 2010, 9, 923 CrossRef CAS PubMed; (d) V. V. Khutoryanskiy and N. Tirelli, Pure Appl. Chem., 2008, 80, 1703 CrossRef CAS; (e) K. E. Broaders, S. Grandhe and J. M. J. Fréchet, J. Am. Chem. Soc., 2011, 133, 756 CrossRef CAS PubMed.
- E. M. M. Valle, M. A. Galán and R. G. Carbonell, Ind. Eng. Chem. Res., 2009, 48, 2475 CrossRef.
- (a) E. Soussan, S. Cassel, M. Blanzat and I. Rico-Lattes, Angew. Chem., Int. Ed., 2009, 48, 274 CrossRef CAS PubMed; (b) M. Malakoutikhah, M. Teixidó and E. Giralt, Angew. Chem., Int. Ed., 2011, 50, 7998 CrossRef CAS PubMed; (c) R. A. Petros and J. M. DeSimone, Nat. Rev. Drug Discovery, 2010, 9, 615 CrossRef CAS PubMed.
- D. L. Damian, C. R. Patterson, M. Stapelberg, J. Park, R. S. Barnetson and G. M. Halliday, J. Invest. Dermatol., 2008, 128, 447 CAS.
- M. Knip, I. F. Douek, W. P. Moore, H. A. Gillmor, A. E. McLean, P. J. Bingley and E. A. Gale, Diabetologia, 2000, 43, 1337 CrossRef CAS PubMed.
- (a) S. Maity, P. Jana, S. Maity and D. Haldar, Soft Matter, 2011, 7, 10174 RSC; (b) S. K. Maity, S. Maity, P. Jana and D. Haldar, Chem. Commun., 2012, 48, 711 RSC.
- Crystallographic data: compound 1: C33H49N5O4, Mw = 579.77, orthorhombic, space group P212121, a = 11.842(8), b = 16.928(12), c = 31.53(2) Å, V = 6321(7) Å3, Z = 8, dc = 1.219 Mg m−3, T = 100 K, R1 = 0.0878 and wR2 = 0.2453 for 6167 data with I > 2σ(I). Compound 2: C9H9N3O4, Mw = 223.19, monoclinic, space group P21/n, a = 7.1357(5), b = 20.7857(12), c = 7.6013(4) Å, β = 116.330(3)°, V = 1010.46(7) Å3, Z = 4, dc = 1.219 Mg m−3, T = 100 K, R1 = 0.058 and wR2 = 0.182 for 2199 data with I > 2σ(I). Intensity data were collected with MoKα radiation for compounds 1 and 2 at 100 K using a Bruker APEX-2 CCD diffractometer. Data were processed using the Bruker SAINT package and the structure solution and refinement procedures were performed using SHELX97.29 For compounds 1 and 2 non-hydrogen atoms were refined with anisotropic thermal parameters. The data were deposited at the Cambridge Crystallographic Data Centre with CCDC reference numbers 917381 and 951314 for compounds 1 and 2, respectively..
- (a) A. J. V. Hell, M. M. Fretz, D. J. A. Crommelin, W. E. Hennink and E. Mastrobattista, J. Controlled Release, 2010, 141, 347 CrossRef PubMed; (b) A. J. V. Hell, C. I. C. A. Costa, F. M. Flesch, M. Sutter, W. Jiskoot, D. J. A. Crommelin, W. E. Hennink and E. Mastrobattista, Biomacromolecules, 2007, 8, 2753 CrossRef PubMed.
- S. R. Perumalla and C. C. Sun, CrystEngComm, 2012, 14, 3851 RSC.
- K. L. Andus and T. L. Raub, Pharmaceutical Biotechnology, Springer, 1993, vol. 4 Search PubMed.
- (a) K. Hashimoto, T. Oshima, T. Tomita, Y. Kim, T. Matsumoto, T. Joh and H. Miwa, Biochem. Biophys. Res. Commun., 2008, 376, 154 CrossRef CAS PubMed; (b) G. Schreibelt, G. Kooij, A. Reijerkerk, R. van Doorn, S. I. Gringhuis, S. van der Pol, B. B. Weksler, I. A. Romero, P. O. Couraud, J. Piontek, I. E. Blasig, C. D. Dijkstra, E. Ronken and H. E. de Vries, FASEB J., 2007, 21, 3666 CrossRef CAS PubMed.
- G. M. Sheldrick, SHELX 97, University of Göttingen, Germany, 1997 Search PubMed.
Footnote |
| † Electronic supplementary information (ESI) available: Syntheses and characterization of compounds, 1H NMR, 13C NMR, solid state FTIR spectra, Fig. ESI S1–5 and Fig. S1–S11. CCDC 917381 and 951314. For ESI and crystallographic data in CIF or other electronic format see DOI: 10.1039/c3ce41796d |
| This journal is © The Royal Society of Chemistry 2014 |

