 Open Access Article
Creative Commons Attribution 3.0 Unported Licence
Local protonation control using plasmonic activation†
Pushkar
Singh
a and
Volker
Deckert
*ab
aLeibniz Institute of Photonic Technology, Albert-Einstein-Str. 9, 07745 Jena, Germany
bInstitute of Physical Chemistry and Abbe Center of Photonics, Friedrich-Schiller University Jena, Helmholtzweg 4, 07743 Jena, Germany. E-mail: volker.deckert@ipht-jena.de
First published on 5th August 2014
Abstract
Localized protonation of 4-mercaptopyridine (4-MPY), activated by light in the presence of silver nanoparticles is monitored under ambient conditions using surface-enhanced Raman scattering (SERS) and tip-enhanced Raman scattering (TERS). The reaction can be controlled by the excitation wavelength and the atmospheric conditions, thus, providing a tool for site-specific control of protonation.
Coupling of electromagnetic radiation under specific conditions to a metal–dielectric interface results in surface plasmons (SP), which play a key role in many areas like biosensors,1,2 DNA sequencing,3,4 plasmon microscope,5–7 dissociation of H2,8 splitting of water9–11etc. Controlling chemical reactions by light-induced catalytic processes is a long-standing goal in physical chemistry. Recently, surface plasmon induced chemical reactions are gaining much attention. For instance, reduction reaction,12,13 oxidation reaction14,15 and pH dependence16,17 have been reported. In this communication we will focus on the reaction of an immobilized pyridine compound as an example for a plasmon assisted protonation.
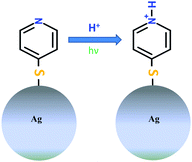
To our knowledge, this is the first experimental report discussing a protonation reaction induced by surface plasmons under ambient conditions (Scheme 1). The experiments were performed under ambient conditions and we hypothesize that the proton generation is based on the dissociation of atmospheric water. Dissociation of atmospheric hydrogen seems unlikely, however, cannot be entirely excluded at present. The hypothesis is confirmed by SERS experiments under inert atmosphere (argon) where no protonation signature was observed.
In the present study 4-mercaptopyridine (4-MPY) was chosen as a model compound for plasmon induced protonation. The adsorption of 4-MPY on metal surfaces can occur via three potential sites (1) the sulphur function, (2) via lone pair electrons of the nitrogen and (3) via aromatic π-electrons of the ring. Previous studies on different metal surfaces (Ag, Au and Pt) strongly suggest the binding of 4-MPY through the S atom by cleavage of the S–H bond.18–21 Furthermore, pH dependent surface enhanced Raman scattering (SERS) studies of 4-MPY show that at pH > 12 the unprotonated (UP) compound is observed. This is indicated by a single Raman peak at 1575 cm−1 (ring stretching mode with unprotonated nitrogen). Decreasing the pH < 1 results in a loss of this peak while, at 1608 cm−1 a new signal appears, that is assigned to ring stretching mode with a protonated nitrogen (PN).18,20,22–24 Protonation on SERS substrates has been studied on various molecular systems22,25–27 using different experimental techniques and all these studies show a pH dependency. Generally, the protonation is reversible and depending on the pH conditions, protonation and deprotonation can be observed.
For the detailed investigation of such surface dependent reactions, a site specific detection at single molecule level would be extremely valuable. Tip-enhanced Raman scattering (TERS) provides a tool to investigate structural information of surfaces with nanometre resolution using a plasmonic hot spot at a scanning probe tip to probe the sample interface. The electromagnetic field enhancement at this hot spot leads to a Raman signal enhancement of several orders of magnitude and even single molecule sensitivity has been demonstrated.28–32 Recently it has been shown that surface plasmon induced chemical reactions can be monitored using TERS under ambient conditions and also under ultrahigh vacuum conditions.12,13 In the present study we use a combined SERS and TERS approach to investigate the protonation of 4-MPY.
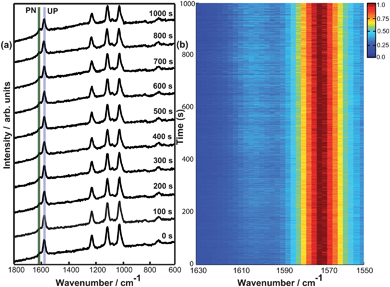
Initially SERS spectra of 4-MPY adsorbed on silver island films using a laser wavelength of 532 nm at 125 μW were measured over several minutes. Fig. 1a shows 10 selected spectra measured at different time-points. Initially Raman band at 1575 cm−1 (indicating the unprotonated compound) with high intensity and a very small protonated band at 1608 cm−1 is visible. Gradually the Raman band at 1608 cm−1 increases indicating the protonation of 4-MPY. Thus a conversion from unprotonated to protonated 4-MPY is monitored. Fig. 1b clarifies this conversion in the form of a colour coded intensity plot. The results suggest that a proton source must be present, as no further reaction of the 4-MPY (e.g. decomposition) could be detected. Different hydrogen containing components in air could be responsible for the observations. As the dissociation of H28 and H2O9–11 under surface plasmon conditions were already shown, this further strengthens our assumption of protonation of 4-MPY using surface plasmon under ambient conditions. Fig. 1c shows the intensity of unprotonated and protonated peak as time progresses. One can see that the intensity of the protonated peak increases initially and reaches to a maximum. We also noticed that the intensity of different peaks shown in Fig. 1a decrease as time progresses. This could be attributed to an oxidation of the silver island film during the measurement. This effect will not be discussed further as it will not affect the main conclusion of this work.
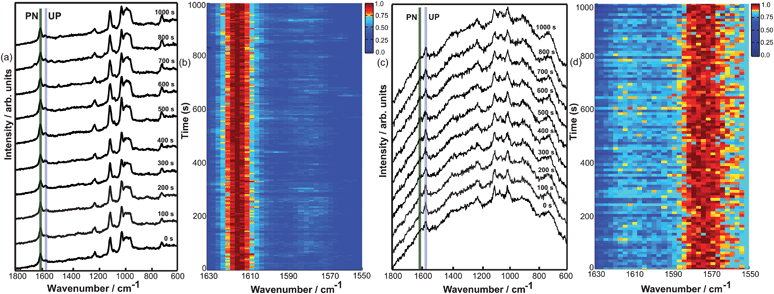
Considering H2O or H2 under ambient as a possible hydrogen sources required for the surface plasmon induced protonation reaction, we performed time dependent measurements under a continuous flow of argon. Fig. 2a shows the time development of 10 spectra at different times-points. The data clearly indicate that no protonation takes place. Fig. 2b shows all time dependent SERS spectra as a colour coded intensity plot.
It has been shown experimentally and theoretically that silver nanoparticles generate higher electromagnetic field enhancement under 532 nm radiation compared to 632 nm as the resonance wavelength of the silver nanoparticles (diameter 100 nm) used in the present study is very close to 532 nm.33–35 Consequently, employing the same incident laser power (50 μW) and 632 nm laser excitation (Fig. 3b) compared to 532 nm (Fig. 3a), no protonation could be detected, thus the intensity of the surface plasmon with 632 nm excitation is not sufficient to start the reaction. Low power (18 μW) of 532 nm laser excitation (see Fig. 3c) shows also no protonation signature. Thus a minimum intensity of surface plasmon is the decisive factor to initiate the protonation which can be controlled using either incident laser power or excitation wavelength.
The results of different excitation wavelengths at 50 μW further imply that the protonation reaction is not induced due to a temperature increase in the laser focus since under same laser power the temperature should be approximately the same. To further investigate the temperature dependence we performed temperature dependent experiments. A low incident power (12 μW @ 532 nm) was used such that no protonation could be observed at room temperature, increasing the temperature of the substrate up to 60 °C (data not shown), did not yield the protonation either.
In comparison to SERS where many nanoparticles are present in the laser focus and contribute to the overall Raman signal, in tip-enhanced Raman scattering (TERS) the signal is generated from a silver coated AFM tip of about 10 nm in radius and thus reducing the enhancing unit to a single nanoparticle. In a TERS experiment the silver coated AFM tip is positioned in the laser focus, thus only one specific plasmonic feature contributes to the signal. In order to warrant similar conditions a monolayer of 4-MPY was immobilized on a flat transparent gold nanoplate36,37 (see ESI† for detail).
Fig. 4a shows 10 selected TERS spectra under ambient conditions and Fig. 4b shows the time-dependent TERS spectra plotted as a colour coded intensity plot. Interestingly under TERS conditions a much faster protonation of 4-MPY was observed compared to SERS. A control TERS measurement was also performed under inert atmosphere. Fig. 4c shows 10 selected spectra of TERS measurement under inert atmosphere at different time-points and Fig. 4d shows the corresponding time dependent TERS spectra plotted as a colour coded intensity plot. The results nicely confirm the role of atmospheric conditions as seen in the SERS experiments. The difference between Au and Ag as the binding site has surprisingly little effect to the band positions of the protonated and unprotonated peaks.
With respect to the “instantaneous” protonation, previous theoretical and experimental studies showed that field confinement between two metal nanoparticles leads to an increased enhancement.38,39 This effect also occurs in a particle-on-metal-surface geometry (“gap-mode”) as in the case of the TERS experiment. Furthermore the tip-sample nanogap allows an efficient electron transfer from tip to sample.40,41 These effects can explain a faster protonation under TERS conditions with very defined and optimized geometry, whereas under SERS conditions many sites with different efficiencies contribute to the overall signal changes. Hence, in the case of the SERS experiments a gradual protonation is observed. To exclude any power related aspects a SERS experiment also using 650 μW (data not shown) was done and a comparable behavior regarding an increase in the reaction rate was observed which also agrees with recent power dependent SERS measurement on 4-MPY.24 We also like to note a difference in the appearance of a broad peak around 980 cm−1 in TERS measurements. This peak is due to silicon tip and its nature changes from tip to tip. Since the TERS experiments with and without argon were performed with different tips, a direct comparison regarding the spectral background is difficult.
In conclusion, we report the experimental observation of protonation reaction under ambient condition using 4-MPY as a model system. While the actual mechanism of the protonation cannot be revealed with the presented experiments, it demonstrates the conditions under which the surface catalytic reaction can be controlled. The control experiment under a continuous flow of argon confirms that atmospheric H2O (H2 cannot be fully excluded yet) acts as a potential proton source required for the reaction. The study further demonstrates that the intensity of the surface plasmon is a key factor to initiate the protonation reaction. The TERS experiments not only confirm the findings of the SERS, but also demonstrate a site specific protonation catalyst that can be located at specific sites and synchronously act as a structurally specific sensor. Interestingly, despite the lower number of plasmonic particles in the case of TERS the protonation happen much faster compared to SERS. This can be attributed to large electromagnetic fields produced in the metal–metal nanogap between tip and substrate and an efficient electron transfer. Consequently, the observed reaction depends more on the specific nanoparticle activity rather than the number of particles. This opens interesting perspective for site specific protonation with nanometre control.
Financial Support from the European Union and the state of Thuringia (FKZ: 2011 FE 9048; 2011 VF 0016) as well as through the Deutsche Forschungsgemeinschaft (FR 1348/19-1) is gratefully acknowledged.
Notes and references
- M. Piliarik, H. Šípová, P. Kvasnička, N. Galler, J. R. Krenn and J. Homola, Opt. Express, 2012, 20, 672–680 CrossRef CAS PubMed.
- J. Zhao, X. Zhang, C. R. Yonzon, A. J. Haes and R. P. Van Duyne, Nanomedicine, 2006, 1, 219–228 CrossRef CAS PubMed.
- K. Nakatani, S. Sando and I. Saito, Nat. Biotechnol., 2001, 19, 51–55 CrossRef CAS PubMed.
- R. Robelek, L. Niu, E. L. Schmid and W. Knoll, Anal. Chem., 2004, 76, 6160–6165 CrossRef CAS PubMed.
- B. Rothenhäusler and W. Knoll, Nature, 1988, 332, 615–617 CrossRef.
- M. G. Somekh, S. Liu, T. S. Velinov and C. W. See, Appl. Opt., 2000, 39, 6279–6287 CrossRef CAS.
- B. Gjonaj, J. Aulbach, P. M. Johnson, A. P. Mosk, L. Kuipers and A. Lagendijk, Phys. Rev. Lett., 2013, 110, 266804 CrossRef CAS.
- S. Mukherjee, F. Libisch, N. Large, O. Neumann, L. V. Brown, J. Cheng, J. B. Lassiter, E. A. Carter, P. Nordlander and N. J. Halas, Nano Lett., 2013, 13, 240–247 CrossRef CAS PubMed.
- D. B. Ingram and S. Linic, J. Am. Chem. Soc., 2011, 133, 5202–5205 CrossRef CAS PubMed.
- J. Lee, S. Mubeen, X. Ji, G. D. Stucky and M. Moskovits, Nano Lett., 2012, 12, 5014–5019 CrossRef CAS PubMed.
- C. G. Silva, R. Juárez, T. Marino, R. Molinari and H. García, J. Am. Chem. Soc., 2011, 133, 595–602 CrossRef PubMed.
- E. M. v. Schrojenstein Lantman, T. Deckert-Gaudig, A. J. G. Mank, V. Deckert and B. M. Weckhuysen, Nat. Nanotechnol., 2012, 7, 583–586 CrossRef PubMed.
- M. Sun, Z. Zhang, H. Zheng and H. Xu, Sci. Rep., 2012, 2, 647 Search PubMed.
- P. Christopher, H. Xin and S. Linic, Nat. Chem., 2011, 3, 467–472 CAS.
- W. H. Hung, M. Aykol, D. Valley, W. Hou and S. B. Cronin, Nano Lett., 2010, 10, 1314–1318 CrossRef CAS PubMed.
- Y. Toh, P. Yu, X. Wen, J. Tang and T. Hsieh, Nanoscale Res. Lett., 2013, 8, 103 CrossRef PubMed.
- M. Sun, Z. Zhang, Z. H. Kim, H. Zheng and H. Xu, Chem. – Eur. J., 2013, 19, 14958–14962 CrossRef CAS PubMed.
- J. Baldwin, N. Schühler, I. S. Butler and M. P. Andrews, Langmuir, 1996, 12, 6389–6398 CrossRef CAS.
- M. A. Bryant, S. L. Joa and J. E. Pemberton, Langmuir, 1992, 8, 753–756 CrossRef CAS.
- H. S. Jung, K. Kim and M. S. Kim, J. Mol. Struct., 1997, 407, 139–147 CrossRef.
- T. Sueoka, J. Inukai and M. Ito, J. Electron Spectrosc. Relat. Phenom., 1993, 64–65, 363–370 CrossRef CAS.
- J. Hu, B. Zhao, W. Xu, B. Li and Y. Fan, Spectrochim. Acta, Part A, 2002, 58, 2827–2834 CrossRef.
- J. A. Baldwin, B. Vlčková, M. P. Andrews and I. S. Butler, Langmuir, 1997, 13, 3744–3751 CrossRef CAS.
- X. S. Zheng, P. Hu, J. H. Zhong, C. Zong, X. Wang, B. J. Liu and B. Ren, J. Phys. Chem. C, 2014, 118, 3750–3757 CAS.
- J. Herranz, F. Jaouen, M. Lefevre, U. I. Kramm, E. Proietti, J. Dodelet, P. Bogdanoff, S. Fiechter, I. Abs-Wurmbach, P. Bertrand, T. M. Arruda and S. Mukerjee, J. Phys. Chem. C, 2011, 115, 16087–16097 CAS.
- H. T. Miles, F. B. Howard and J. Frazier, Science, 1963, 142, 1458–1463 CAS.
- D. B. Spry and M. D. Fayer, J. Phys. Chem. B, 2009, 113, 10210–10221 CrossRef CAS PubMed.
- C. C. Neacsu, J. Dreyer, N. Behr and M. B. Raschke, Phys. Rev. B: Condens. Matter Mater. Phys., 2006, 73, 193406 CrossRef.
- M. D. Sonntag, J. M. Klingsporn, L. K. Garibay, J. M. Roberts, J. A. Dieringer, T. Seideman, K. A. Scheidt, L. Jensen, G. C. Schatz and R. P. Van Duyne, J. Phys. Chem. C, 2012, 116, 478–483 CAS.
- R. Zhang, Y. Zhang, Z. C. Dong, S. Jiang, C. Zhang, L. G. Chen, L. Zhang, Y. Liao, J. Aizpurua, Y. Luo, J. L. Yang and J. G. Hou, Nature, 2013, 498, 82–86 CrossRef CAS PubMed.
- E. Bailo and V. Deckert, Angew. Chem., Int. Ed., 2008, 47, 1658–1661 CrossRef CAS PubMed.
- T. Deckert-Gaudig, R. Böhme, E. Freier, A. Sebesta, T. Merkendorf, J. Popp, K. Gerwert and V. Deckert, J. Biophotonics, 2012, 5, 582–591 CrossRef PubMed.
- B. Dong, Y. Fang, X. Chen, H. Xu and M. Sun, Langmuir, 2011, 27, 10677–10682 CrossRef CAS PubMed.
- L. Kang, P. Xu, B. Zhang, H. Tsai, X. Han and H. L. Wang, Chem. Commun., 2013, 49, 3389–3391 RSC.
- R. Stöckle, V. Deckert, C. Fokas and R. Zenobi, Appl. Spectrosc., 2000, 54, 1577–1583 CrossRef.
- T. Deckert-Gaudig, E. Bailoa and V. Deckert, Phys. Chem. Chem. Phys., 2009, 11, 7360–7362 RSC.
- T. Deckert-Gaudig and V. Deckert, Small, 2009, 5, 432–436 CrossRef CAS PubMed.
- M. Futamata, Y. Maruyama and M. Ishikawa, J. Phys. Chem. B, 2003, 107, 7607–7617 CrossRef CAS.
- T. Yanoa, T. Ichimuraa, A. Taguchi, N. Hayazawaa, P. Vermaa, Y. Inouyea and S. Kawataa, Appl. Phys. Lett., 2007, 91, 121101 CrossRef PubMed.
- K. J. Savage, M. M. Hawkeye, R. Esteban, A. G. Andrei, G. Borisov, J. Aizpurua and J. J. Baumberg, Nature, 2012, 491, 574–577 CrossRef CAS PubMed.
- Z. Zhang, M. Sun, P. Ruan, H. Zheng and H. Xu, Nanoscale, 2013, 5, 4151–4155 RSC.
Footnote |
| † Electronic supplementary information (ESI) available: Experimental details, preparation of SERS substrate, synthesis of gold nanoplates. See DOI: 10.1039/c4cc04642k |
| This journal is © The Royal Society of Chemistry 2014 |


