 Open Access Article
 This Open Access Article is licensed under a Creative Commons Attribution-Non Commercial 3.0 Unported Licence
A Hg(II)-mediated “signal-on” electrochemical glutathione sensor†
Hamid R.
Lotfi Zadeh Zhad
and
Rebecca Y.
Lai
*
Department of Chemistry, Hamilton Hall, University of Nebraska-Lincoln, Lincoln, NE 68588-0304, USA. E-mail: rlai2@unl.edu; Fax: +1 402 472 9402; Tel: +1 402 472 5340
First published on 5th June 2014
Abstract
We report the design and fabrication of a DNA-based electrochemical sensor for detection of glutathione. Sensor signaling relies on glutathione's ability to chelate mercury Hg(II), displacing it from the thymine–Hg(II)–thymine complex formed between the surface-immobilized DNA probes. Our results show that this sensor is sensitive and selective enough to be employed in saliva.
Glutathione (γ-L-glutamyl-L-cysteinglycine, GSH) is the most abundant non-protein low molecular weight thiol source in human tissues, in particular, liver tissues.1 It is also known to act as an aqueous antioxidant in eukaryotic tissues.2 Thus, it plays an important role in maintaining proper biological functions, including protein and DNA synthesis, enzyme activity, metabolism and cell protection, inside an organism.3 As shown in recent studies, changes in intracellular GSH levels are often associated with diseases such as diabetes,4 Parkinson's disease,5 as well as several types of cancer.6
Owing to its biomedical relevance, detection and quantification of GSH in biological samples has been an area of interest in the past decades. A number of optical methods have since been developed for this application. The most commonly used method is Ellman's method, which relies on spectrophotometric detection of 2-nitro-5-thiobenzoic acid, a product of the reaction between 5,5′-dithiobis(2-nitrobenzoic acid) and GSH.7 Various highly sensitive detection strategies that utilize high performance liquid chromatography,8 spectrofluorimetry,9 and electrochemistry10 have also been reported in recent years. Among them, electrochemical detection of GSH via direct oxidation has demonstrated potential for use in clinical analysis, given that it does not require extraction and/or pre-concentration of the target. However, electrochemical oxidation of GSH to glutathione disulfide (GSSG) is not an ideal detection strategy because of the slow innate electron transfer process and the requirement of a relatively high over-potential.11 An electrochemical sensor capable of sensitive, specific and selective detection of GSH in complex biological samples is thus sought after, but has yet to be realized.
DNA-based biosensors have amassed attention and gained popularity in recent years.12 Motivated by this, we have designed and fabricated a DNA-based sensor for detection of GSH.13 Similar to other folding- and dynamics-based electrochemical biosensors, advantages of this sensor include design simplicity and operation convenience.14 Unlike many currently available GSH sensors, the signaling mechanism of this sensor does not require direct oxidation of GSH. Instead, it relies on the ability of GSH to chelate Hg(II), as can be seen in Scheme 1. In the absence of Hg(II), the thiolated and methylene blue (MB)-modified DNA probe is highly flexible; electron transfer between MB and the electrode is efficient, resulting in a high MB signal (Fig. S1, ESI†). The DNA probe contains 15 consecutive thymine (T) bases, which enables formation of Hg(II)–DNA complexes via the well-characterized T–Hg(II)–T binding motif.15 Thus, in the presence of Hg(II), the MB signal decreases substantially. Formation of these T–Hg(II)–T complexes rigidifies the DNA probes, lowering the apparent surface diffusion and electron transfer kinetics between MB and the electrode.16 Complexation between GSH and Hg(II) is highly favorable, thereby outcompeting the interactions between thymine (T) and Hg(II).17 Release of Hg(II) from these complexes results in an increase in probe flexibility, which is reflected by the increase in the MB signal. The signal change should be proportional to the concentration of GSH in the solution.
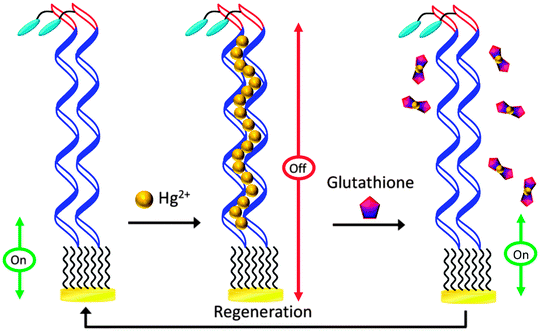 | ||
| Scheme 1 Design and signalling mechanism of the Hg(II)-mediated GSH sensor. | ||
Sensor fabrication and interrogation involved several steps and the details are shown in the ESI.† In brief, the gold disk electrode was first modified with a self-assembled monolayer containing the DNA probe and 6-mercapto-1-hexanol (C6-OH). The DNA-modified sensor was then exposed to a Hg(II)-containing solution. Next, the Hg(II)-bound sensor was placed in a Hg(II)-free phosphate buffer saline (PBS). GSH was added to the solution and the change in the MB signal was monitored with time. Sensor performance was first evaluated using alternating current (AC) voltammetry.14 In the absence of Hg(II), the sensor showed a sharp, well-defined peak ∼−0.31 (vs. Ag/AgCl), verifying successful immobilization of the DNA probe (Fig. 1A). Using the optimized sensor fabrication protocol, the average probe coverage was found to be ∼4.5 × 10¹² molecules cm−2. Addition of 1.5 μM Hg(II) resulted in a large reduction (∼90%) in the MB current, confirming the formation of T–Hg(II)–T complexes on the sensor surface. The extent of the signal suppression (SS) is comparable to that shown in our previous study, which utilized a similar T-containing DNA probe for detection of Hg(II).16 The shift in the MB peak potential to a more positive value is likely attributed to the lowering of the pH at the electrode interface.18 This slight change in the interfacial pH could be, in part, due to the deprotonation reaction that accompanies the formation of T–Hg(II)–T complexes.19 The kinetics of Hg(II) binding was also evaluated, complete signal saturation was achieved in ∼40 min at this Hg(II) concentration. The effect of Hg(II) concentration on both the binding kinetics and %SS was also studied; the use of lower Hg(II) concentrations resulted in sensors with low %SS (∼65%) and slow binding kinetics (i.e., signal saturation in ∼2 hours). It is worth noting that a negligible signal change was observed using a DNA-free MB probe under similar experimental conditions, eliminating the possibility that the observed %SS was due to sensor degradation brought on by Hg(II) deposition (Fig. S2, ESI†).
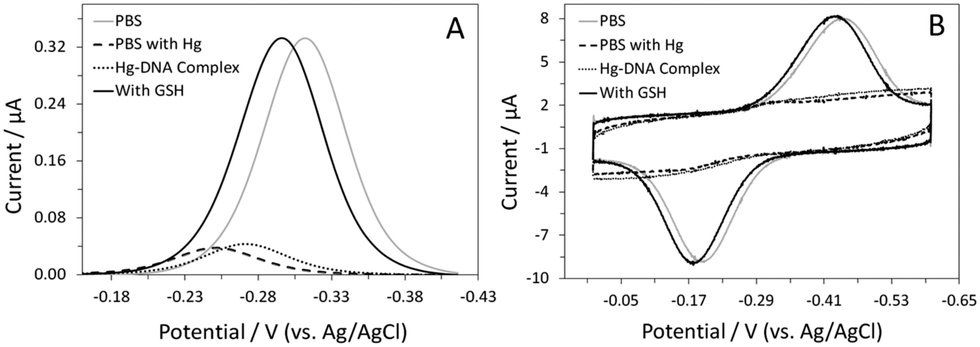 | ||
| Fig. 1 AC voltammograms (A) and CVs (B) of the sensor in PBS before (grey line) and after Hg(II) complexation (dashed line). Also shown are voltammograms of the Hg(II)-bound sensor in a solution without Hg(II) (dotted line) and in the presence of 1 μM GSH (black line). AC voltammograms and CVs were collected at 5 Hz and 5 V s−1, respectively. | ||
One key factor that determines the success of this sensor design is the stability of the T–Hg(II)–T complexes in the absence of Hg(II). These complexes were found to be very stable in the PBS buffer. Despite the slight shift in the MB peak potential to a more negative value, the peak current remained constant.18 The shift in the peak potential is presumably due to the absence of Hg(II) in the solution. However, the exact reason behind this is not clear and is currently under investigation in the lab. Once the sensor had equilibrated (i.e., no change in peak current), 1 μM GSH was added to the solution. The MB peak current increased substantially, reaching a magnitude comparable to that recorded prior to the addition of Hg(II). The signal enhancement (SE) was calculated to be ∼667%. This large signal increase was accompanied by a shift in the peak potential to a more negative value, further confirming the release of Hg(II) and reprotonation of T(s).19 The binding kinetics was fast; signal saturation was achieved in <20 min.
Similar to other sensors of this class, the MB peak current is highly dependent on the applied AC frequency.20,21 For a reversible electrochemical reaction, the peak current increases with increasing frequency until it reaches a threshold frequency, which is often a characteristic of a specific sensor design. At frequencies beyond this threshold frequency, the current decreases; the redox reaction is unable to keep up with the oscillating potential.20,21 While detectable, the change in MB current with frequency was less drastic in the absence of GSH, especially when compared to that observed in the presence of GSH (Fig. S3A, ESI†). The AC frequency-dependent current profile obtained in the presence of GSH is consistent with the profile of the linear probe electrochemical DNA sensor in the unhybridized state.14c,d,21 This further supports our assumption that the removal of Hg(II) from the DNA probes leads to an increase in probe flexibility. Since the %SE is calculated from the currents before and after target binding, it is equally dependent on the applied AC frequency. As shown in Fig. S3B (ESI†), the %SE increased with increasing frequency between 1 and 5 Hz. A decrease in %SE was seen at frequencies beyond 5 Hz. Thus, 5 Hz was the ideal frequency for sensor interrogation and was used for the rest of the study.
Although cyclic voltammetry (CV) is most frequently used in sensor characterization, it is equally useful as a sensor interrogation technique. In the absence of Hg(II), a pair of redox peaks was observed at a potential consistent with the redox behavior of MB (Fig. 1B). Formation of the T–Hg(II)–T complexes led to a substantial reduction in both cathodic and anodic peak currents. Transferring of the sensor to an aliquot of Hg(II)-free PBS did not result in a large change in the peak currents. Similar to that shown in AC voltammetry, the MB peaks increased in size in the presence of GSH. The %SE, however, was much higher in CV (∼1656%), presumably because of the small peak size recorded in the absence of GSH. In CV, one main variable that dictates sensor response is the voltammetric scan rate. In the absence of GSH, the MB current increased gradually with the increasing scan rate. However, in the presence of GSH, the MB current increased drastically with the increasing scan rate until the threshold scan rate (50 V s−1); a decrease in the current was evident at scan rates beyond this value (Fig. S4A, ESI†). Consequently, the %SE was found to be dependent on the scan rate as well. The %SE increased with an increasing scan rate between 0.01 and 5 V s−1, followed by a decrease at higher scan rates (Fig. S4B, ESI†). For this sensor, 5 V s−1 was the optimal scan rate for target interrogation.
To determine the limit of detection for GSH, we recorded the sensor's response to various concentrations of GSH in AC voltammetry (Fig. 2). The limit of detection (LOD) of this sensor was 5 nM at a signal-to-noise ratio of 3. This LOD is adequate for many applications, in particular, detection of GSH in saliva samples. The concentration of GSH in human saliva is in the tens of the micromolar range.22 The dynamic range of the sensor was between 5 nM and 1.25 μM. It is worth mentioning that the sensor response was very reproducible, as indicated by the small error bars. In addition to sensor sensitivity, other crucial sensor properties such as specificity, selectivity and reusability were also systematically evaluated. This sensor showed good specificity for GSH; no signal change was observed in the presence of 10 μM GSSG. Subsequent addition of 1 μM GSH resulted in ∼640%SE, confirming the sensor's activity and specificity towards GSH (Fig. S5, ESI†).
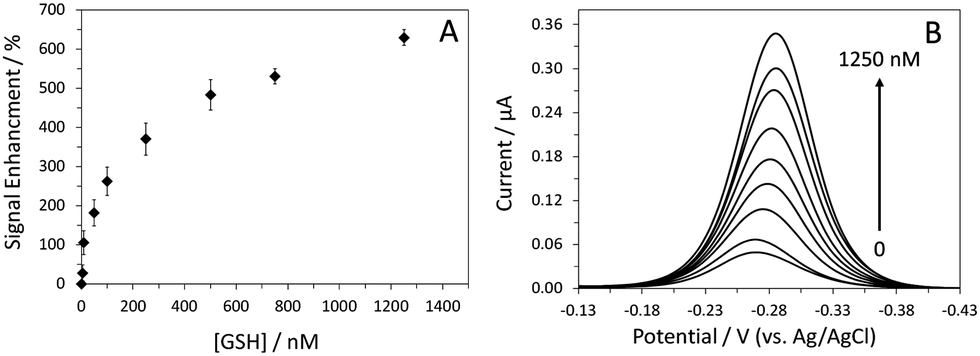 | ||
| Fig. 2 Dose-response curve of the sensor in PBS. The target concentrations were 5, 10, 50, 100, 250, 500, 750, and 1250 nM. The data are averaged from three different sensors (A). Also shown are AC voltammograms of the sensor in the absence and presence of different concentrations of GSH (B). These data were collected at an AC frequency of 5 Hz. | ||
The ability to reuse a sensor multiple times is a valuable and unique attribute of this class of electrochemical biosensors.14,21 In this case, Hg(II) functions as the sensor regeneration reagent. To regenerate the sensor, we first placed the sensor in a Hg(II) solution to saturate all the binding sites on the DNA probes. The Hg(II)-bound sensor was then transferred to a Hg(II)-free solution, ready for the next target interrogation. This sensor regeneration method is simple yet effective; the sensor can be regenerated and reused (Fig. 3A). In addition to sensitivity and specificity, sensor selectivity is equally essential for real-world applications. Quantification of GSH in human saliva has been a focus in biomedical research, given that GSH is a biomarker for various diseases, including head and neck cancer.23 We evaluated the sensor's response to GSH in 50% synthetic human saliva and the results are presented in Fig. 3B. Despite the use of a complex medium, the %SE obtained in the presence of GSH was similar to that shown in PBS (Fig. 1A). Regeneration of the sensor was achieved using the aforementioned protocol; the regenerated MB current was comparable to that obtained prior to the addition of GSH. With proper optimization, this sensor can potentially be used for real-time detection of GSH in saliva samples in a clinical setting.
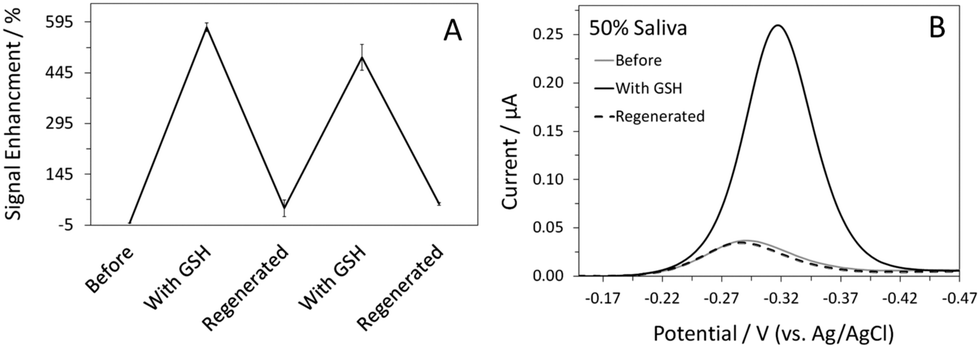 | ||
| Fig. 3 Sensor reusability plot for the Hg(II)-mediated GSH sensor. The data were averaged from three different sensors (A). Also shown are AC voltammograms of the sensor recorded in 50% saliva before and after addition of 1 μM GSH and after sensor regeneration (B). | ||
We have successfully designed and fabricated a Hg(II)-mediated electrochemical sensor for detection of GSH. This “signal-on” sensor design is based on the ability of GSH to chelate Hg(II) ions that are bound to the surface-immobilized DNA probes. The resultant sensor is sensitive, specific, and selective enough to be used directly in a complex biological matrix such as saliva.
The authors acknowledge the National Science Foundation (CHE-0955439) and Nebraska EPSCoR (EPS-1004094) for financial support. The authors would like to thank Yao Wu for the helpful discussions.
Notes and references
- A. Meister, J. Biol. Chem., 1988, 263, 17205 CAS.
- L. E. Rikans and D. R. Moore, Biochim. Biophys. Acta, 1988, 966, 269 CrossRef CAS.
- A. Meister and M. E. Anderson, Annu. Rev. Biochem., 1983, 53, 711 CrossRef PubMed.
- S. Whillier, J. E. Raftos and P. W. Kuchel, Redox Rep., 2008, 13, 6 Search PubMed.
- A. E. Lang, Neurology, 2007, 68, 948 CrossRef PubMed.
- D. Y.-K. Wong, Y.-L. Hsiao, C.-K. Poon, P.-C. Kwan, S.-Y. Chao, S.-T. Chou and C.-S. Yang, Cancer Lett., 1994, 81, 111 CrossRef CAS.
- G. L. Ellman, Arch. Biochem. Biophys., 1959, 82, 70 CrossRef CAS.
- J. T. Michaelsen, S. Dehnert, D. Giustarini, B. Beckmann and D. Tsikas, J. Chromatogr. B, 2009, 877, 3405 CrossRef CAS PubMed.
- J. Liu, Y. Q. Sun, Y. Huo, H. Zhang, L. Wang, P. Zhang, D. Song, Y. Shi and W. Guo, J. Am. Chem. Soc., 2014, 136, 574 CrossRef CAS PubMed.
- (a) M. Mazloum-Ardakani, M. A. Sheikh-Mohseni and B. F. Mirjalili, Electroanalysis, 2013, 25, 2021 CrossRef CAS; (b) P. T. Lee and R. G. Compton, Electroanalysis, 2013, 25, 1613 CrossRef CAS.
- (a) N. F. Atta, A. Galal and S. M. Azab, Anal. Bioanal. Chem., 2012, 404, 1661 CrossRef CAS PubMed; (b) J. C. Harfield, C. Batchelor-McAuley and R. G. Compton, Analyst, 2012, 137, 2285 RSC.
- (a) H. Z. He, D. S. H. Chan, C. H. Leung and D. L. Ma, Chem. Commun., 2012, 48, 9462 RSC; (b) D. L. Ma, H. Z. He, K. H. Leung, H. J. Zhong, D. S.-H. Chan and C. H. Leung, Chem. Soc. Rev., 2013, 42, 3427 RSC; (c) D. L. Ma, T. Xu, D. S.-H. Chan, B. Y. W. Man, W.-F. Fong and C. H. Leung, Nucleic Acids Res., 2011, 39, e67 CrossRef CAS PubMed.
- (a) H. Xu and M. Hepel, Anal. Chem., 2011, 83, 813 CrossRef CAS PubMed; (b) J. Li, S. Yang, W. Zhou, C. Liu, Y. Jia, J. Zheng, Y. Li, J. Li and R. Yang, Chem. Commun., 2013, 49, 7932 RSC.
- (a) Y. Wu and R. Y. Lai, Chem. Commun., 2013, 49, 3422 RSC; (b) Z. Yu and R. Y. Lai, Anal. Chem., 2013, 85, 3340 CrossRef CAS PubMed; (c) W. Yang and R. Y. Lai, Langmuir, 2011, 27, 14669 CrossRef CAS PubMed; (d) R. Y. Lai, B. Walker, K. Stormberg, K. A. J. Zaitouna and W. Yang, Methods, 2013, 64, 267 CrossRef CAS PubMed; (e) W. Yang, J. Y. Gerasimov and R. Y. Lai, Chem. Commun., 2009, 2902 RSC.
- A. A. Voityuk, J. Phys. Chem. B, 2006, 110, 21010 CrossRef CAS PubMed.
- G. V. Guerreiro, A. J. Zaitouna and R. Y. Lai, Anal. Chim. Acta, 2014, 810, 79 CrossRef CAS PubMed.
- (a) P. D. Oram, X. Fang, Q. Fernando, P. Letkeman and D. Letkeman, Chem. Res. Toxicol., 1996, 9, 709 CrossRef CAS PubMed; (b) J. Zhao, C. Chen, L. Zhang, J. Jiang, G. Shen and R. Yu, Analyst, 2013, 138, 1713 RSC.
- M. Pyo and S.-H. Jeong, Bull. Korean Chem. Soc., 1998, 19, 122 CAS.
- H. Torigoe, A. Ono and T. Kozasa, Chem. – Eur. J., 2010, 16, 13218 CrossRef CAS PubMed.
- S. E. Creager and T. T. Wooster, Anal. Chem., 1998, 70, 4257 CrossRef CAS.
- F. Ricci, R. Y. Lai and K. W. Plaxco, Chem. Commun., 2007, 3768 RSC.
- E. Bald and R. Głowacki, Amino Acids, 2005, 28, 431 CrossRef CAS PubMed.
- G. Almador, F. Bussu, J. Galli, A. Limongelli, S. Persichilli, B. Zappacosta, A. Minucci, G. Paludetti and B. Giardina, Head Neck, 2007, 29, 648 CrossRef PubMed.
Footnote |
| † Electronic supplementary information (ESI) available: Reagents and experimental procedures. Structure and sequence information of DNA probe. DNA-free MB probe results. AC frequency-dependent current and %SE plots. CV scan rate-dependent current and %SE plots. GSH/GSSG specificity data. See DOI: 10.1039/c4cc03329a |
| This journal is © The Royal Society of Chemistry 2014 |