 Open Access Article
Creative Commons Attribution 3.0 Unported Licence
A carbon-coated TiO2(B) nanosheet composite for lithium ion batteries†
Zhenyu
Sun
*ab,
Xing
Huang
c,
Martin
Muhler
b,
Wolfgang
Schuhmann
a and
Edgar
Ventosa
*a
aAnalytische Chemie-Elektroanalytik & Sensorik, Ruhr-University Bochum, 44780 Bochum, Germany. E-mail: edgar.ventosa@rub.de
bLaboratory of Industrial Chemistry, Ruhr-University Bochum, 44780 Bochum, Germany. E-mail: zhenyus@iccas.ac.cn
cFritz Haber Institute of the Max Planck Society, Faradayweg 4-6, 14195, Berlin, Germany
First published on 3rd April 2014
Abstract
The carbon-coated TiO2(B) nanosheet composite synthesized by one-step hydrolysis of TiCl3 followed by vacuum annealing and air annealing delivers outstanding electrochemical performance as a negative electrode for Li-ion batteries, i.e. reversible capacity above 150 mA h g−1 at 30 C (10 A g−1).
Rechargeable lithium ion batteries (LIBs) are of great interest for practical applications in portable electronics and electric vehicles owing to their high efficiency and energy density.1,2 Further improvements in energy density are highly desired bearing in mind other important issues such as safety, cost and durability. The excellent intrinsic safety, durability and rate capability of titanium dioxide (TiO2), together with its low cost, chemical stability and environmental friendliness make it an intriguing candidate as an electrode for LIBs. Compared to the well-established anode material Li4Ti5O12, TiO2 offers a higher theoretical specific capacity of 336 mA h g−1versus 175 mA h g−1 of the former material. Among the polymorphs of TiO2, the β-phase, TiO2(B), has a unique monoclinic C2/m structure with an open channel parallel to the b-axis, which favours faster charge–discharge capability.3–11 On the other hand, nanostructuring of the active material was shown to be beneficial,12 especially at high current densities at which the large area of the electrode–electrolyte interface shortens the Li-ion diffusion length in the solid state.13 At high current densities (fast charge–discharge), the electrical conductivity of TiO2 may become the limiting parameter. Conductive coatings such as graphitic carbon can be deposited onto the TiO2 nanostructures in order to facilitate electron transport. Carbon coating is achieved either by adding a carbon precursor during the synthesis or by post-treatment of the active material. The former approach is more attractive because it avoids multi-step procedures and it leads to a more homogeneous distribution of carbon.
A TiO2(B) nanosheet composite obtained via the self-assembly of TiCl3 and ethylene glycol (EG) and subsequent solvothermal condensation14 appears to be a promising negative electrode material for Li-ion batteries. However, the resulting material did not show great electrochemical performance.15 Large amounts of organic residues and easy aggregation of the nanosheets upon annealing are undoubtedly the drawbacks of this synthesis when applied in Li-ion batteries. Herein, we demonstrate a facile fabrication of a carbon-coated TiO2(B) nanosheet composite via annealing under vacuum followed by air. Tuning the annealing conditions enables us to transform the undesired organic residues into a beneficial carbon coating thereby leading to its excellent electrochemical performance as high-rate negative electrode material for Li-ion batteries.
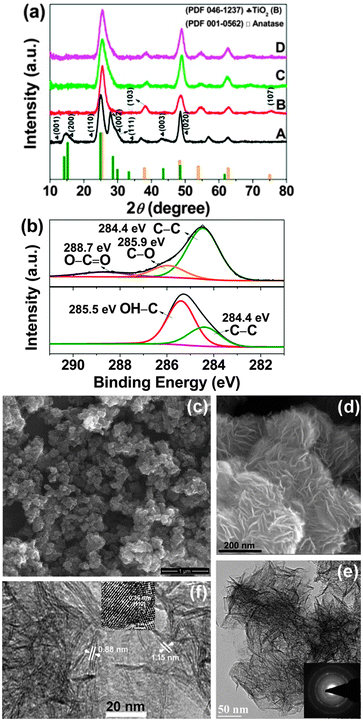
We prepared six samples by tailoring the annealing conditions. As-prepared TiO2(B) materials, annealed in air at 300 °C for 1 h, annealed in air at 300 °C for 2 h, annealed under vacuum at 300 °C for 1 h, annealed under vacuum at 300 °C for 6 h and annealed under vacuum at 300 °C for 6 h plus in air at 300 °C for 1 h are referred to as pristine_TiO2, TiO2_1hAir, TiO2_2hAir, TiO2_1hVac, TiO2_6hVac and TiO2_6hVac_1hAir, respectively. The phase composition and crystalline structure of the samples were characterized by X-ray diffraction (XRD) (Fig. 1a). Note that it is very difficult to differentiate TiO2(B) and anatase solely based on the XRD patterns due to the overlapping of the major diffraction peaks of the two phases (see reference patterns shown at the bottom of Fig. 1a). The sharp diffraction peaks at ∼24.9 and ∼48.6° in trace A can be assigned to the (110) and (020) reflections of the monoclinic TiO2(B) (JCPDS file 046-1237), respectively. The broad peak appearing at around 15° mostly results from the superimposition of the (001) and (200) reflections. In addition, a strong peak at around 28.2° with a shoulder at 29.6° corresponds to the (002) and (111) reflections. A weak peak at 43.2° originating from the (003) reflection was also observed. The new peaks present at 36.9° and 56.8° differ from the literature results for well-studied polymorphs of TiO2, which may arise from incompletely condensed titania intermediates.6,14 Upon annealing, the prominent peak at 28.2° weakened, and the (110) peak became broader and was slightly shifted to higher angles. A small peak at approximately 38.0° in traces B, C and D appeared, which can be indexed to the (103) reflection of anatase (JCPDS file 001-0562). These observations indicate the occurrence of phase transformation during annealing in agreement with previous studies.5,6 We cannot conclude whether TiO2(B) or anatase is the predominant phase by means of XRD. The electrochemical characterization shown below (vide infra) indicates that TiO2(B) still predominates after annealing and the amount of anatase phase is significant only for TiO2_2hAir.
X-ray photoelectron spectroscopy (XPS) was employed to provide insight into the surface composition of the resulting TiO2(B). There are three elements detected in all samples, i.e., Ti, O and C (Fig. S1, ESI†). For pristine TiO2(B), the C 1s region is dominated by a peak at around 285.5 eV (bottom panel in Fig. 1b) originating from the C–OH groups of adsorbed EG. However, upon annealing, the main C 1s peak appeared at lower binding energies centred at about 284.4 eV (top panel in Fig. 1b), which can be assigned to C–C bonds. This observation clearly indicates the removal of most EG molecules. Two small peaks at higher binding energies correspond to residual C–OH (∼285.9 eV) and O–C![[double bond, length as m-dash]](https://www.rsc.org/images/entities/char_e001.gif) O (∼288.7 eV) species.
O (∼288.7 eV) species.
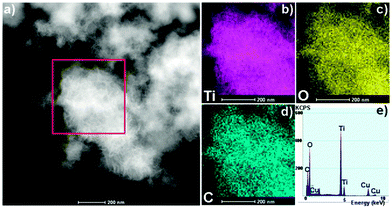
Scanning electron microscopy (SEM) shows a petal-like sheet morphology for the TiO2(B) prior to and after annealing treatments, akin to what has been observed previously (Fig. 1c and d).14 In some cases, the sheet edges tend to scroll and fold slightly similar to graphene and other two-dimensional atomic crystals (Fig. 1e). The electron diffraction (ED) pattern illustrates the crystallinity of the nanosheets (inset in Fig. 1e). The nanosheets preserved the lamellar structure with a spacing up to 1.15 nm even after heat treatment (Fig. 1f). High-resolution TEM (HRTEM) analysis reveals the lattice fringe with a d-spacing of approximately 0.36 nm, corresponding to the (110) plane of TiO2(B) (inset in Fig. 1f)9 suggesting that the TiO2(B) nanosheets may grow along the ab plane. High-angle annular dark-field scanning TEM (HAADF-STEM) imaging (Fig. 2a) and EDX results (Fig. 2b–e) unambiguously illustrate the homogeneous presence of carbon in addition to Ti and O indicating the formation of carbon layers after annealing. All of the annealed TiO2(B) samples show a typical type H3 of the IV isotherm due to the formation of a pore structure (Fig. S2, ESI†). The pore size in all cases is ∼3.8 nm. Though a decrease in the total Brunauer–Emmett–Teller (BET) surface area of TiO2(B) occurred from 384 m2 g−1 (before annealing) to 277 (300 °C for 1 h in air), 233 (300 °C under vacuum for 6 h) and 279 m2 g−1 (300 °C under vacuum for 6 h plus 1 h in air) due to nanosheet aggregation upon heating, the BET specific surface areas are still quite high. The increase in the BET surface area of the TiO2_6hVac_1hAir sample, as compared to the TiO2_6hVac, likely results from the removal of surface residues upon further annealing in air without prominent aggregation of TiO2.
 | ||
| Fig. 2 (a) STEM image of the TiO2_6hVac_1hAir. (b)–(d) EDX mapping images of Ti, O and C, and (e) EDX pattern taken from the region in (a). | ||
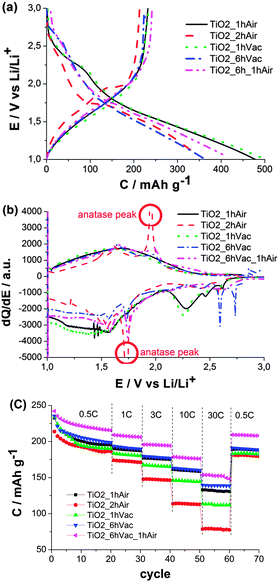
The performance of the resulting TiO2(B) was evaluated as a negative electrode material for Li-ion batteries in a three-electrode Swagelok cell. The as-synthesized TiO2(B) prior to annealing contains large amounts of EG adsorbed on the surface, as indicated by XPS (bottom panel in Fig. 1b) and elemental analysis (10 wt% carbon and 3 wt% hydrogen). EG is electrochemically unstable and it is reduced below 2.5 V vs. Li/Li+ giving rise to a large irreversible capacity. Additionally, the products of such a reduction seem to hinder the (de)-intercalation as low reversible capacities are obtained. Consequently, air-annealing is a common step in most of the previous studies,6–9 which is supposed to remove the residual EG. Instead of removing EG by air-annealing, our goal was to transform part of the EG into a carbon coating by annealing under vacuum. The formation of the graphitic carbon coating under vacuum is proposed to proceed by dehydration and/or dehydrogenation of ethylene glycol via C2 intermediates. Fig. 3a shows the potential profiles of all five samples. In the first reduction, two regions can be distinguished; the region dominated by irreversible losses (reduction of residues) above 2.0 V and the region dominated by reversible (de)-intercalation below 2.0 V. A large amount of charge is irreversibly consumed at 2.5 V–2.2 V for TiO2_1hAir and TiO2_1hVac, indicating the presence of residual species derived from EG. Considerably less charge was consumed for TiO2_2hAir pointing toward a more efficient removal of residues. The potential of the irreversible process was shifted to 2.7–2.6 V for TiO2_6hVac and TiO2_6hVac_1hAir suggesting slightly different electrochemical reactions and, thus, the presence of different residues. The region below 2.0 V reveals the phase transformation from beta to anatase for TiO2_2hAir by the appearance of the characteristic peak of the anatase phase at 1.74 V.16 For easier visualization of the anatase peaks, the differential capacity plots of Fig. 3a are shown in Fig. 3b. The cathodic and anodic peaks at ca. 1.75 V and 1.95 V, respectively, observed for TiO2_2hAir confirm the presence of the anatase phase.16
The reversible capacities of the five samples (anodic specific charge) at different C-rates are shown in Fig. 3c. The lowest performance delivered by TiO2_2hAir is likely due to the beta to anatase transformation together with particle aggregation. Thus, it is clear that prolonged annealing time in air is detrimental to the electrochemical properties. The performance of TiO2_6hVac was only slightly higher than that of TiO2_1hAir. Annealing in air might be stronger for removal of surface residues, thus TiO2_6hVac was subjected to subsequent annealing in air for 1 h in an attempt to eliminate the surface residues, which remain even after vacuum treatment. Indeed, the performance of TiO2_6hVac_1hAir exceeded that of TiO2_6hVac and that of TiO2_1hAir, delivering a charge capacity above 150 mA h g−1 at 30 C (10 A g−1) which is comparable to the best performance achieved to date.5–7 It should be noted that a similar carbon content, determined by elemental analysis, of 4 wt% and 5 wt% was obtained for TiO2_1hAir, and TiO2_6hVac_1hAir, respectively. In terms of retention of the reversible capacity, TiO2_6hVac_1hAir also delivered the best values (Fig. S3, ESI†) at 30 C, i.e., 63%, 59% and 57% of the initial capacity for TiO2_6hVac_1hAir, TiO2_6hVac and TiO2_1hAir, respectively. As for the efficiency (Fig. S4, ESI†), TiO2_2hAir, TiO2_6hVac and TiO2_6hVac_1hAir showed higher values (>99% in the 20th cycle) than those of samples annealed for 1 h (96.5% and 95% for TiO2_1hAir and TiO2_1hVac, respectively). When the C-rate was set back to 0.5 C for TiO2_6hVac_1hAir, the capacity returned to values above 200 mA h g−1, retaining 86% of the initial value after 70 cycles.
In conclusion, we have shown that a carbon-coated TiO2(B) nanosheet composite can be synthesized through one-step hydrolysis of TiCl3 followed by annealing for 6 h under vacuum and 1 h in air. The resulting material delivers excellent performance (reversible capacity above 150 mA h g−1 at 10 A g−1) as a negative electrode material for Li-ion batteries due to the combination of three features of this material, i.e., the beta phase, the high surface area and the graphitic carbon coating.
Zhenyu Sun thanks the Alexander von Humboldt Foundation for financial support.
Notes and references
- J. Maier, Angew. Chem., Int. Ed., 2013, 52, 2–31 Search PubMed.
- N. S. Choi, Z. H. Chen, S. A. Freunberger, X. L. Ji, Y. K. Sun, K. Amine, G. Yushin, L. F. Nazar, J. Cho and P. G. Bruce, Angew. Chem., Int. Ed., 2012, 51, 2–33 CrossRef.
- A. R. Armstrong, G. Armstrong, J. Canales and P. G. Bruce, Angew. Chem., Int. Ed., 2004, 43, 2286–2288 CrossRef CAS PubMed.
- A. R. Armstrong, G. Armstrong, J. Canales, R. García and P. G. Bruce, Adv. Mater., 2005, 17, 862–865 CrossRef CAS.
- H. S. Liu, Z. H. Bi, X. G. Sun, R. R. Unocic, M. P. Paranthaman, S. Dai and G. M. Brown, Adv. Mater., 2011, 23, 3450–3454 CrossRef CAS PubMed.
- S. H. Liu, H. P. Jia, L. Han, J. L. Wang, P. F. Gao, D. D. Xu, J. Yang and S. N. Che, Adv. Mater., 2012, 24, 3201–3204 CrossRef CAS PubMed.
- Y. Ren, Z. Liu, F. Pourpoint, A. R. Armstrong, C. P. Grey and P. G. Bruce, Angew. Chem., Int. Ed., 2012, 51, 2164–2167 CrossRef CAS PubMed.
- S. Brutti, V. Gentili, H. Menard, B. Scrosati and P. G. Bruce, Adv. Energy Mater., 2012, 2, 322–327 CrossRef CAS.
- S. H. Liu, Z. Y. Wang, C. Yu, H. B. Wu, G. Wang, Q. Dong, J. S. Qiu, A. Eychmüller and X. W. Lou, Adv. Mater., 2013, 25, 3462–3467 CrossRef CAS PubMed.
- A. G. Dylla, G. Henkelman and K. J. Stevenson, Acc. Chem. Res., 2013, 46, 1104–1112 CrossRef CAS PubMed.
- E. Ventosa, B. Mei, W. Xia, M. Muhler and W. Schuhmann, ChemSusChem, 2013, 6, 1312–1315 CrossRef CAS PubMed.
- A. S. Arico, P. G. Bruce, B. Scrosati, J. M. Tarascon and W. V. Schalkwijk, Nat. Mater., 2005, 4, 366–377 CrossRef CAS PubMed.
- Y. Ren, L. J. Hardwick and P. R. Bruce, Angew. Chem., Int. Ed., 2010, 49, 2570–2574 CrossRef CAS PubMed.
- G. L. Xiang, T. Y. Li, J. Zhuang and X. Wang, Chem. Commun., 2010, 46, 6801–6803 RSC.
- Z. Zhang, Q. Chu, H. Li, J. Hao, W. Yang, B. Lu, X. Kea, J. Li and and J. Tang, J. Colloid Interface Sci., 2013, 409, 38–42 CrossRef CAS PubMed.
- M. Zukalova, M. Kalbac, L. Kavan, I. Exnar and M. Graetzel, Chem. Mater., 2005, 17, 1248–1255 CrossRef CAS.
Footnote |
| † Electronic supplementary information (ESI) available: Experimental details, XPS, and nitrogen adsorption–desorption isotherms. See DOI: 10.1039/c4cc01888e |
| This journal is © The Royal Society of Chemistry 2014 |


