Cellulose-based polyelectrolyte complex nanoparticles for DNA vaccine delivery†
Yongbo
Song
a,
Ying
Zhou
a,
Sylvia
van Drunen Littel-van den Hurk
b and
Lingyun
Chen
*a
aDepartment of Agricultural, Food and Nutritional Science, University of Alberta, Edmonton, Canada T6G 2P5. E-mail: lingyun.chen@ualberta.ca; Fax: +1 780 492 42650
bVIDO/Intervac and Microbiology & Immunology, University of Saskatchewan, 120 Veterinary Road, Saskatoon, Canada S7N 5E3
First published on 7th July 2014
Abstract
Cellulose-based nanoparticles were prepared from oppositely charged carboxymethyl cellulose (CMC) and quaternized cellulose (QC) in an aqueous medium. The DNA complexing capacity of CMC–QC nanoparticles and the transfection efficiency of the DNA-loaded nanoparticles in COS-7 cells were first investigated using pEGFP-N1—a plasmid DNA encoding the enhanced green fluorescent protein (EGFP)—as a model, and then with a candidate DNA vaccine, pMASIA-tPAs-tE2.2, that has been developed against infection with bovine viral diarrhea virus (BVDV). The results revealed that CMC–QC nanoparticles could bind DNA efficiently, and the optimized DNA-loaded nanoparticles mediated very effective transfection in COS-7 cells, which was comparable to that achieved with Lipofectamine 2000. The novel CMC–QC nanoparticles show promise as a delivery system for DNA vaccines.
Introduction
DNA vaccines consist of circular plasmid DNA, which contains the gene encoding antigenic proteins and the promoter/terminator to allow gene expression in the mammalian host cells.1 Once the host cells take up DNA, the encoded foreign antigenic proteins can be expressed and presented to the cells of the immune system, providing protective immunity.2 In recent years, DNA vaccines have been regarded as one of the most promising new vaccination strategies.3,4 Compared with traditional vaccines such as whole killed viral vaccines, the advantage of DNA vaccines is that we can design and modify the plasmid vector, optimize the gene encoding the antigen of interest, and alter the sub-cellular localization.5 Therefore, we can rapidly modify DNA vaccines to include prevalent strains in the field.6 More importantly, DNA vaccines possess the capacity to induce both humoral and cellular immune responses, which are not affected by the presence of passively transferred or maternal antibodies.7–9 These potential advantages make use of plasmid DNA attractive for the development of effective vaccines, which thus has become an important focus in the research field.The practical applications of these novel DNA vaccines require the development of safe and efficient delivery systems. Indeed, all non-replicating vaccine types including whole killed and subunit protein vaccines need to be formulated with adjuvants and/or delivery systems for optimal efficacy. While classical adjuvants such as alum have been moderately successful with DNA vaccines,10,11 formulation with lipid complexes has resulted in enhanced humoral and cell-mediated immune responses.12,13 However, tissue reactions and limited stability are barriers to the routine use of liposomes. Delivery of DNA vaccines may also be improved using devices such as gene guns,14,15 liquid jet injection16,17 or electroporation systems.18 These technologies, in particular electroporation, resulted in enhanced immune responses and protection in various small and large animal models, as well as humans. However, the devices need to be further developed to become more affordable and simple before they can be routinely applied, in particular to vaccines in developing countries or for veterinary use.
Over the past few decades, polymeric nanoparticles have attracted much attention and been investigated as delivery carriers to improve the potency of drugs, including DNA vaccines.19–25 Polymeric nanoparticles have many attractive merits in mediating cellular penetration due to the ultra-tiny volume, protecting vaccines from degradation in biological media, and delivering vaccines to a target site followed by controlled release, thus enhancing the immune response following mucosal application.26 Nanoparticles are more readily taken up by dendritic cells, resulting in optimal immune responses, and therefore preferred as delivery vehicles over microparticles, both for protein and DNA vaccines.
Cellulose is one of the most widely used natural substances and has become one of the most important commercial biopolymeric raw materials. Microcrystalline cellulose and cellulose derivatives, such as carboxymethyl cellulose (CMC), hydroxyethyl cellulose (HEC), hydroxypropyl cellulose (HPC) and hydroxypropylmethyl cellulose (HPMC), are recognized as the popular polymeric materials routinely used in medical and pharmaceutical applications, such as controlled delivery systems.27 In our previous work,28 the polyelectrolyte complex nanoparticles were prepared by mixing negatively charged carboxymethyl cellulose (CMC) and positively charged quaternized cellulose (QC) in an aqueous medium. The novel CMC–QC nanoparticles have proven to be promising vehicles for controlled delivery of protein drugs. Both CMC and QC come from cellulose, which is a natural material with good tolerance by the body.29 The preparation procedure of CMC–QC nanoparticles is convenient under extremely mild aqueous conditions at room temperature. Moreover, the formation of CMC–QC nanoparticles is through physical crosslinking by electrostatic interactions instead of chemical bonds, therefore possible toxicity or deactivation caused by chemical crosslinking reagents is avoided. These attractive features make CMC–QC nanoparticles potential carriers for prophylactic and therapeutic active agents,28 such as DNA vaccines. However, such research has never been reported.
Therefore, it is hypothesized that the cellulose-based CMC–QC nanoparticles could be used as a delivery system for DNA vaccines. In this work, for the first time, the DNA complexing capacity of CMC–QC nanoparticles and the transfection efficiency of the DNA-loaded nanoparticles in COS-7 cells were first investigated using pEGFP-N1—a plasmid DNA encoding the enhanced green fluorescent protein (EGFP)—as a model, and then with a candidate DNA vaccine, pMASIA-tPAs-tE2.2, that has been developed against infection with bovine viral diarrhea virus (BVDV). Efficient transfection of DNA vaccine was demonstrated by cell culture experiments. Thus, this work provided a potential safe and convenient DNA vaccine delivery system.
Experimental
Materials
Wood cellulose (spruce bleached sulphate pulp) was kindly provided by Alberta-Pacific Forest Industries Inc. (Alberta, Canada), and the molecular weight was determined by viscometry in LiOH–urea aqueous solution to be 40.5 × 10⁴ g mol−1.28 The plasmid pEGFP-N1 (4.7 kb) was purchased from Clontech (CA, USA). The plasmid pMASIA-tPAs-tE2.2 was constructed as described previously.6 COS-7 cells were purchased from the American Type Culture Collection (ATCC, VA, USA). Lipofectamine 2000, 3-[4,5-dimethylthiazol-2-yl]-2,5-diphenyltetrazolium bromide (MTT), fetal bovine serum (FBS), and Minimal Essential Medium were purchased from Invitrogen Corp. (CA, USA). 3-Chloro-2-hydroxypropyltrimethylammonium chloride (CHPTAC), sodium monochloroacetate, 4′,6-diamidino-2-phenylindole (DAPI), Alexa Fluor® 594-conjugated concanavalin A, alkaline phosphatase (AP)-conjugated rabbit-specific IgG, 5-bromo-4-chloro-3-indolylphosphate, nitroblue tetrazolium, and p-nitrophenyl phosphate (PNPP) were purchased from Sigma-Aldrich (MO, USA). All reagents were of analytical grade and used without further purification.Polymer synthesis
QC and CMC were prepared according to the previous research.28 Briefly, 50 g CHPTAC (60 wt% aq.) or 25 g solid sodium monochloroacetate was added gradually to 100 g of wood cellulose solution (1 wt% in LiOH–urea aq.), respectively, and then the mixture was stirred vigorously. The quaternization reaction was kept at 25 °C for 24 h, while the carboxymethylation reaction was kept at 55 °C for 5 h. The reaction products were dialyzed against distilled water using a dialysis tube (Mw cutoff 5000 Da), and then freeze-dried to obtain the water-soluble QC and CMC samples.Nanoparticle formation and DNA loading
CMC–QC complex nanoparticles were prepared by the following method: 50 μL CMC aqueous solutions (0.02–0.1 mg mL−1) were mixed with 100 μL 0.2–1.0 mg mL−1 QC aqueous solutions, followed by vigorous vortexing for 30 s. The DNA-loaded CMC–QC nanoparticles were prepared by subsequently adding plasmid DNA solutions to CMC–QC nanoparticles and mixing with gentle pipetting. QC/DNA complexes were used in some experiments for comparative purposes, prepared by mixing 100 μL QC aqueous solutions and DNA solutions immediately followed by vortexing for 30 s. All the formed samples were incubated for 30 min at room temperature before further use and characterization. The N/P ratio was set at 4, 10, and 20, respectively, which represents the ratio of theoretical free ammonium groups in the nanoparticles (N) to negative phosphates of DNA (P).The DNA loading efficiency of CMC–QC nanoparticles was calculated by measuring the difference between the amount of DNA added to the nanoparticle solution and the measured non-loaded DNA remaining in the aqueous phase after nanoparticle formation. After formation, the nanoparticle suspension was centrifuged for 30 min at 14![[thin space (1/6-em)]](https://www.rsc.org/images/entities/char_2009.gif) 000 rpm and the supernatant was checked for the non-loaded DNA concentration with a NanoDrop-1000 Spectrophotometer (NanoDrop Technologies, Inc., DE, USA). DNA was used as the positive control, and CMC–QC nanoparticles without DNA were used as the blank.
000 rpm and the supernatant was checked for the non-loaded DNA concentration with a NanoDrop-1000 Spectrophotometer (NanoDrop Technologies, Inc., DE, USA). DNA was used as the positive control, and CMC–QC nanoparticles without DNA were used as the blank.
Nanoparticle characterization
The zeta potential and particle size of nanoparticles were measured using a Zetasizer Nano-ZS ZEN1600 (Malven Instruments, UK) at 25 °C. The morphology of DNA-loaded CMC–QC nanoparticles was observed using a transmission electron microscope (TEM, Philips Morgagni 268, FEI Company, Netherlands). Freshly prepared samples containing phosphotungstic acid aqueous solution were placed on a copper grid covered with a Formvar film. The particle concentration was determined to be 2800 particles mL−1 using an optical particle counter (Particle Measuring Systems, Inc., CO, USA). The aqueous solution was blotted away with filter paper, and then examined at 80 kV.Agarose gel electrophoresis
Agarose gel electrophoresis experiments were performed to monitor the complexation of DNAs to CMC–QC nanoparticles. Samples of naked DNAs, QC/DNA nanoparticles, and DNA-loaded nanoparticles were run in an electrophoresis system (Embi Tec, CA, USA) on agarose gel at 100 V. DNA bands were visualized under the typhoon variable mode imager (Amersham Biosciences, NJ, USA).In vitro cytotoxicity
COS-7 cells were seeded in 96-well plates at 6 × 10³ cells per well and cultured in 150 μL Minimal Essential Medium (MEM) containing 10% FBS at 37 °C for 24 h. Freshly prepared nanoparticles or complexes were added for 6 hours and then replaced by medium. After 48 h, 20 μL aliquots of MTT solution (5 mg mL−1 in PBS) were added to each well and the plates were incubated for 4 h at 37 °C, followed by removal of the media and addition of 150 μL DMSO to each well. The absorbance was measured at 570 nm using a microplate reader (GENios, Tecan, Männedorf, Switzerland).In vitro transfection of COS-7 cells
COS-7 cells were seeded at a density of 6 × 10⁴ cells per well in a 24-well plate with 1 mL MEM containing 10% FBS and incubated at 37 °C for 24 h prior to transfection. When the cells were at 80–90% confluence, the culture medium was washed with PBS, and then the DNA-loaded CMC–QC nanoparticles were added (the same ratio of the cells as in the MTT assay), with serum-free or 10% serum-containing culture medium. Each well received 2 μg DNA. Naked DNA was used as a negative control. Lipofectamine was used as a positive control according to the manufacturer's procedures. QC/DNA complex nanoparticles were used for comparison. After incubation for 6 h at 37 °C, the cells received 1 mL complete medium and were incubated until 48 h post-transfection.Fluorescence microscopy and flow cytometry
In order to directly visualize the pEGFP-N1 gene transfection, the expression of the enhanced green fluorescent protein (EGFP) in COS-7 cells was evaluated immediately by fluorescence microscopy. The bright-field images of transfected COS-7 cells were also recorded to observe the morphology of transfected COS-7 cells. The microscopy images were recorded at a magnification of 100×. The percentage of fluorescent cells presented per 1 × 10⁴ cells was also determined and calculated by flow cytometry. Cells were removed from the wells using cold EDTA (0.6 mM in PBS), transferred to tubes and analyzed directly (FACSCalibur, BD Biosciences, San Jose, CA, USA).Confocal laser scanning microscopy
Confocal laser scanning microscopy (CLSM) was used to image the EGFP expression in the transfected COS-7 cells. COS-7 cells (5 × 10⁴ cells per well) were seeded into a glass bottom microwell dish (no. 1.5 cover glass, MatTek Corp., MA, USA), and allowed to incubate for 24 h at 37 °C in 5% CO2. Cells were transfected with DNA-loaded CMC–QC nanoparticles according to the above protocols. Subsequently, cells were fixed with an ice-cold solution of 3.7% formaldehyde in PBS (0.01 M, pH 7.4) for 30 min, and then washed 3 times with PBS. The cell nuclei were stained with DAPI (1 μg mL−1 in PBS) and the cell apical membranes were stained with Alexa Fluor® 594-conjugated concanavalin A (5 μg mL−1 in PBS). Cells were observed with a CLSM 510 Meta confocal laser scanning microscope (Carl Zeiss, Jena, Germany). The fluorescence images of cells were analyzed simultaneously at wavelengths of 405, 488 and 561 nm. Images were processed with the ZEN 2009 LE software. An oil immersion objective (40×) was used to visualize the sample. During the entire preparation process, exposure to strong light was avoided.Western blotting
In order to observe the in vitro expression of the BVDV E2 protein, COS-7 cells and the supernatant media were collected separately right after transfection. The supernatant media were concentrated 10 times with an Amicon Ultra 10000 molecular weight cut-off filter (GE Healthcare, UK). The cells were lysed in RIPA buffer (50 mM Tris–HCl pH 8.0, 0.15 M NaCl, 0.1% SDS, 1% NP-40, 1% sodium deoxycholate) with 10 μg mL−1 aprotinin, 10 μg mL−1 leupeptin and 1 mM PMSF on ice for 30 min, and then centrifuged at 13000 rpm for 20 min (Eppendorf, NY, USA) to obtain the cell lysates. The cell lysates and supernatant media were boiled in SDS-PAGE sample buffer for 5 min, and separated on 10% SDS-polyacrylamide gels. The proteins were then transferred to a nitrocellulose membrane. The membrane was washed in TBST (0.15 M Tris, 0.02 M NaCl [pH 7.5] and 0.1% Tween-20), and incubated overnight with TBST containing 3% skimmed milk powder. Subsequently, the membrane was incubated with E2-specific rabbit serum for 1 h at room temperature. This was followed by incubation with alkaline phosphatase (AP)-conjugated rabbit-specific IgG at a dilution of 1:5000 for 1 h at RT. The bound antibodies were visualized with 5-bromo-4-chloro-3-indolylphosphate and nitroblue tetrazolium substrate.
Enzyme linked immunosorbent assay (ELISA)
To quantify the amounts of E2 produced in the supernatant media of plasmid-transfected COS-7 cells, 96-well high binding polystyrene micro-plates were coated overnight at RT with 100 μL of serially diluted culture supernatants. The serially diluted purified E2 protein was used as a reference. To detect the E2 protein, the plates were incubated for 2 h at RT with E2-specific rabbit serum. This was followed by an incubation with AP-conjugated rabbit-specific IgG diluted 1:5000 for 2 h at RT. The reactions were visualized with 0.01 M p-nitrophenyl phosphate (PNPP). The absorbance was read on a microplate reader (GENios, Tecan, Männedorf, Switzerland) at 405 nm, with a reference wavelength of 490 nm. ELISA titres were calculated as the highest dilution resulting in a reading of two standard deviations above the value of a negative control serum.
Statistical analysis
All samples were prepared and tested in triplicates or more. Data were presented as mean ± standard deviation (SD). The statistical significance of differences between groups was determined by the Student–Newman–Keuls (SNK) test. The differences were considered significant for *P < 0.05, and highly significant for **P < 0.01.Results and discussion
Zeta potential and particle size
The formation of the CMC–QC nanoparticles was achieved through the electrostatic interaction. Driven by the electrostatic attraction between negatively charged CMC and positively charged QC, CMC and QC interacted spontaneously, which caused CMC and QC macromolecular chains to curl up and form insoluble CMC–QC complex nanoparticles.28 The surface charge and particle size of the nanoparticles are very important for nanoparticles used as gene delivery vectors. These two factors play important roles in the endosomal uptake, the cytoplasmic transport, and the migration through the nucleopore complexes, which mediate the bidirectional transport between the cytoplasm and the nucleus.30 In this study, the zeta potential and particle size of CMC–QC nanoparticles with different CMC concentrations were measured. Positively charged CMC–QC nanoparticles were selected to load DNAs since they were expected to complex negatively charged DNA efficiently. The DNA-loaded nanoparticles with positive charge should fuse with the negatively charged plasma membrane of living cells due to the electrostatic interaction, allowing DNA to overcome the electrostatic repulsion of the cell membrane and to cross into the cytoplasm and nucleus to be available for expression.31As shown in Fig. 1a, for the two kinds of plasmid DNA, pEGFP-N1 and pMASIA-tPAs-tE2.2, DNA-loaded CMC–QC nanoparticles had almost the same zeta potential when prepared under the same conditions. The zeta potential of CMC–QC nanoparticles (with or without DNA) ranged from 19.4 to 28.4 mV, and decreased with increasing CMC concentration because of the negative charge of CMC. When the CMC concentration increased to 0.1 mg mL−1, the zeta potential of both kinds of DNA-loaded CMC–QC nanoparticles became low (19.6 and 19.4 mV respectively), resulting in complexes that were not sufficiently stable. For both kinds of plasmid DNAs, DNA-loaded CMC–QC nanoparticles had a significantly decreased zeta potential compared to CMC–QC nanoparticles without DNA (P < 0.05). This can be explained by the negative charge of DNAs which could build electrostatic interactions with free positive charges of nanoparticles, consequently DNAs could be better loaded in the system. The positive surface charge of DNA-loaded CMC–QC nanoparticles is essential to facilitate nanoparticle uptake by cells, because the positive surface charge ensures the electrostatic interaction between positively charged complexes and negatively charged cellular membranes.
 | ||
| Fig. 1 (a) Zeta potential and (b) particle size of the CMC–QC nanoparticles without DNA and with DNA (QC = 0.2 mg mL−1; N/P = 4). *P < 0.05 compared with the nanoparticles without DNA. | ||
Fig. 1b shows the particle size of the above positively charged CMC–QC nanoparticles and DNA-loaded nanoparticles. The mean size ranged from 264 to 376 nm depending on the CMC concentration. DNA-loaded CMC–QC nanoparticles had almost the same size when prepared under the same conditions, regardless of the DNA type. The particle size of the CMC–QC nanoparticles decreased with increasing CMC concentration. The trend is in good agreement with previous investigations,28,31 and might be attributed to the increased interaction between QC and more CMC molecules at higher CMC concentrations, which led to the formation of a more compact structure.28
It is worthwhile to note that compared with CMC–QC nanoparticles (ranging from 302 to 376 nm), the size of the DNA-loaded CMC–QC nanoparticles decreased slightly (ranging from 264 to 299 nm). For example, when CMC–QC nanoparticles were prepared at 0.02 mg mL−1 CMC concentration, the particle size decreased from 376 nm to 290 nm after loading of pEGFP-N1 DNA. This was because DNA acted as the ionic crosslinking agent to further promote the CMC–QC complex interactions, and thus created the more compact and smaller nanoparticles.32 It has been well-recognized that the size of the particles plays a vital role in their adhesion to and interaction with mammalian cells.33 The CMC–QC nanoparticles with a size of 250–300 nm prepared in this work have potential to be efficacious as DNA delivery vehicles, due to their ability to overcome various biological barriers and to localize into the target sites.34
DNA loading efficiency of CMC–QC nanoparticles
Table 1 summarizes the DNA loading efficiency of CMC–QC nanoparticles. Under all the tested conditions, almost all the DNA (above 90%) was captured in the CMC–QC nanoparticles. As expected, the higher initial CMC concentration led to the slightly decreased DNA loading efficiency of the nanoparticles, which might result in the competition between the negatively charged CMC and DNA.| CMC (mg mL−1) | Loading efficiency (%) of pEGFP-N1 | Loading efficiency (%) of pMASIA-tPAs-tE2.2 |
|---|---|---|
| 0 | 92.70 ± 0.48 | 93.75 ± 0.37 |
| 0.02 | 92.65 ± 1.31 | 92.55 ± 1.52 |
| 0.05 | 91.73 ± 0.82 | 90.75 ± 0.54 |
| 0.1 | 90.25 ± 0.71 | 90.59 ± 1.72 |
Morphology
To further characterize the formation of DNA-loaded CMC–QC nanoparticles, the representative morphology of CMC–QC nanoparticles with both DNAs was observed by transmission electron microscopy. As illustrated in Fig. 2, both kinds of DNA-loaded CMC–QC nanoparticles were approximately spherical and were dispersed homogeneously. This homogeneous dispersal was due to the electrostatic repulsions of the positive charges on nanoparticle surfaces.28 The mean size of pEGFP-N1 loaded CMC–QC nanoparticles was about 200 nm, and the mean size of pMASIA-tPAs-tE2.2 loaded CMC–QC nanoparticles was about 250 nm. The mean sizes of two kinds of DNA-loaded CMC–QC nanoparticles observed by TEM were slightly smaller than those measured by dynamic light scattering (Fig. 1b). This discrepancy might be explained by the hydration effect. The particle size measured by dynamic light scattering is the hydrodynamic diameter of nanoparticles in the aqueous solution, while it is that of the dried nanoparticles when observed by TEM. | ||
| Fig. 2 TEM images of DNA-loaded CMC–QC nanoparticles: (a) with pEGFP-N1 and (b) with pMASIA-tPAs-tE2.2 (CMC = 0.05 mg mL−1; QC = 0.2 mg mL−1; N/P = 4). | ||
Agarose gel electrophoresis
Delivery vectors should be able to complex and condense DNA into compact structures and reduce the electrostatic repulsion between DNA and the cell surface by neutralizing the negative charge, which facilitates the uptake of the complex through negatively charged cell membrane constituents, leading to a higher rate of uptake. When DNA is complexed by the delivery vectors, it also can be better protected against enzymatic degradation by nucleases in serum and extracellular fluids.30In this work, the ability of CMC–QC nanoparticles with different CMC concentrations to complex plasmid DNAs was studied by agarose gel electrophoresis, and QC/DNA complexes were used for comparison. The results of gel electrophoresis measurements are displayed in Fig. 3. Clearly as observed, at a QC concentration of 0.2 mg mL−1 (N/P ratio 4), both plasmid DNAs were complexed completely with QC and CMC–QC nanoparticles within the studied CMC concentrations as the migration of DNA under electrophoretic conditions was prevented in all tested samples.
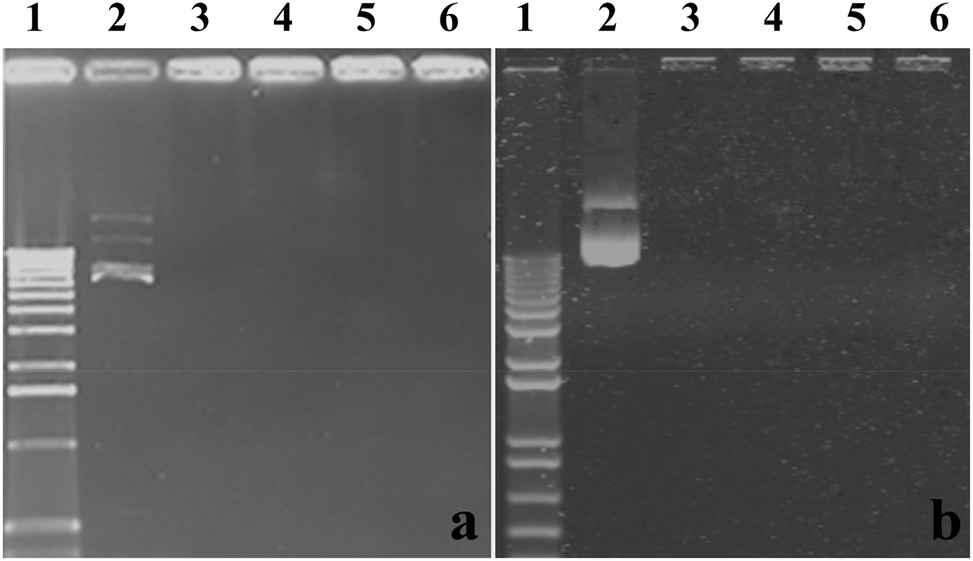 | ||
| Fig. 3 Agarose gel electrophoresis assay: (a) with pEGFP-N1 and (b) with pMASIA-tPAs-tE2.2. (1) DNA marker, (2) naked DNA, (3) QC/DNA complexes, (4–6) DNA-loaded CMC–QC nanoparticles. (4) CMC = 0.02 mg mL−1, (5) CMC = 0.05 mg mL−1, and (6) CMC = 0.1 mg mL−1 (QC = 0.2 mg mL−1; N/P = 4). | ||
In vitro cytotoxicity assay
The cytotoxicity of nanoparticles and DNA-loaded nanoparticles was evaluated by the MTT assay. As revealed in Fig. 4, DNA-loaded CMC–QC nanoparticles exhibited significantly reduced toxicity compared with QC/DNA complexes (P < 0.05). This might be attributed to the fact that CMC significantly reduced the positive surface charge of QC/DNA complexes. Higher CMC concentrations led to lower cytotoxicity. MTT data demonstrate that the cytotoxicity of CMC–QC nanoparticles can be optimally controlled by adjusting their composition. This can provide an effective way to modulate the structure to reduce toxicity, which is an essential factor for developing applications. When either negatively charged DNA was loaded, DNA-loaded CMC–QC nanoparticles exhibited lower cytotoxicity than CMC–QC nanoparticles without DNA. The reason might be that the positive charge of nanoparticles was counterbalanced by the negative charge of DNA, which minimized the direct contact of cationic nanoparticles with cellular membranes.35 Moreover, the cytotoxicity of DNA-loaded CMC–QC nanoparticles was significantly lower in comparison with Lipofectamine/DNA nanoparticles (P < 0.05). High cell viability (84–91%) observed for both DNA-loaded nanoparticles demonstrates that these samples are relatively safe, and thus guarantee promising prospects of this DNA carrier in clinical applications. | ||
| Fig. 4 48 h cell viabilities of COS-7 cells in the presence of CMC–QC nanoparticles without DNA and with DNA (QC = 0.2 mg mL−1; N/P = 4). *P < 0.05 compared with Lipofectamine/DNA, QC/DNA, and CMC–QC nanoparticles without DNA. | ||
In vitro transfection of pEGFP-N1
 | ||
| Fig. 5 Fluorescence (top) and bright-field (bottom) images of enhanced green fluorescent protein (GFP) expression in COS-7 cells. ABCD were in the presence of serum while abcd were for without serum. (Aa) Lipofectamine/DNA complexes, (Bb) QC/DNA complexes, (CcDd) DNA-loaded CMC–QC nanoparticles. (Cc) CMC = 0.05 mg mL−1 and (Dd) CMC = 0.1 mg mL−1. (QC = 0.2 mg mL−1; N/P = 4. Scale bars 100 μm.) | ||
Results demonstrated the dependence of the transfection efficiency on the N/P ratio and CMC concentration. DNA-loaded CMC–QC nanoparticles formed at higher N/P ratios (10 and 20) led to very low transfection (pictures not shown); indeed, the levels were not significantly different from those achieved with the naked plasmid DNA. This was likely due to the fact that DNA-loaded CMC–QC nanoparticles formed at higher N/P ratios were too stable, which prohibited the release of DNA from the complexes once complexes arrived in the cytosol of the cells.36,37 QC/DNA complexes, at a lower N/P ratio of 4 (Fig. 5b), transfected cells less efficiently than Lipofectamine (Fig. 5a), which is a common transfection reagent used to increase the transfection efficiency of plasmid DNA. Thus, QC/DNA complexes did not mediate the transfection with satisfactory efficiency, which might result from the limited DNA release in cells due to the high affinity of QC for DNA. The strength of the interaction between QC and DNA resulted in highly stable nanoparticles, thereby preventing DNA dissociation within the cells and ultimately precluding the translation of DNA, resulting in the relatively lower transfection.38
To improve the transfection efficiency of QC/DNA complexes, we incorporated a negatively charged polymer—CMC, which was an approach previously used to improve liposomes and other polycationic non-viral systems.39 It is expected that the incorporation of negatively charged CMC into the system would reduce the strength of interactions between DNA and QC molecules, which should increase the transfection efficiency of the system by facilitating the release of DNA once the complexes had been internalized by cells. The study results indicated that, compared with QC/DNA complexes, the presence of a lower concentration of CMC (for example 0.05 mg mL−1) in the complex system provided more efficient transfection (Fig. 5c), which was comparable to that mediated by Lipofectamine/DNA (Fig. 5a). The improvement in transfection efficiency resulted from the incorporation of negatively charged CMC, which effectively reduced the binding between QC and DNA.39,40 However, it is worthwhile to note that at higher CMC concentrations (for example 0.1 mg mL−1, Fig. 5d), the complexes formed were not sufficiently stable because of the low zeta potential (see Fig. 1a). Therefore, DNA would be easily dissociated too early once DNA-loaded nanoparticles had been internalized by cells and then may never reach the nucleus, which results in low protein expression.
The development of gene vectors that are stable even in serum after coagulation of blood is very important for practical applications.41,42 In this study, the effect of serum on the transfection efficiency of DNA-loaded nanoparticles was further evaluated. As shown in Fig. 5A–D, the transfection efficiency of DNA-loaded nanoparticles was not inhibited apparently in comparison with that in the absence of serum. It has been reported that the polysaccharide polymers could prevent the serum-mediated aggregation in serum through steric stabilization.43–45 Therefore, we speculate that the saccharide ring chains of CMC–QC systems may play an important role in these DNA-loaded nanoparticles to resist the inhibition of serum.
 | ||
| Fig. 6 Transfection efficiency of pEGFP-N1 in COS-7 cells by flow cytometry. Cells were transfected with DNA-loaded CMC–QC nanoparticles in the presence of increasing CMC concentrations (QC = 0.2 mg mL−1; N/P = 4). *P < 0.05 compared with QC/DNA complexes; **P < 0.01 compared with naked pDNA. | ||
 | ||
| Fig. 7 Confocal microscopic images of COS-7 cells transfected by pEGFP-N1 loaded CMC–QC nanoparticles. (a) Fluorescence blue channel of cell nuclei, (b) fluorescence green channel of green fluorescent protein expression, (c) fluorescence red channel of cell membranes, and (d) overlapped image (CMC = 0.05 mg mL−1; QC = 0.2 mg mL−1; N/P = 4). | ||
In vitro transfection of pMASIA-tPAs-tE2.2
 | ||
| Fig. 8 Western blotting of E2 protein expression in supernatant media (top) and cell lysates (bottom). (1) Marker, (2) QC/DNA complexes, (3–5) DNA-loaded CMC–QC nanoparticles. (3) CMC 0.02 mg mL−1, (4) CMC 0.05 mg mL−1, and (5) CMC 0.1 mg mL−1. (6) Lipofectamine/DNA complexes (QC = 0.2 mg mL−1; N/P = 4). | ||
 | ||
| Fig. 9 Expression of the E2 protein in supernatant media of transfected COS-7 cells measured by ELISA. Cells were transfected with DNA-loaded CMC–QC nanoparticles in the presence of increasing CMC concentrations (QC = 0.2 mg mL−1; N/P = 4). *P < 0.05 compared with QC/DNA complexes; **P < 0.01 compared with naked pDNA. | ||
Conclusions
Novel cellulose nanoparticles were prepared from oppositely charged CMC and QC and evaluated as a potential delivery system for DNA vaccines. The DNA-loaded CMC–QC nanoparticles had a mean size of 264–299 nm and a positive zeta potential of 19.4–28.4 mV, providing characteristics desirable for DNA vaccine delivery. Compared with QC/DNA complexes, the presence of a lower concentration of CMC (0.02 and 0.05 mg mL−1) in the complex system effectively reduced the binding between QC and DNA, and thereby provided much more efficient transfection. However, at a higher CMC concentration (0.1 mg mL−1), the complexes formed were not sufficiently stable and resulted in low transfection efficiency because the DNA would dissociate too early. CMC–QC nanoparticles with 0.05 mg mL−1 CMC mediated the most efficient transfection, which was comparable to Lipofectamine. This great improvement in transfection efficiency while maintaining low toxicity makes CMC–QC nanoparticles suitable candidates for DNA vaccine delivery.Acknowledgements
The authors thank Marlene Snider for technical assistance, and are grateful to the Natural Sciences and Engineering Research Council of Canada (NSERC), the Alberta Crop Industry Development Fund Ltd (ACIDF) and the Alberta Livestock and Meat Agency Ltd (ALMA) for financial support as well as the Canada Foundation for Innovation (CFI) for equipment support. We thank Alberta-Pacific Forest Industries Inc. (Alberta, Canada) for providing wood cellulose samples.References
- M. A. Liu, J. Intern. Med., 2003, 253, 402–410 CrossRef CAS.
- E. F. Fynan, R. G. Webster, D. H. Fuller, J. R. Haynes, J. C. Santoro and H. L. Robinson, Int. J. Immunopharmacol., 1995, 17, 79–83 CrossRef CAS.
- A. Cadete, L. Figueiredo, R. Lopes, C. C. R. Calado, A. J. Almeida and L. M. D. Gonçalves, Eur. J. Pharm. Sci., 2012, 45, 451–458 CrossRef CAS PubMed.
- K. Un, S. Kawakami, R. Suzuki, K. Maruyama, F. Yamashita and M. Hashida, Mol. Pharm., 2011, 8, 543–554 CrossRef CAS PubMed.
- S. Manoj, L. A. Babiuk and S. van Drunen Littel-van den Hurk, Virology, 2003, 313, 296–307 CrossRef CAS.
- R. Liang, J. V. van den Hurk, C. Zheng, H. Yu, R. A. Pontarollo, L. A. Babiuk and S. van Drunen Littel-van den Hurk, Vaccine, 2005, 23, 5252–5262 CrossRef CAS PubMed.
- V. Gerdts, L. A. Babiuk, S. van Drunen Littel-van den Hurk and P. J. Griebel, Nat. Med., 2000, 6, 929–932 CrossRef CAS PubMed.
- P. J. Lewis, S. van Drunen Littel-van den Hurk and L. A. Babiuk, J. Gen. Virol., 1999, 80, 2829–2837 CAS.
- S. van Drunen Littel-van den Hurk, R. P. Braun, P. J. Lewis, B. C. Karvonen, L. A. Babiuk and P. J. Griebel, Viral Immunol., 1999, 12, 67–77 CrossRef CAS.
- M. Rosado-Vallado, M. Mut-Martin, R. García-Miss Mdel and E. Dumonteil, Vaccine, 2005, 23, 5372–5379 CrossRef CAS PubMed.
- N. J. Temperton, D. C. Quenelle, K. M. Lawson, J. N. Zuckerman, E. R. Kern, P. D. Griffiths and V. C. Emery, J. Med. Virol., 2003, 70, 86–90 CrossRef CAS PubMed.
- G. S. Jimenez, R. Planchon, Q. Wei, D. Rusalov, A. Geall, J. Enas, P. Lalor, V. Leamy, R. Vahle, C. J. Luke, A. Rolland, D. C. Kaslow and L. R. Smith, Hum. Vaccines, 2007, 3, 157–164 CrossRef CAS.
- C. H. Pan, G. S. Jimenez, N. Nair, Q. Wei, R. J. Adams, F. P. Polack, A. Rolland, A. Vilalta and D. E. Griffin, Clin. Vaccine Immunol., 2008, 15, 1214–1221 CrossRef CAS PubMed.
- R. P. Braun, L. A. Babiuk, B. I. Loehr and S. van Drunen Littel-van den Hurk, Virology, 1999, 265, 46–56 CrossRef CAS PubMed.
- M. J. McCluskie, C. L. Brazolot Millan, R. A. Gramzinski, H. L. Robinson, J. C. Santoro, J. T. Fuller, G. Widera, J. R. Haynes, R. H. Purcell and H. L. Davis, Mol. Med., 1999, 5, 287–300 CAS.
- A. Bråve, L. Gudmundsdotter, E. Sandstrom, B. K. Haller, D. Hallengard, A. K. Maltais, A. D. King, R. R. Stout, P. Blomberg, U. Hoglund, B. Hejdeman, G. Biberfeld and B. Wahren, Vaccine, 2010, 28, 8203–8209 CrossRef PubMed.
- S. S. Rao, P. Gomez, J. R. Mascola, V. Dang, G. R. Krivulka, F. Yu, C. I. Lord, L. Shen, R. Bailer, G. J. Nabel and N. L. Letvin, Vaccine, 2006, 24, 367–373 CrossRef CAS PubMed.
- S. van Drunen Littel-van den Hurk and D. Hannaman, Expert Rev. Vaccines, 2010, 9, 503–517 CrossRef CAS PubMed.
- F. Jia, X. Liu, L. Li, S. Mallapragada, B. Narasimhan and Q. Wang, J. Controlled Release, 2013, 172, 1020–1034 CrossRef CAS PubMed.
- B. Büyüktimkin, Q. Wang, P. Kiptoo, J. M. Stewart, C. Berkland and T. J. Siahaan, Mol. Pharm., 2012, 9, 979–985 CrossRef PubMed.
- Z. Gu, A. A. Aimetti, Q. Wang, T. T. Dang, Y. Zhang, O. Veiseh, H. Cheng, R. S. Langer and D. G. Anderson, ACS Nano, 2013, 7, 4194–4201 CrossRef CAS PubMed.
- Q. Wang, Z. Gu, S. Jamal, M. S. Detamore and C. Berkland, Tissue Eng., Part A, 2013, 19, 2586–2593 CrossRef CAS PubMed.
- Y. Yue and C. Wu, Biomater. Sci., 2013, 1, 152–170 RSC.
- A. Kulkarni, R. VerHeul, K. DeFrees, C. J. Collins, R. A. Schuldt, A. Vlahu and D. H. Thompson, Biomater. Sci., 2013, 1, 1029–1033 RSC.
- M. Byrne, D. Victory, A. Hibbitts, M. Lanigan, A. Heise and S. A. Cryan, Biomater. Sci., 2013, 1, 1223–1234 RSC.
- K. L. Douglas, C. A. Piccirillo and M. Tabrizian, J. Controlled Release, 2006, 115, 354–361 CrossRef CAS PubMed.
- S. Kamel, N. Ali, K. Jahangir, S. M. Shah and A. A. El-Gendy, eXPRESS Polym. Lett., 2008, 2, 758–778 CrossRef CAS.
- Y. Song, Y. Zhou and L. Chen, J. Mater. Chem., 2012, 22, 2512–2519 RSC.
- K. A. Mahmoud, J. A. Mena, K. B. Male, S. Hrapovic, A. Kamen and J. H. Luong, ACS Appl. Mater. Interfaces, 2010, 2, 2924–2932 CAS.
- I. Y. Farber and A. J. Domb, Mater. Sci. Eng. C, 2007, 27, 595–598 CrossRef PubMed.
- C. Schatz, A. Domard, C. Viton, C. Pichot and T. Delair, Biomacromolecules, 2004, 5, 1882–1892 CrossRef CAS PubMed.
- Z. Liu, Y. Jiao, F. Liu and Z. Zhang, J. Biomed. Mater. Res., Part A, 2007, 83, 806–812 CrossRef PubMed.
- K. Y. Win and S. S. Feng, Biomaterials, 2005, 26, 2713–2722 CrossRef CAS PubMed.
- N. Hussain, V. Jaitley and A. T. Florence, Adv. Drug Delivery Rev., 2001, 50, 107–142 CrossRef CAS.
- M. C. Garnett and P. Kallinteri, Occup. Med., 2006, 56, 307–311 CrossRef CAS PubMed.
- M. Köping-Höggård, I. Tubulekas, H. Guan, K. Edwards, M. Nilsson, K. M. Vårum and P. Artursson, Gene Ther., 2001, 8, 1108–1121 CrossRef PubMed.
- F. C. MacLaughlin, R. J. Mumper, J. Wang, J. M. Tagliaferri, I. Gill, M. Hinchcliffe and A. P. Rolland, J. Controlled Release, 1998, 56, 259–272 CrossRef CAS.
- F. Fayazpour, B. Lucas, C. Alvarez-Lorenzo, N. N. Sanders, J. Demeester and S. C. De Smedt, Biomacromolecules, 2006, 7, 2856–2862 CrossRef CAS PubMed.
- G. Kaul and M. Amiji, Pharm. Res., 2002, 19, 1061–1067 CrossRef CAS.
- K. L. Douglas and M. Tabrizian, J. Biomater. Sci., Polym. Ed., 2005, 16, 43–56 CrossRef CAS PubMed.
- G. Borchard, Adv. Drug Delivery Rev., 2001, 52, 145–150 CrossRef CAS.
- J. H. Jeong, S. W. Kim and T. G. Park, Prog. Polym. Sci., 2007, 32, 1239–1274 CrossRef CAS PubMed.
- W. C. Tseng and C. M. Jong, Biomacromolecules, 2003, 4, 1277–1284 CrossRef CAS PubMed.
- S. Srinivasachari, Y. Liu, G. Zhang, L. Prevette and T. M. Reineke, J. Am. Chem. Soc., 2006, 128, 8176–8184 CrossRef CAS PubMed.
- A. Maruyama, T. Ishihara, J. S. Kim, S. W. Kim and T. Araike, Bioconjugate Chem., 1997, 8, 735–742 CrossRef CAS PubMed.
Footnote |
| † Electronic supplementary information (ESI) available. See DOI: 10.1039/c4bm00202d |
| This journal is © The Royal Society of Chemistry 2014 |