Ratiometric fluorescence imaging of lysosomal Zn2+ release under oxidative stress in neural stem cells†
Received
29th July 2013
, Accepted 14th August 2013
First published on 11th September 2013
Introduction
Zinc, a potential endogenous trigger of oxidative stress in the brain, is abundant in glutamatergic vesicles of the forebrain association pathways and released with neuronal activity or depolarisation.1 Within brain tissue, zinc is non-uniformly distributed and most abundantly in the hippocampus, amygdala, neocortex and olfactory bulb regions.2 In the hippocampus, a region of the brain essential for learning and long-term memory storage, Zn2+ concentrations can reach up to 300 μM.2 In hippocampal neurons, the majority of the zinc-containing vesicles are lysosomes.3 Acidic organelles, taking lysosome as an example, contain various acidic hydrolases that are active at pH 5 and serve as the main sites for macromolecular degradation.4 Recent studies have implicated lysosomal membrane permeabilisation (LMP) as a key contributor to oxidative and zinc-induced hippocampal neuronal death,3 which has functions in various neurodegenerative diseases such as Alzheimer's disease and Huntington's disease.5 Therefore, understanding the mechanism of regulation of lysosomal Zn2+ levels in neurons is helpful for the diagnosis and treatment of neurodegenerative disease.
Fluorescence imaging technology, highlighted for its high spatial and temporal resolution, is regarded as a promising method for monitoring biological species in living cells. Over the past decade, significant efforts have been made to develop Zn2+-selective probes.6 However, lysosomal Zn2+ detection needs to meet the following requirements: (1) it must reliably monitor Zn2+ concentrations under acidic conditions, since the vast majority of reported Zn2+ probes are proton-sensitive at a pH ranging from 4.5 to 6.0 with high pKa values; (2) it must have high selectivity towards Zn2+ over other potential competing species; and (3) it must deliver the Zn2+ probes into lysosomes. Also, compared with fluorescence intensity-based probes, ratiometric probes can realise quantitative detection more effectively by measuring the ratio of the fluorescence intensities at two different wavelengths, thus, ratiometric probes are ideal tools for quantitative analysis.7
In this paper, we present a ratiometric and lysosome-targeted Zn2+-selective probe, LysoZn-1. Zn2+ can induce obvious fluorescence intensity (578 nm) and ratiometric (F578![[thin space (1/6-em)]](https://www.rsc.org/images/entities/char_2009.gif) nm/F680nm) enhancement of LysoZn-1, while its responses to Cd2+ and other ions are weak. LysoZn-1 is pH-insensitive under acidic conditions between pH 4.5 and 6.0 with a macro pKa value of 3.4. Chloroquine, which can increase lysosomal pH, has no obvious influence on the fluorescence ratio of LysoZn-1 in living cells. Furthermore, LysoZn-1 can easily stain lysosomes in neural stem cells (NSCs) and other common cancer cell lines (Hela and MCF-7 cells) and be successfully used to detect lysosomal Zn2+ release upon H2O2 stimulation in NSCs.
nm/F680nm) enhancement of LysoZn-1, while its responses to Cd2+ and other ions are weak. LysoZn-1 is pH-insensitive under acidic conditions between pH 4.5 and 6.0 with a macro pKa value of 3.4. Chloroquine, which can increase lysosomal pH, has no obvious influence on the fluorescence ratio of LysoZn-1 in living cells. Furthermore, LysoZn-1 can easily stain lysosomes in neural stem cells (NSCs) and other common cancer cell lines (Hela and MCF-7 cells) and be successfully used to detect lysosomal Zn2+ release upon H2O2 stimulation in NSCs.
Experimental section
Materials and methods
All of the solvents used were of analytical grade. Solutions of metal ions were prepared from AgNO3, BaCl2·2H2O, CaCl2, CdCl2, CoCl2·6H2O, CrCl3, FeCl3·6H2O, HgCl2, KCl, MgCl2·6H2O, MnCl2·5H2O, NaCl, NiCl2·6H2O, PbCl2 and ZnCl2 dissolved in distilled water and [(CH3CN)4Cu]PF6 dissolved in CH3CN. Stock solutions of 5.0 mM for HgCl2 and 25 mM for the other ions were produced. LysoZn-1 was dissolved in dimethyl sulfoxide (DMSO) at a concentration of 1 mM as the stock solution. Aliquots were diluted to 1 μM with ethanol–10 mM Tris-HCl = 9/1, v/v, pH 7.2 or ethanol–50 mM CH3COOH–CH3COONa = 9/1, v/v, pH 5.0. Slight pH variations in the solutions were achieved by adding the minimum volumes of NaOH or HCl (2 M). 1H-NMR and 13C-NMR spectra were recorded using a VARIAN INOVA-400 spectrometer with chemical shifts (δ) reported in ppm (in CDCl3, TMS as the internal standard). Mass spectrometry data were obtained using an HP1100LC/MSD mass spectrometer and an LC/Q-TOF MS spectrometer. Fluorescence measurements were performed using a VARIAN CARY Eclipse fluorescence spectrophotometer (serial no. FL0812-M018). Excitation and emission slit widths were modified to adjust the fluorescence intensity to a suitable range. Absorption spectra were measured using a Lambda 35 UV/VIS spectrophotometer (Perkin Elmer). All pH measurements were made with a Model PHS-3C meter.
Cell incubation
MCF-7 and Hela cells were cultured in Dulbecco's modified Eagle's medium (Invitrogen) supplemented with 10% fetal bovine serum (Invitrogen). Cells were seeded in 24-well flat-bottomed plates and incubated for 24 h at 37 °C under 5% CO2. LysoZn-1 (1 μM) was added (the concentration of DMSO was maintained to be less than 0.2%) and cells were further incubated for 30 min, followed by washing thrice with phosphate-buffered saline. Fluorescence imaging was performed using an OLYMPUS FV-1000 inverted fluorescence microscope with a 100× objective lens.
Co-localisation experiments
Co-localisation experiments were conducted by co-staining the NSCs, MCF-7 and Hela cells with combinations of LysoZn-1 (1 μM) and LysoSensor™ Green DND-189 (1 μM, Invitrogen) for 30 min. Cofocal fluorescence images collected the emissions at 490–515 nm (LysoSensor Green, λex = 488 nm) and 575–675 nm (LysoZn-1, λex = 559 nm), respectively.
NSCs isolation and culture
E.14 Kunming strain mice (from the Animal Centre, Dalian Medical University, Dalian, China) were, following the procedure approved by the relevant ethical committee, sacrificed by cervical dislocation, and the embryonic forebrain tissues were dissociated for primary culture. The methods were as described in previous literatures.8 Dissected tissue samples were transferred into a 15 mL test tube with 3 mL Dulbecco's modified Eagle's medium (DMEM, Invitrogen, without L-glutamate, glucose, phenol red, sodium pyruvate and sodium bicarbonate) and triturated gently using a Pasteur pipette until the suspension looked cloudy: 20–30 strokes were sufficient. It was allowed to stand for 10 min in ice bath, then the top cell suspension was transferred to another test tube. For the undissociated tissue pieces, 2 mL DMEM culture medium was added and the above step repeated until the cell suspension looked homogeneous. The cell suspensions in the two test tubes were mixed and pelleted by centrifugation at 75g for 5 min, after which the supernatant with much cell debris was discarded. Cells were resuspended in 1 mL serum-free primary culture medium consisting of the DMEM–F12–RPMI1640 mixture (1:1:1) (F12 and RPMI1640, Gibco) supplemented with B27® (Gibco) and 2 mM GlutaMAX™ (Gibco), containing 10 ng mL−1 of basic fibroblast growth factor (bFGF) (PeproTech, Rocky Hill, NJ) and 20 ng mL−1 of epidermal growth factor (EGF) (PeproTech, Rocky Hill, NJ), and counted using a hemocytometer. Then the responded cells were transferred to 75 cm2 T-flask with a seeding density of 5 × 10⁴ viable cells per cm2 in serum-free medium for primary culture. The bFGF and EGF were replenished every three days when 1/4 of the medium was changed, allowing neurospheres to grow at 37 °C in 95% air (21% O2) and 5% CO2 in a humidified chamber until they were about 150 μm. Then neurospheres were harvested by centrifugation at 75g for 3 min and then dissociated with Accutase™ (Sigma, 1×) for 15 min in 37 °C water bath, with gentle shaking of the centrifuge tube. Fresh passage medium, N2 substitute for B27 of the primary culture medium was added to the cells and seeded the cells at a density of 1 × 10⁵ viable cells per cm2 to the 75 cm2 T-flask for passage culture. The passage 3 (P3) NSCs were used for the following analysis.
Cytotoxicity experiments
Cell viability measurements were performed by reducing 3-(4,5-dimethylthiazol-2-y1)-2,5-diphenyltetrazolium bromide (MTT) to formazan crystals. Briefly, MCF-7 cells and NSCs were seeded in 96-well microplates (Nunc, Denmark) at a density of 1 × 10⁵ cells mL−1 in 100 μL of medium containing 10% FBS. After 24 h of cell attachment, the plates were washed with 100 μL per well PBS. The cells were then cultured in a medium with 1 μM LysoZn-1 for 12 h or 24 h. Cells in a culture medium without fluorescent dyes were used as the control. Six replicate wells were used for each control and test concentration. MTT (10 μL, 5 mg mL−1) in PBS was subsequently added to each well. The plates were then incubated at 37 °C for 4 h in a 5% CO2 humidified incubator. The medium was carefully removed, and the purple products were lysed in 200 μL DMSO. The plate was shaken for 10 min, and the absorbance was measured at 405 and 488 nm using a microplate reader (Thermo Fisher Scientific). Cell viability was expressed as a percentage of the control culture value.
Determination of dissociation constant and stoichiometry
The dissociation constant and stoichiometry of LysoZn-1 complexing with Zn2+ was calculated using the method described in ref. 9.
Determination of quantum yields
The fluorescence quantum yields of LysoZn-1 and LysoZn-1 + Zn2+ were determined using the equation10
where ϕ is the fluorescence quantum yield; FA is integrated area under the corrected emission spectrum; A is the absorbance at the excitation wavelength; λex is the excitation wavelength; η is the refractive index of the solution; and the subscripts ‘u’ and ‘s’ refer to the unknown and the standard, respectively. We chose rhodamine B as the standard, which has a fluorescence quantum yield of 0.49 in ethanol.11
Determination of the detection limit
The detection limit was calculated based on the fluorescence titration curve (Fig. S5†) of LysoZn-1 in the presence of Zn2+ (0–10 μM). The fluorescence intensity of LysoZn-1 and the standard deviation of the blank measurement were measured three times. The detection limit was calculated with the following equation:
where σ is the standard deviation of the blank measurement, and k is the slope between the fluorescence intensity and Zn2+ concentrations.
Computational procedures
The charge numbers of atoms on 1 and LysoZn-1 were calculated using density functional theory (DFT) by the B3LYP method with the 6-31g basis set. The absorption and emission spectra of compound 1, LysoZn-1 and their complex with Zn2+ or Cd2+ were calculated using the B3LYP geometries and 6-31g(d,p)/LanL2DZ (for complexes of 1/LysoZn-1 with Cd2+/Zn2+) basis set during the TD-DFT calculations. The calculations were performed using the Gaussian 09 program.
Synthesis
Synthesis of 4-(2-bromoethoxy)benzaldehyde.
4-(2-Bromoethoxy)benzaldehyde was prepared as previously described.12
Synthesis of 2.
To 4-(2-bromoethoxy)benzaldehyde (3 mmol, 687 mg) and 2,4-dimethylpyrrole (6 mmol, 570 mg) in absolute dichloromethane (250 mL), one drop of TFA was added and the mixture was stirred at room temperature for 6 h in the dark (until TLC indicated complete consumption of the aldehyde). The red solution was treated with DDQ (3 mmol, 681 mg), stirring was continued for 1 h followed by the addition of Et3N (6 mL) and BF3·Et2O (10 mL). Then the mixture was stirred for further 1 h. The residue was purified by silica gel column chromatography (hexane–ethyl acetate) to afford 2 (283 mg, 21%). 1H NMR (400 MHz, CDCl3), δ: 1.42 (s, 6H), 2.55 (s, 6H), 3.69 (t, J = 4 Hz, 2H), 4.35 (t, J = 8 Hz, 2H), 5.98 (s, 2H), 7.01 (d, J = 8 Hz, 2H), 7.18 (d, J = 8 Hz, 2H); 13C NMR (100 MHz, CDCl3), δ: 14.6, 28.8, 67.9, 115.3, 121.2, 127.9, 129.4, 131.8, 141.5, 143.1, 155.4, 158.7 ppm; TOF MS: m/z calcd for C21H22BN2OF2NaBr+ [M + Na]+: 469.0874, found: 469.0876.
Synthesis of 3.
To 2 (0.22 mmol, 100 mg) in 10 mL acetonitrile, 2-morpholinoethylamine (2.2 mmol, 291 mg) was added, and the mixture was refluxed for 4 h with vigorous stirring. Then the solvent was removed under reduced pressure. The residue was purified by silica gel column chromatography (dichloromethane–methanol) to afford 3 (90 mg, 88%). 1H NMR (400 MHz, CDCl3), δ: 1.42 (s, 6H), 2.49 (s, 4H), 2.55 (s, 6H), 2.58 (t, J = 8 Hz, 2H), 2.87 (t, J = 8 Hz, 2H), 3.11 (t, J = 8 Hz, 2H), 3.73 (t, J = 4 Hz, 4H), 4.16 (t, J = 8 Hz, 2H), 5.98 (s, 2H), 7.00 (d, J = 8 Hz, 2H), 7.16 (d, J = 8 Hz, 2H); 13C NMR (100 MHz, CDCl3), δ: 14.6, 45.9, 48.7, 53.7, 58.0, 67.0, 67.3, 115.1, 121.1, 127.3, 129.3, 131.8, 141.7, 143.1, 155.3, 159.3 ppm; TOF MS: m/z calcd for C27H36BN4O2F2+ [M + H]+: 497.2899, found: 497.2897.
Synthesis of 4.
4 was prepared as previously described.9
Synthesis of LysoZn-1.
3 (150 mg, 0.3 mmol) and 4 (100 mg, 0.3 mmol) were dissolved in benzene (12 mL). Piperidine (0.35 mL) and acetic acid (0.25 mL) were added to the solution and refluxed for 12 h. The solvent was removed by evaporation, and the residue was purified by silica gel column chromatography (dichloromethane–methanol) to afford LysoZn-1 (48 mg, 20%). 1H-NMR (400 MHz, CDCl3), δ: 1.42 (s, 3H), 1.45 (s, 3H), 2.51 (t, J = 4 Hz, 4H), 2.55 (s, 3H), 2.62 (t, J = 8 Hz, 2H), 2.91 (t, J = 8 Hz, 2H), 3.15 (t, J = 8 Hz, 2H), 3.72 (t, J = 8 Hz, 4H), 4.19 (t, J = 8 Hz, 2H), 4.87 (s, 4H), 5.95 (s, 1H), 6.55 (s, 1H), 6.69 (d, J = 8 Hz, 2 H), 6.99 (d, J = 8 Hz, 2 H), 7.20 (m, 8H), 7.41 (d, J = 8 Hz, 2H), 7.64 (m, 2H), 8.60 (d, J = 4 Hz, 2H); 13C NMR (100 MHz, CDCl3), δ: 11.0, 14.0, 14.1, 14.6, 22.7, 23.0, 23.8, 28.9, 29.4, 29.5, 29.7, 30.4, 31.9, 38.8, 53.1, 57.3, 66.7, 68.2, 70.6, 112.7, 114.8, 120.8, 122.2, 128.8, 129.3, 130.1, 130.9, 132.5, 136.9, 149.8, 158.2, 167.7 ppm; TOF MS: m/z calcd for C46H51BN7O2F2 [M + H]+: 782.4165; Found: 782.4152.
Results and discussion
Design and preparation of LysoZn-1
Di-2-picolylamine (DPA) has been used as the most popular receptor to construct Zn2+ chemosensors.6e However, this kind probe has difficulty in distinguishing Zn2+ from Cd2+ generally, since Cd2+ is in the same group of the periodic table and has similar properties to Zn2+. Based on the HSAB (Hard–Soft Acid–Base) theory,13 the small difference between Zn2+ and Cd2+ is shown as follows: Cd2+ is larger, highly polarizable and categorized as a “soft acid”; Zn2+ is smaller, more compact, with the electrons held fairly tightly by the nucleus and is considered to be comparatively “hard acid”. In our previous work, we reported a fluorescent Cd2+ sensor, 1 (structure seen in Scheme 1), with no response towards Zn2+.9 Because of the low electron density of the tertiary amine nitrogen atom of DPA, it is considered to be a soft base which react preferentially with a soft acid,13 Cd2+. Therefore, we hypothesized that introducing an electron donor (4-ethoxylphenyl) to the BODIPY fluorophore at the meso-position can increase the electron density of the tertiary amine nitrogen atom of DPA, and it would be considered to be comparatively hard base which might react preferentially with Zn2+. Meanwhile, 4-ethoxylphenyl serves as a long linker between the styryl-BODIPY-DPA sensing scaffold and 2-morpholinoethylamine moiety, a known lysosome-targeting group.14
 |
| | Scheme 1 Synthesis of LysoZn-1. | |
The synthetic route tp LysoZn-1 is shown in Scheme 1. Alkylation of 4-hydroxybenzaldehyde with 1,2-dibromoethane yielded 4-(2-bromoethoxy)benzaldehyde12 in 50% yield. BODIPY 2 was synthesised in a one-pot reaction in 21% yield: acid-catalysed condensation of 4-(2-bromoethoxy)benzaldehyde with pyrrole yielded dipyrromethane, which was subsequently oxidised and complexed with boron trifluoride etherate. The coupling of 2 and the lysosome-targeted tag (2-morpholinoethylamine) in acetonitrile produced 3 in 88% yield. Probe LysoZn-1 was synthesised according to the general route9 by condensation of the BODIPY dye 3 with 4-(bis(pyridin-2-ylmethyl)amino)benzaldehyde9 in 20% yield. The structure of LysoZn-1 was confirmed by nuclear magnetic resonance (NMR) (1H, 13C) spectroscopy and mass spectrometry.
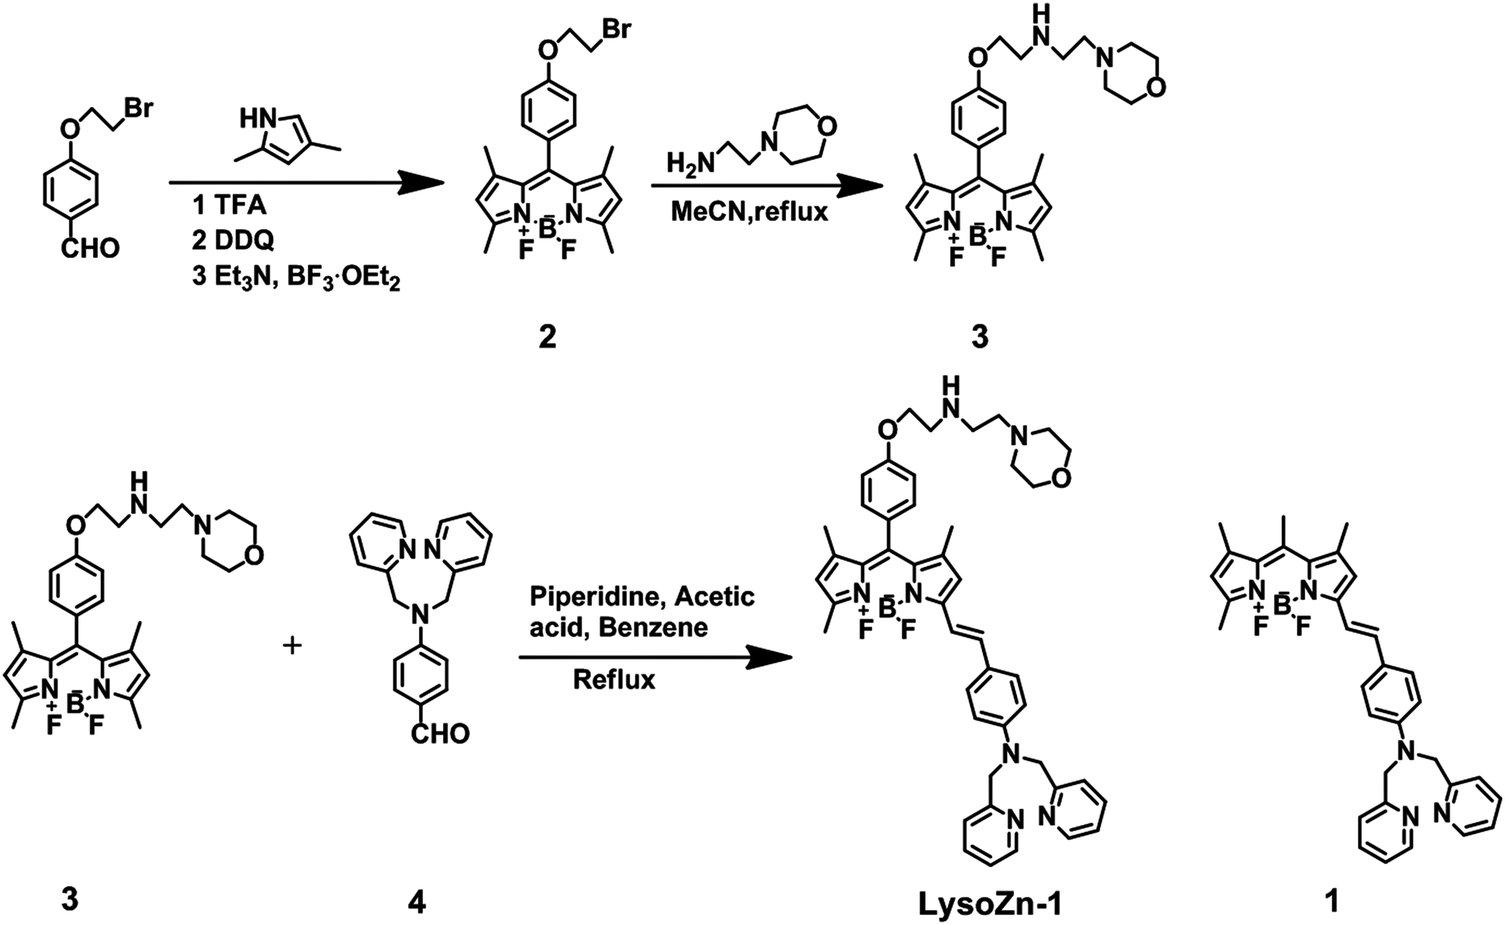
Effect of pH on LysoZn-1
We first measured the effect of pH on the fluorescence properties of LysoZn-1. The macro pKa value of LysoZn-1 was determined to be 3.4 from the sigmoidal curve (Fig. 1). In the pH range from 4.5 to 6.0, the emission intensities of both LysoZn-1 and LysoZn-1 + Zn2+ did not change significantly. The probe titration of LysoZn-1 on H+ was repeated in ethanol–10 mM Tris-HCl = 4/6, v/v, and also evidenced inertness to pH as noticed in Fig. S1.† These results indicate that LysoZn-1 is able to detect Zn2+ levels without proton interference in acidic media. The insensitivity of LysoZn-1 towards protons may be ascribed to its low affinity with all the potential guests including protons. On the other hand, the lysosome-targeting group, 2-morpholinoethylamine, is more basic than the aniline nitrogen; thus, the former is protonated first and protonation of the latter occurs at a lower pH. Tris-HCl and CH3OOH–CH3COONa buffers at pH values of 7.2 and 5.0 respectively were prepared for photophysical measurements.
 |
| | Fig. 1 (a) Effect of pH on the relative emission intensity (F/F0, at 578 nm) of LysoZn-1 in ethanol–10 mM Tris-HCl = 9/1, v/v. (b) Zn2+ detection of LysoZn-1 at various pH values. Excitation wavelength was 545 nm. The concentration of LysoZn-1 was 1 μM. | |
Comparison of Zn2+ and Cd2+ responses by LysoZn-1
Next, we measured the fluorescence responses of LysoZn-1 (1 μM) towards Cd2+ and Zn2+ in ethanol–50 mM CH3COOH–CH3COONa = 9/1, v/v, pH 5.0. Free LysoZn-1 featured a prominent and fairly structureless band centred at 647 nm (ΦF = 0.10) and a small and narrow peak at 578 nm (ΦF = 0.01) upon excitation at 545 nm, which may be assigned to the emission from intramolecular charge transfer (ICT) states and locally excited (LE) states, respectively (Fig. S2,† black line). Then 200 eq. of Cd2+ and Zn2+ were added to the LysoZn-1 solution, respectively. As expected, Zn2+ induced an obvious fluorescence enhancement of LysoZn-1 at 578 nm (Fig. S2,† red line), whereas Cd2+ only induced less than one-tenth of that (Fig. S2,† blue line). The electron densities of the tertiary amine nitrogen atoms of DPA in 1 and LysoZn-1 were calculated using the B3LYP/6-31g(d,p) method from the Gaussian 09 program. The tertiary nitrogen atom in LysoZn-1 (−0.508) is more electronegative than that of 1 (−0.490), as can be seen from Fig. S3.† Moreover, we calculated the absorption and emission spectra of compound 1, LysoZn-1 and their complexes with Zn2+ or Cd2+ using the B3LYP geometries and 6-31g(d,p)/LanL2DZ (for complexes of 1/LysoZn-1 with Cd2+/Zn2+) basis set during the TD-DFT calculations, and compared them with the experimental data. The results in Table 1 show that the computational absorption and emission bands of all compounds showed good consistency with the experimental data. The optimised geometries of the ground state and the excited state for 1, 1 + Cd2+, 1 + Zn2+, LysoZn-1, LysoZn-1 + Cd2+ and LysoZn-1 + Zn2+ were also shown in Fig. S4.† Therefore, we concluded that the introduction of an electron-donating group to DPA-based probes can improve their selectivity towards Zn2+, which may be a good guide for designing highly selective Zn2+ probes which can distinguish Zn2+ from Cd2+.
Table 1 Absorption and emission maxima of probe 1 and LysoZn-1 in the absence and presence of Zn2+/Cd2+
| Compound |
Exptl |
Calcd |
| Abs λmax (nm) |
Em λmax (nm) |
Abs λmax (nm) |
Em λmax (nm) |
|
1
|
Near 600 |
656 |
558 |
663 |
|
1 + Cd2+ |
571 |
597 |
513 |
613 |
|
1 + Zn2+ |
Near 600 |
656 |
554 |
655 |
|
LysoZn-1
|
597 |
647 (major) |
562 |
683 |
|
LysoZn-1 + Cd2+ |
597 |
647, 578 |
573 |
674 |
|
LysoZn-1 + Zn2+ |
568 |
578 |
514 |
618 |
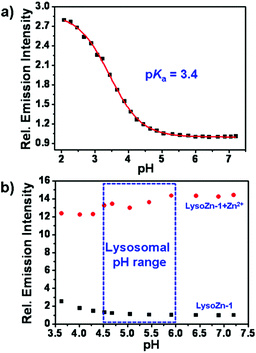
Absorption and fluorescence titration of LysoZn-1 on Zn2+
Then we tested the probe absorption and fluorescence titration of LysoZn-1 on Zn2+. As shown in Fig. 2a, LysoZn-1 in its free form displays an absorption band centered at 597 nm (136000 M−1 cm−1). Gradual addition of Zn2+ to the probe resulted in a decrease at 597 nm and a concomitant increase in a new band at 568 nm (131000 M−1 cm−1) with a distinct isosbestic point at 578 nm. This phenomenon may be explained by density functional theory calculations using the B3LYP/6-31g(d,p) method from the Gaussian 09 program (Fig. S4d and Fig. S4f†). For both LysoZn-1 and LysoZn-1 + Zn2+, HOMO to LUMO transitions represented electron density redistributions from N,N-bis(pyridin-2-ylmethyl)benzenamine to the BODIPY unit, indicating ICT processes between the two units. Furthermore, the energy gap between the HOMO and LUMO of LysoZn-1 (2.37 eV) was smaller than that of LysoZn-1 + Zn2+ (2.55 eV), which agrees well with blue shift in absorption observed upon treatment of LysoZn-1 with Zn2+. In terms of fluorescence emission, addition of Zn2+ at low concentrations ranging from 0 to 10 μM caused a gradual increase in the LE emission at 578 nm and a decrease in ICT emission at 647 nm with an isoemission point at 602 nm, indicating transfers from ICT to LE states (Fig. S5a†). The fluorescence intensity ratio (F578nm/F647nm) of LysoZn-1 was linearly proportional (R = 0.9894) to the Zn2+ concentration ranging from 0 to 10 μM (Fig. S5b†), confirming that LysoZn-1 is capable of detecting Zn2+ both qualitatively and quantitatively. The detection limit was calculated as 4.8 × 10⁻⁷ M (3σ).15 Continuous addition of Zn2+ (20–500 μM) to LysoZn-1 caused a significant increase in the shorter wavelength band (LE emission) at 578 nm with a quantum yield of 0.23 and the blue-shift of the ICT band to 635 nm as a shoulder peak (Fig. 2b). A well-defined isoemission point at 645 nm was also observed. The emission intensity at 578 nm (F578nm, Fig. S6†) and the intensity ratio, R (F578nm/F680nm, Fig. S7†) increased upon the gradual addition of Zn2+ concentrations ranging from 10−6 to 10−4 M, thus allowing Zn2+ detection by both ratiometric and normal turn-on fluorescence methods. From the sigmoidal curves in Fig. S6 and Fig. S7,† dissociation constants of the LysoZn-1 + Zn2+ complex were determined to be (6.8 ± 0.4) × 10−5 M (turn-on at 578 nm) and (12.3 ± 0.6) × 10−5 M (ratio of F578nm/F680nm), respectively, suggesting that LysoZn-1 has micromolar affinity towards Zn2+ and is suitable for the detection of high zinc levels in neurons. The fluorescence responses in both methods fit a Hill coefficient of nearly 1.0 (Fig. S8 and Fig. S9†), consistent with the formation of a 1:1 stoichiometry in the LysoZn-1 + Zn2+ complex. Fluorimetric titration of LysoZn-1 towards different Zn2+ concentrations was also carried out in acidic media (ethanol–50 mM CH3COOH–CH3COONa = 9/1, v/v, pH 5.0), as shown in Fig. S10,† with results showing no obvious difference from those in neutral solution (Fig. 2b). The dissociation constants of the LysoZn-1 + Zn2+ complex were also measured in acidic solutions (pH 4.7) to be (8.1 ± 0.9) × 10−5 M (turn-on at 578 nm, Fig. S11†) and (16.0 ± 0.7) × 10−5 M (ratio of F578nm/F680nm, Fig. S12†), respectively. LysoZn-1 can respond to changes in Zn2+ concentration and fluorescence intensity saturation within several seconds (Fig. S13†), which is vital for the real-time detection of Zn2+.
 |
| | Fig. 2 Absorption (a) and fluorescence (b) spectra of 1 μM LysoZn-1 upon the titration of Zn2+ (0, 20, 30, 40, 50, 70, 90, 100, 120, 140, 150, 170, 190, 200, 250, 300, 400, 500 and 800 μM) in ethanol–10 mM Tris-HCl = 9/1, v/v, pH 7.2. | |
Selectivity of LysoZn-1
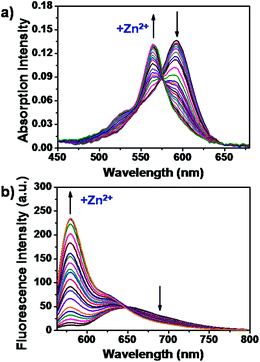
High selectivity towards the analyte over potentially competing species is an essential feature for probes. Changes in fluorescence intensity caused by LysoZn-1 in the presence of Zn2+ and other competitive cations are recorded in Fig. 3 and Fig. S14.† Major biologically relevant metal cations, such as Ca2+, Fe3+, K+, Mg2+ and Na+ and did not give any responses at 200-fold excess concentrations. Other alkaline-earth metal ions and heavy and transition metal ions, including Ag+, Ba2+, Co2+, Cr3+, Cu+, Hg2+, Mn2+, Ni2+ and Pb2+ also showed no obvious interference. Various common anions (Br−, CH3COO−, Cl−, ClO−, ClO4−, CO32−, HPO42−, H2PO4−, I−, NO3−, and S2−) exhibited negligible interference with LysoZn-1 activity (Fig. S15 and Fig. S16†). Competition experiments of Zn2+ mixed with the aforementioned ions showed no significant variation in the emission intensity of LysoZn-1 + Zn2+. H2PO4− and HPO42− quenched some of the fluorescence of LysoZn-1 + Zn2+, which is ascribed to the high affinity of phosphates towards Zn2+.16 These properties indicate that LysoZn-1 is a potentially selective probe for intracellular Zn2+ imaging.
 |
| | Fig. 3 Fluorescence responses of LysoZn-1 (1 μM) towards 200 μM various cations in ethanol–50 mM CH3COOH–CH3COONa = 9/1, v/v, pH 5.0. From right to left: Ag+, Ba2+, Ca2+, Cd2+, Cu+, Co2+, Cr3+, Fe3+, Hg2+, K+, Mg2+, Mn2+, Na+, Ni2+, Pb2+, Zn2+. Excitation wavelength was 545 nm. Black bars represent the relative emission intensity (F/F0, at 578 nm) of LysoZn-1 + ions; light gray bars represent the fluorescence intensity of LysoZn-1 + Zn2+ in the presence of other ions. | |
Lysosome staining in living cells
With spectroscopic data establishing that LysoZn-1 can selectively respond to Zn2+, we then evaluated LysoZn-1 in live-cell imaging assays. Stem cells are a subject of intense and increasing interest because of their biological properties and potential medical importance.17 Multicellular organisms are formed from a single totipotent stem cell. Neural stem cells (NSCs) are a subtype of progenitor cells in the nervous system that can self-renew and generate both neurons and glia.18 In this study, we chose NSCs and common cancer cells (Hela and MCF-7 cells) as model cell lines. NSCs were prepared from the embryonic forebrain tissues. After incubating NSCs, Hela and MCF-7 cells with 1 μM LysoZn-1 for 30 min at 37 °C, LysoZn-1 was found to penetrate through the cell membrane and stain the cells with observable punctate fluorescence near perinuclear regions at the red emission channel (575 nm to 675 nm). We further determined the subcellular distribution of LysoZn-1 by incubating it with the commercial dye LysoSensor Green DND-189, a commercial probe for acidic organelles that has good separation in excitation and emission spectra with LysoZn-1. Fig. 4 shows that the distribution of LysoZn-1 is nearly identical to that of LysoSensor Green in all three cell lines. Co-localisations were quantified using Pearson's sample correlation factors (Rr). Co-localisation of LysoZn-1 with LysoSensor Green was observed in 98% of the NSCs, 97% of the MCF-7 cells and 96% of the Hela cells, suggesting that LysoZn-1 selectively stains acidic organelles such as lysosomes in living cells.
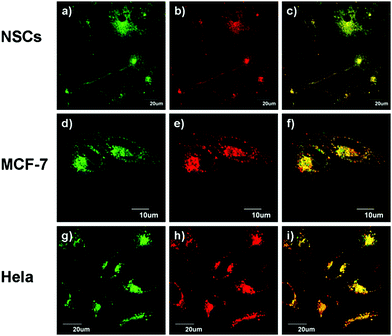 |
| | Fig. 4
LysoZn-1 co-localises to lysosomes in NSCs (a–c), MCF-7 (d–f) and Hela (g–i) cells. Cells were stained with 1 μM LysoSensor Green (a, d and g), and 1 μM LysoZn-1 (b, e and h). (c, f and i) Overlap of (a) and (b), (d) and (e), (g) and (h), respectively. The excitation wavelengths were 488 nm (LysoSensor Green) and 559 nm (LysoZn-1). The fluorescence was collected at 490–515 nm (LysoSensor Green) and 575–675 nm (LysoZn-1). | |
Influence of chloroquine on LysoZn-1 function in living cells
Next, we tested whether or not the fluorescence ratio signals of LysoZn-1 can be influenced by lysosomal pH changes in living cells. Weakly basic substances can cause the leakage of protons out of lysosomes in the form of protonated bases and the concentration of chloroquine required to increase the lysosomal pH is considerably lower than that of other weak bases.19 NSCs and MCF-7 cells were stained with 1 μM LysoZn-1 for 30 min at 37 °C and subsequently imaged by confocal microscopy (Fig. 5a–5g and Fig. S17a–17g†). Fluorescence ratio images (F575–620nm/F655–755nm) were recorded after the addition of chloroquine at different time points, as shown in Fig. 5i and Fig. S17i.† To determine the ratios of each image, 11 areas in the image were chosen to represent the lysosomal regions of the cell. The values obtained for each case were subsequently averaged. As expected, the emission ratios of LysoZn-1 showed no substantial changes after chloroquine treatment of both NSCs and MCF-7 cells for 30 min. Thus, we believe that LysoZn-1 is a proton-insensitive probe that may sense analytes without proton interference in lysosomes of living cells.
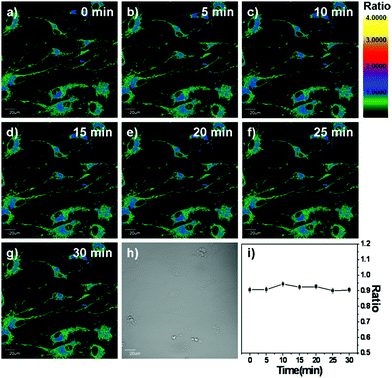 |
| | Fig. 5 Fluorescence ratio images (F575–620nm/F655–755nm) of LysoZn-1 (1 μM) labelled NSCs in the presence of 100 μM chloroquine at different time points: (a) 0; (b) 5; (c) 10; (d) 15; (e) 20; (f) 25; and (g) 30 min. Excitation wavelength is 559 nm. (h) Bright field image. (i) Plot of the emission ratio as a function of time after chloroquine was added. The ratio values are extracted from 11 regions of each image; error bars are ±sem. | |
Ratiometric imaging of exogenous or endogenous Zn2+ in NSCs
As a result of the above, we investigated the ability of LysoZn-1 to detect lysosomal zinc levels in living cells by dual-emission ratiometric imaging. Confocal microscopy of NSCs incubated with 1 μM LysoZn-1 at 37 °C for 30 min showed clear fluorescence at dual-emission channels ranging from 575 nm to 620 nm (green) and from 655 nm to 755 nm (red) excited at 559 nm. The background ratio of Fgreen/Fred gave an average value of 1.11 ± 0.02, indicating a low labile Zn2+ level in lysosomes. By treating the cells with exogenous Zn2+ for 10 min, the emission ratio rose (1.29 ± 0.03, 1.48 ± 0.02 and 1.74 ± 0.01) as the Zn2+ concentration was increased (10, 20 and 50 μM), as shown in Fig. S18.† At 20 μM Zn2+ (Fig. 6), treatment with the membrane-permeable metal ion chelator N,N,N′,N′-tetrakis(2-pyridylmethyl)ethylenediamine (TPEN, 20 μM) for 10 min reduced the emission ratio significantly, implying that the reversed Zn2+ level in lysosomes and changes in the emission ratio of LysoZn-1 depend upon lysosomal Zn2+ fluctuations. Under identical experimental conditions, we obtained similar results in MCF-7 cells (Fig. S19 and Fig. S20†).
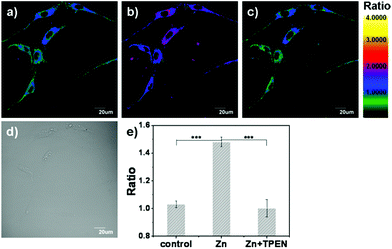 |
| | Fig. 6 (a) Fluorescence ratio images (F575–620nm/F655–755nm) of NSCs incubated with 1 μM LysoZn-1 for 30 min; (b) following a 10 min treatment of Zn2+ (20 μM); (c) fluorescence ratio images of cells in (b) treated further by TPEN solution (20 μM, 10 min); (d) bright field image; (e) statistical analyses were performed with One-Way ANOVA (n = 9 fields of cells). ***P < 0.001, and error bars are ±sem. Excitation wavelength is 559 nm. | |
Zinc overload in lysosomes and lysosomal disruption are key events in oxidative neuronal death.20 The salient features of this mechanism are as follows: under conditions in which cells are exposed to oxidative stress, MTs may serve as zinc-donors, raising free zinc levels in lysosomes.21 Next, a substantial fraction of zinc-laden lysosomes undergo membrane disintegration. Finally, hippocampal neuronal death occurs in a zinc-dependent manner.20 After establishing that LysoZn-1 can monitor the lysosomal zinc level changes in NSCs, we used this new chemical tool to characterise lysosomal Zn2+ homeostasis under oxidative stress. As shown in Fig. 7, dual-emission ratiometric imaging of the cells with LysoZn-1 demonstrated that the ratio of F575–620nm/F655–755nm was 0.69 ± 0.02 before H2O2 exposure. Ratio values increased after treatment with 100 μM H2O2 and reached 1.32 ± 0.02 (P < 0.001, n = 9) after 30 min, demonstrating intracellular-stored Zn2+ release under oxidative stress. Subsequent TPEN treatment induced a rapid reduction in emission ratio (decreasing to 0.80 ± 0.02, P < 0.001, n = 9). Considering that H2O2 is a strong oxidant which may have a chemical effect on the present probe, we measured the fluorescence spectra of LysoZn-1 in the absence and presence of 1 mM H2O2 in acidic solutions. Fig. S21† showed that H2O2 had no influence on the fluorescence of LysoZn-1, suggesting that the increase in ratio depends upon lysosomal Zn2+ changes. All these data establish that LysoZn-1 can reversibly respond to changes in endogenous lysosomal Zn2+ levels in NSCs upon H2O2 stimulation. The experiment was carried out in MCF-7 cells under the same conditions. At 100 μM H2O2, notable ratio changes in LysoZn-1-labelled MCF-7 cells (data not shown) were not induced, which may be due to the lower level of stored Zn2+ in common cancer cells compared with neurons.
 |
| | Fig. 7 (a) Fluorescence ratio images (F575–620nm/F655–755nm) of NSCs incubated with 1 μM LysoZn-1 for 30 min; (b) following a 30 min treatment of H2O2 (100 μM); (c) fluorescence ratio images of cells in (b) treated further by TPEN solution (20 μM, 10 min); (d) bright field image; (e) statistical analyses were performed with One-Way ANOVA (n = 9 fields of cells). ***P < 0.001, and error bars are ±sem. Excitation wavelength is 559 nm. | |
Cytotoxicity
The cytotoxicity of LysoZn-1 to MCF-7 cells and NSCs was evaluated via MTT tests. Fig. S22† shows that after 24 h of cellular internalisation of 1 μM probe, more than 80% of the cells remained viable. This result indicates the low cytotoxicity of LysoZn-1 to living cells under the experimental conditions.
Conclusions
In summary, we have described the synthesis, properties and biological applications of LysoZn-1. LysoZn-1 is a Zn2+-specific, small-molecule fluorescent indicator that features visible excitation and emission profiles, a ratiometric and turn-on response as well as high selectivity for Zn2+ over other potentially competing species. Through Gaussian calculation, we confirmed that the electron donor at the meso-position of the BODIPY fluorophore in LysoZn-1 is an important factor for complexing preferentially with Zn2+ rather than Cd2+. LysoZn-1 can be easily loaded into lysosomes of NSCs, MCF-7 and Hela cells. The fluorescence ratio of the LysoZn-1 remained almost constant in the presence of chloroquine. Thus, LysoZn-1 can reliably detect labile Zn2+ changes in the presence of exogenous or endogenous (H2O2 stimulation) Zn2+ in NSCs via dual-emission ratiometric imaging. Since the role of zinc in autophagy and/or lysosomal function has just begun to be investigated20 and in light of evidence that autophagy and lysosomes have significant functions in the pathogenesis of various neurological diseases, LysoZn-1 appears to be a useful tool for obtaining further insights into the contribution of zinc dynamics in brain cells.
Acknowledgements
This work was financially supported by NSF of China (21136002, 20923006, 21222605, 21272030, and 21076032), National Basic Research Program of China (2009CB724706 and 2013CB733702), National High Technology Research and Development Program of China (863 Program, 2011AA02A105), and the State Key Laboratory of Fine Chemicals (KF1111).
Notes and references
- C. J. Frederickson, J.-Y. Koh and A. I. Bush, Nat. Rev. Neurosci., 2005, 6, 449 CrossRef CAS PubMed.
- C. J. Frederickson, Int. Rev. Neurobiol., 1989, 31, 145 CrossRef CAS PubMed.
- J. J. Hwang, S.-J. Lee, T.-Y. Kim, J.-H. Cho and J.-Y. Koh, J. Neurosci., 2008, 28, 3114 CrossRef CAS PubMed.
- J. P. Luzio, P. R. Pryor and N. A. Bright, Nat. Rev. Mol. Cell Biol., 2007, 8, 622 CrossRef CAS PubMed.
-
(a) K. S. Aboody, A. Brown, N. G. Rainov, K. A. Bower, S. Liu, W. Yang, J. E. Small, U. Herrlinger, V. Ourednik, P. M. Black, X. O. Breakefield and E. Y. Snyder, Proc. Natl. Acad. Sci. U. S. A., 2000, 97, 12846 CrossRef CAS PubMed;
(b) D. E. Bredesen, Ann. Neurol., 1995, 38, 839 CrossRef CAS PubMed;
(c) E. Y. Snyder, C. Yoon, J. D. Flax and J. D. Macklis, Proc. Natl. Acad. Sci. U. S. A., 1997, 94, 11663 CrossRef CAS PubMed.
-
(a) E. Kimura and S. Aoki, BioMetals, 2001, 14, 191 CrossRef CAS PubMed;
(b) P. Jiang and Z. Guo, Coord. Chem. Rev., 2004, 248, 205 CrossRef CAS;
(c) P. Carol, S. Sreejith and A. Ajayaghosh, Chem.–Asian J., 2007, 2, 338 CrossRef CAS PubMed;
(d) E. L. Que, D. W. Domaille and C. J. Chang, Chem. Rev., 2008, 108, 1517 CrossRef CAS PubMed;
(e) Z. Xu, J. Yoon and D. R. Spring, Chem. Soc. Rev., 2010, 39, 1996 RSC;
(f) E. M. Nolan, J. Jaworski, K.-I. Okamoto, Y. Hayashi, M. Sheng and S. J. Lippard, J. Am. Chem. Soc., 2005, 127, 16812 CrossRef CAS PubMed;
(g) N. Y. Baek, C. H. Heo, C. S. Lim, G. Masanta, B. R. Cho and H. M. Kim, Chem. Commun., 2012, 48, 4546 RSC;
(h) P. J. Dittmer, J. G. Miranda, J. A. Gorski and A. E. Palmer, J. Biol. Chem., 2009, 284, 16289 CrossRef CAS PubMed;
(i) S. Iyoshi, M. Taki and Y. Yamamoto, Org. Lett., 2011, 13, 4558 CrossRef CAS PubMed;
(j) Z. Liu, C. Zhang, Y. Chen, W. He and Z. Guo, Chem. Commun., 2012, 48, 8365 RSC;
(k) G. Masanta, C. S. Lim, H. J. Kim, J. H. Han, H. M. Kim and B. R. Cho, J. Am. Chem. Soc., 2011, 133, 5698 CrossRef CAS PubMed;
(l) Y. Qin, P. J. Dittmer, J. G. Park, K. B. Jansen and A. E. Palmer, Proc. Natl. Acad. Sci. U. S. A., 2011, 108, 7351 CrossRef CAS PubMed;
(m) S. L. Sensi, D. Ton-That, J. H. Weiss, A. Rothe and K. R. Gee, Cell Calcium, 2003, 34, 281 CrossRef CAS PubMed;
(n) K. Sreenath, J. R. Allen, M. W. Davidson and L. Zhu, Chem. Commun., 2011, 47, 11730 RSC;
(o) E. Tomat, E. M. Nolan, J. Jaworski and S. J. Lippard, J. Am. Chem. Soc., 2008, 130, 15776 CrossRef CAS PubMed;
(p) J. L. Vinkenborg, T. J. Nicolson, E. A. Bellomo, M. S. Koay, G. A. Rutter and M. Merkx, Nat. Methods, 2009, 6, 737 CrossRef CAS PubMed;
(q) L. Xue, G. Li, C. Yu and H. Jiang, Chem.–Eur. J., 2012, 18, 1050 CrossRef CAS PubMed;
(r) L. Xue, G. Li, D. Zhu, Q. Liu and H. Jiang, Inorg. Chem., 2012, 51, 10842 CrossRef CAS PubMed.
-
(a) Y. Xiang and A. Tong, Luminescence, 2008, 23, 28 CrossRef CAS PubMed;
(b) K. W. Dunn, S. Mayor, J. N. Myers and F. R. Maxfield, FASEB J., 1994, 8, 573 CAS.
-
(a) B. A. Reynolds and S. Weiss, Dev. Biol., 1996, 175, 1 CrossRef CAS PubMed;
(b) C. N. Svendsen, M. G. ter Borg, R. J. E. Armstrong, A. E. Rosser, S. Chandran, T. Ostenfeld and M. A. Caldwell, J. Neurosci. Methods, 1998, 85, 141 CrossRef CAS PubMed;
(c) J. Cai, Y. Wu, T. Mirua, J. L. Pierce, M. T. Lucero, K. H. Albertine, G. J. Spangrude and M. S. Rao, Dev. Biol., 2002, 251, 221 CrossRef CAS PubMed.
- X. Peng, J. Du, J. Fan, J. Wang, Y. Wu, J. Zhao, S. Sun and T. Xu, J. Am. Chem. Soc., 2007, 129, 1500 CrossRef CAS PubMed.
- T. Karstens and K. Kobs, J. Phys. Chem., 1980, 84, 1871 CrossRef CAS.
- K. G. Casey and E. L. Quitevis, J. Phys. Chem., 1988, 92, 6590 CrossRef CAS.
- E. Deniz, S. Ray, M. Tomasulo, S. Impellizzeri, S. Sortino and F. M. Raymo, J. Phys. Chem. A, 2010, 114, 11567–11575 CrossRef CAS PubMed.
- R. G. Pearson, J. Am. Chem. Soc., 1963, 85, 3533 CrossRef CAS.
-
R. P. Haugland, A Guide to Fluorescent Probes and Labeling Technologies, 2005, p. 580 Search PubMed.
- B. Zhu, C. Gao, Y. Zhao, C. Liu, Y. Li, Q. Wei, Z. Ma, B. Du and X. Zhang, Chem. Commun., 2011, 47, 8656 RSC.
-
(a) A. Ojida, H. Nonaka, Y. Miyahara, S.-i. Tamaru, K. Sada and I. Hamachi, Angew. Chem., Int. Ed., 2006, 45, 5518 CrossRef CAS PubMed;
(b) H. N. Lee, Z. Xu, S. K. Kim, K. M. K. Swamy, Y. Kim, S.-J. Kim and J. Yoon, J. Am. Chem. Soc., 2007, 129, 3828 CrossRef CAS PubMed;
(c) H.-W. Rhee, H.-Y. Choi, K. Han and J.-I. Hong, J. Am. Chem. Soc., 2007, 129, 4524 CrossRef CAS PubMed;
(d) D. H. Lee, S. Y. Kim and J.-I. Hong, Angew. Chem., Int. Ed., 2004, 43, 4777 CrossRef CAS PubMed;
(e) H.-W. Rhee, C.-R. Lee, S.-H. Cho, M.-R. Song, M. Cashel, H. E. Choy, Y.-J. Seok and J.-I. Hong, J. Am. Chem. Soc., 2008, 130, 784 CrossRef CAS PubMed.
- S. J. Morrison, N. M. Shah and D. J. Anderson, Cell, 1997, 88, 287 CrossRef CAS PubMed.
- S. Temple, Nature, 2001, 414, 112 CrossRef CAS PubMed.
- B. Poole and S. Ohkuma, J. Cell Biol., 1981, 90, 665 CrossRef CAS PubMed.
- S.-J. Lee and J.-Y. Koh, Mol. Brain Res., 2010, 3, 30 CrossRef PubMed.
- R. S. Chung, S. J. Fung, Y. K. Leung, A. K. Walker, G. H. McCormack, M. I. Chuah, J. C. Vickers and A. K. West, Cell. Mol. Life Sci., 2007, 64, 2716 CrossRef CAS PubMed.
Footnote |
| † Electronic supplementary information (ESI) available: Characterisation data for compound 2, 3 and LysoZn-1, computational results, additional spectroscopic data, MTT results and LysoZn-1 sensing Zn2+ in MCF-7 cells. See DOI: 10.1039/c3bm60186b |
|
| This journal is © The Royal Society of Chemistry 2014 |
Click here to see how this site uses Cookies. View our privacy policy here.