
 Open Access Article
 This Open Access Article is licensed under a
 Creative Commons Attribution 3.0 Unported Licence
Comparison of different characterization methods for nanoparticle dispersions before and after aerosolization
Heinz
Fissan
*ab,
Simon
Ristig
c,
Heinz
Kaminski
a,
Christof
Asbach
a and
Matthias
Epple
bc
aInstitut für Energie- und Umwelttechnik e.V. (IUTA), Bliersheimer Str. 58-60, D-47229 Duisburg, Germany. E-mail: heinz.fissan@uni-due.de; Fax: +49 2833 572775; Tel: +49 2833 4689
bCenter for Nanointegration Duisburg-Essen (CeNIDE), University of Duisburg-Essen, Carl-Benz-Straße 199, D-47057 Essen, Germany. Tel: +49 203 379 8180
cInorganic Chemistry, University of Duisburg-Essen, Universitaetsstr. 5-7, D-45117 Essen, Germany
First published on 15th July 2014
Abstract
A well-known and accepted aerosol measurement technique, the scanning mobility particle sizer (SMPS), is applied to characterize colloidally dispersed nanoparticles. To achieve a transfer from dispersed particles to aerosolized particles, a newly developed nebulizer (N) is used that, unlike commonly used atomizers, produces significantly smaller droplets and therefore reduces the problem of the formation of residual particles. The capabilities of this new instrument combination (N + SMPS) for the analysis of dispersions were investigated, using three different dispersions, i.e. gold–PVP nanoparticles (∼20 nm), silver–PVP nanoparticles (∼70 nm) and their 1![[thin space (1/6-em)]](https://www.rsc.org/images/entities/char_2009.gif) :1 (m:m) mixture. The results are compared to scanning electron microscopy (SEM) measurements and two frequently applied techniques for characterizing colloidal systems: Dynamic light scattering (DLS) and analytical disc centrifugation (ADC). The differences, advantages and disadvantages of each method are discussed, especially with respect to the size resolution of the techniques and their ability to distinguish the particle sizes of the mixed dispersion. While DLS is, as expected, unable to resolve the binary dispersion, SEM, ADC and SMPS are able to give quantitative information on the two particle sizes. However, while the high-resolving ADC is limited due to the dependency on a predefined density of the investigated system, the transfer of dispersed particles into an aerosol and subsequent analysis with SMPS are an adequate way to characterize binary systems, independent of the density of concerned particles, but matching the high resolution of the ADC. We show that it is possible to use the well-established aerosol measurement technique (N + SMPS) in colloid science with all its advantages concerning size resolution and accuracy.
:1 (m:m) mixture. The results are compared to scanning electron microscopy (SEM) measurements and two frequently applied techniques for characterizing colloidal systems: Dynamic light scattering (DLS) and analytical disc centrifugation (ADC). The differences, advantages and disadvantages of each method are discussed, especially with respect to the size resolution of the techniques and their ability to distinguish the particle sizes of the mixed dispersion. While DLS is, as expected, unable to resolve the binary dispersion, SEM, ADC and SMPS are able to give quantitative information on the two particle sizes. However, while the high-resolving ADC is limited due to the dependency on a predefined density of the investigated system, the transfer of dispersed particles into an aerosol and subsequent analysis with SMPS are an adequate way to characterize binary systems, independent of the density of concerned particles, but matching the high resolution of the ADC. We show that it is possible to use the well-established aerosol measurement technique (N + SMPS) in colloid science with all its advantages concerning size resolution and accuracy.
1. Introduction
Engineered nanoparticles (ENP) can be synthesized in gases (aerosols)1 and liquids (dispersions)2 and introduced into solids (solid nanostructured materials; composites). Here we consider only ENPs in the liquid and gas phases, which often occur in one process chain for producing nanostructured materials. The ENPs in the gas phase are often transferred into the liquid phase shortly after synthesis to avoid agglomeration and to reduce the potential release of ENPs into the environment (air) mainly during handling. This increases the importance of liquid phase ENPs. During transfer from the gas phase into the liquid phase and vice versa, property changes of the ENPs may occur. To control the performance of such processes, among other things the input aerosol as well as the produced dispersions have to be characterized. Up to now, different techniques with different limitations are used with sometimes incomparable results. The use of identical measurement principles for particles in different media is hence preferable in order to avoid discrepancies in the measured results.The sizes of single ENPs and the structure of agglomerated or aggregated ENPs are of great importance for the properties of the end products1 and also after release for their behaviour in the environment.3–5 To adjust the properties of the produced materials to the desired properties by introducing ENPs, the properties, mainly size and structure, of the produced ENPs have to be controlled during synthesis and handling. Size distributions of the ENPs are of great importance and have to be measured at different points of the production chain in the different material phases. Different techniques for gaseous and liquid matrix phases have been developed and used. A cross-over between liquid phase and gas phase occurs when dispersions are sprayed to aerosolize the particles in order to measure them with aerosol measurement techniques. This is done mainly for aerosol instrument calibration with respect to size (monodisperse) and structure (spherical) using well-defined latex6 and other dispersions (e.g. SiO2).7 The very same processes can be used to characterize ENPs in dispersions. Making use of aerosol measurement technologies, here with the Scanning Mobility Particle Sizer (SMPS), in combination with appropriate spraying devices for the characterization of dispersions may have advantages and may be used in colloid research and in dispersion control. For aerosolization, we have used here a newly developed nebulizer (N; TSI Inc., prototype model 3485). We applied this technique to different dispersions and compared the measurement results mainly with results of the analytical disc centrifuge (ADC) used for direct dispersion analysis thus far. Mainly size and size resolution comparisons were performed. This is the basis for a discussion of the advantages, but also the limitations of (N + SMPS) to characterize dispersions.
Besides well-defined latex and SiO2 particles used as standards for calibration, we used nearly monodisperse spherical metallic nanoparticles. Metallic nanoparticles are of great importance in current materials research, with potential applications in biomedicine, energy conversion, imaging, or as pigments.8 Their size plays a critical role, because it influences their physical and biological properties. In a dispersion (typically in water), two cases must be clearly distinguished. In the first case, the dispersed material may consist of agglomerated nanoparticles with effective agglomerate diameters in the micrometer range; in the second case, which is valid here, the dispersed material may consist of individual particles having a diameter in the nanometer range. The average particle size and the particle size distribution are important parameters to characterize dispersions of metallic nanoparticles which are usually not perfectly monodisperse and often consist of several distributions. For a given synthetic product, size distribution data are usually presented in the literature, but very often only electron microscopic images are shown which represent only an extremely small fraction of the entire sample and may not be representative.8 The dispersion has to be dried before analysis. This may cause changes in the agglomeration state of the ENPs. Another practical disadvantage is that we deal with an off-line technique, which is not very suitable for process and product control. Nevertheless, it is a technique directly related to the basic quantity length. Therefore it is often used as a reference method for other indirect methods, such as the ones considered here which allow size distribution determination in situ and at least quasi-online.
The concentration measures of interest are number, surface area and mass (volume) concentrations as a function of particle size. Besides instruments measuring one of these quantities more or less directly (for example a particle counter for number concentration performing single particle counting), others are measuring indirect quantities (e.g. scattered light of an ensemble of particles, to derive the number concentration by a calibration curve). There are several different size definitions of interest. Particle mass or volume-related effects ask for the volume (mass) per particle as a size indicator. The surface area per particle is less frequently used as size indicator, although it is an important parameter for describing interface effects (catalysis and sensor technology). Very popular are equivalent sizes described as a diameter of a sphere, which shows the same behaviour as the (non-spherical) particle, which may be an agglomerate or aggregate in the physical process used for measurement. For instance the electrical mobility diameter is of great importance in aerosol characterization, because popular sizing instruments (SMPS and others) for gas-borne particles make use of the size-dependent transport of charged particles in an electric field.9,10 For a size distribution, both quantities, i.e. concentration measure and size have to be calibrated or a validated model has to exist to allow the transformation of the measured signals into the desired concentration measure and geometrical size. This is especially true if structural information shall be obtained for non-spherical particles, e.g. agglomerates and aggregates.11 It is necessary for measurement techniques for both material systems, i.e. aerosols and dispersions.
Mahl et al. (2011)8 made a comparative study of several measurement techniques used for the characterization of dispersions. They investigated dispersions with nearly monodisperse spherical silver nanoparticles (∼70 nm), gold nanoparticles (∼15 nm) and their 1:1 (m:m) mixtures stabilized with poly(N-vinylpyrrolidone) (PVP). These dispersions were characterized with different techniques: scanning electron microscopy (SEM), transmission electron microscopy (TEM), dynamic light scattering (DLS), analytical disc centrifugation (ADC; also denoted as differential centrifugal sedimentation, DCS), and nanoparticle tracking analysis (NTA). The limitations of the measurement techniques were discussed. The main task was to find out whether the different techniques generate comparable results with respect to particle size. Furthermore it was investigated how the size distribution data for the mixture compares to those of the individual particles, and whether the methods are able to differentiate between small and large metallic nanoparticles in the mixture. For 1:1 mixtures, only SEM and ADC were able to give (semi-)quantitative data on the bimodal size distribution. A literature review about other comparative studies of these techniques is also given by Mahl et al.8
Size distributions of aerosols in the submicron size range can be determined with diffusion batteries,12 low pressure cascade impactors,13 and electrical mobility spectrometers. The most popular electrical mobility spectrometer is the scanning mobility particle sizer (SMPS),9 which is commercially available in different forms. The SMPS measures in real-time with high size resolution. This technique has been chosen in our study for the comparison with the frequently used methods DLS and ADC because of its high size resolution capacity and proven high sizing accuracy.14,15 The necessary transformation of the dispersion into an aerosol can be accomplished by spraying the liquid in a way such that each droplet formed contains no more than a single particle. For this purpose, techniques like electrospray16 or more recently, a tailored nebulizer have been developed which produce very small droplets in order to minimize interference from non-volatile residue. It is very well known that even ultra-pure water still contains dissolved materials that crystallize upon drying of the droplets to form small particles.17,23 Assuming that the nanoparticles are not changed significantly during the spray process, the resulting distributions are compared with the distributions resulting from the direct measurements of the dispersion with DLS and ADC. Similar to Mahl et al.8 we concentrate on the sizing comparability. Errors in the concentration measures and their effects on the comparability of the measured size distributions are not discussed in detail.
The goal is to demonstrate the possibilities of aerosol measurement techniques in dispersion analysis and to identify the advantages and disadvantages of using aerosol measurement technology for the characterisation of dispersions. In our study we follow the approach taken by Mahl et al.8 with respect to the investigated samples. We also use gold and silver nanoparticles and their 1:1 (m:m) mixture. For these investigations, metallic nanoparticles are useful because of their physical properties. The particles have solid cores that do not swell, shrink or change their morphology. The relatively high density benefits the analytical disc centrifuge measurements, while the electronic and optical density is helpful for light scattering and SEM. We chose gold and silver nanoparticles, as they form stable dispersions in water, are easily prepared and frequently cited in the literature for applications in biomedicine, imaging or catalysis. To conduct the experiments, we prepared samples of spherical poly(vinylpyrrolidone)-coated gold (about 20 nm) and silver (about 70 nm) nanoparticles and a 1:1 (m:m) mixture of both samples.
2. Materials and methods
PVP-functionalized silver and gold nanoparticles were synthesized by a modified Turkevich method as reported earlier.8,18 For purification, the particles were separated from the reaction solution by ultracentrifugation (30 min at 66000g) and redispersed in ultrapure water. This procedure was repeated twice. With the single gold and silver dispersions, a 1:1 (m:m) mixture of gold and silver nanoparticles was prepared. The metal content of the purified samples was verified by atomic absorption spectroscopy (AAS). The desired amounts of the two dispersions were mixed in a Falcon tube by vortexing.
For scanning electron microscopy (SEM) images, the dispersions were diluted with water and drop-cast onto a silicon wafer. The samples were dried under ambient conditions. SEM was performed with a FEI Quanta 400 FEG equipped with a secondary electron (SE) detector. The acceleration voltage was 30 kV, and the spot size was 0.3 nm.
Dynamic light scattering measurements (DLS) were carried out on a Malvern Zetasizer Nano ZS ZEN 3600 (25 °C; laser wavelength 633 nm). The scattering was monitored at a fixed angle of 173° in backward scattering mode. The primary data was derived from the correlation function of the scattered intensity.
Analytical disc centrifugation was performed with a CPS Instruments Disc Centrifuge DC 24000 (24000 rpm, 28978g). The wavelength of the laser light source was 470 nm. Two sucrose solutions (8 wt% and 24 wt%) were used to provide a density gradient with n-dodecane as capping agent. The calibration standard was a dispersion of poly(vinylchloride) (PVC) particles in water with a particle size of 371 nm. Calibration was carried out prior to each run. A sample volume of 100 μL was used for every run.
Aerosol measurements were conducted with a Scanning Mobility Particle Sizer (TSI Inc. 3936), equipped with a nanoDMA (TSI Inc. 3085) and water-based ultrafine condensation particle counter (W-UCPC, TSI Inc., model 3786). The DMA was operated with 0.3 lpm aerosol and 3.0 lpm sheath flow. The scan time was set to 120 s resulting in a covered particle size range of 4.5 to 159.6 nm. The necessary transfer from dispersion to aerosol was achieved with a TSI Inc. prototype Model 3485 Nanoparticle Nebulizer. The samples were diluted to desired concentrations with ultrapure water. Prior to the particle size measurements, calibration runs were carried out with dispersions of SiO2 particles.
3. Theoretical background of instrumentation used
3.1 Scanning Mobility Particle Sizer (SMPS) for aerosols
Diffusion batteries as well as low pressure cascade impactors are used to measure size distributions of aerosols. They have several principal and practical disadvantages, in particular their low size resolution. The most important tool for submicron gas-borne particle size distribution measurements thus far are the scanning mobility particle sizer (SMPS)9 or related instruments like the fast mobility particle sizer (FMPS).19 In an SMPS, the particles are bipolarly charged in a defined way.20 They are then fractionated in a differential mobility analyser (DMA) according to their electrical mobility of one polarity, which is related to their electrical mobility diameter. In the case of spherical particles the (electrical) mobility diameter of single-charged particles is equal to the geometric diameter. In case of non-spherical particles it assumes that the particle under consideration behaves in the DMA like a sphere of this particular diameter. The fractionated particles are counted with a condensation particle counter (CPC) in which the particles are enlarged to optically detectable sizes. The resulting number size distribution does not yet represent the airborne number size distribution, because it is biased by multiple-charged particles and does not yet take into account charging probabilities. To obtain the correct number size distribution from the measured distribution, multiple-charged particles having the same electrical mobility as single-charged particles are deducted from the corresponding mobility class, resulting in the corrected distribution of single-charged particles as a function of mobility size. With the known size-dependent probability of a particle acquiring a single elementary charge in the bipolar charger, the total number distribution as function of electrical mobility diameter, equal to the geometric diameter for spheres, is calculated.21,22 Depending on settings and DMA used, SMPS systems can typically cover particle sizes between 2.5 nm and 1000 nm.The measured number distributions can easily be transferred into surface area and volume distributions with the equations for spheres. Problems of error propagation have to be discussed. Here, we are investigating only spherical particles to avoid the increasing uncertainties, particularly in the surface area and volume/mass determination of non-spherical particles.11
3.2 Transformation of dispersions into aerosols
In order to be able to make use of aerosol measurement technology for colloid characterization, the colloid must be transformed into an aerosol, if possible without any changes of particle properties. For this purpose devices are used which transfer the liquid into a spray, followed by evaporation of the droplets, resulting in an aerosol consisting of solid particles from the suspension and unavoidable residual particles from crystallization of dissolved, non-volatile material.23 To avoid agglomeration of particles during drying of the droplets, each droplet must not contain more than one single particle. This can be achieved if very small droplets are produced and/or by dilution of the dispersion. Most of the time, both steps have to be applied. The droplets normally evaporate very easily. A change of the size of the particle from a droplet may occur if the dissolved, non-volatile material in the droplet forms a layer on the surface of the solid particle during drying. To minimize this, as well as the formation of residual particles, the produced droplets have to be small, non-condensing materials in the colloid have to be avoided, and the dilution medium (water) has to be extremely clean.A colloidal sample is automatically diluted in-line in ultrapure water (UPW) and then injected into the nebulizer unit. The nebulizer, comprised of a unique critical orifice that helps to produce smaller droplets, generates a droplet distribution in filtered air. The resultant droplet distribution encounters an impaction pin in close proximity to the nebulizer orifice. The impaction pin serves to remove the large droplet fraction of the droplet distribution. Water is removed from the approximately 300 nm diameter droplets exiting the nebulizer by mixing them with dry filtered air and heating the resulting mixture to form an aerosol which then is characterized with aerosol measurement techniques. By reducing the size of the droplets, it is possible to reduce the aforementioned formation of non-volatile residual particles. The sizes of particles originating from precipitation of residues from water, as commonly experienced when dispersing liquids, are reduced to approximately 10 nm and below. If the same amount of residue is present inside a droplet that contains a nanoparticle, it would only cause a negligible change of the nanoparticle size. For example, the 74 nm Ag particles used here would grow to 74.06 nm and the 22 nm Au particles to 22.67 nm. In addition, by controlling the dilution ratio, one can ensure that not more than one particle is present in each droplet, which would lead to a decrease in the measured particle concentration and shift the size distribution to larger particle sizes. The most important advantages of the nebulizer are that it produces small droplets (<300 nm), high dilution ratios can be achieved, dispersions with different liquids can be treated and the dilution, spraying and evaporation process takes place in one controlled instrument.
For aerosol characterization, we have used the SMPS to measure number concentration vs. size distribution of spherical particles. The number concentration of nanoparticles with a certain particle size in the dispersion can be derived from the number concentration measured in the gas phase with the known flow rate and the dilution ratio of the nebulizer.
The ultrapure water used for dilution was checked beforehand with respect to the production of residual nanoparticulate contamination in the size range from 10 to 100 nm. The nebulizer generated an aerosol with a maximum concentration of 2.0 × 10³ # cm−3 at 10 nm, which dropped continuously with increasing diameter to 1.0 × 101 # cm−3 at 100 nm. The residual particle sizes produced with classical atomizers are typically larger and their concentrations several orders of magnitude higher. This is because the larger droplets produced with the atomizer cause larger residual particles which grow into the size range covered by the measurement instrument. Fortunately, the aerosol measurement technique allows to control the effect of these components because the residual particles show up in the measured size distribution curve. The size information of the residue together with the known droplet size can be used to estimate the size increase of the analyzed particles due to residues which becomes more important with decreasing particle size. As long as their sizes are smaller than the ones of the particles to be analyzed, they can be separated. The nebulizer allows the reduction of the impact of these components and lowers the minimum particle size detection limit of the aerosol measurement technique.
Commercial dispersions typically contain stabilizers to avoid agglomeration of the highly concentrated nanoparticles in the liquid. When the sprayed droplets are dried, the stabilizers also precipitate and generate residual particles which are usually larger in size than the ones from the water. By testing a series of dilution ratios with ultrapure water, the size of the resulting residual particles decreases with increasing dilution, thus allowing a better differentiation of the nanoparticulate sample from residual particles.
The dilution ratio of the nebulizer has to be calibrated as required for the determination of the particle number concentration in the dispersion. The nebulizer controls the dilution ratio of the sample as well as the spray and drying process. The SMPS as detector gives aerosol concentration and number-based size distributions. The control software of the complete system combines the data into one format. It also allows the calibration of the number concentration by using a defined volume concentration standard as sample.
Here, a prepared dispersion of silica nanoparticles with a narrow distribution (mode 30 nm) and a concentration of 5.0 × 10¹⁷ nm3 mL−1 was used. The calibration procedure typically measures the standard at a dilution factor of ca. 1000. The number-based aerosol distribution is then converted into a volume-based particle size distribution. The ratio between the specified total volume and the measured aerosol total volume of particles is used as a conversion factor to calculate number concentrations in unknown samples.7
The correctness of the dilution ratio was checked by analyzing a series of differently diluted dispersions and determining the normalized size distributions. They have to agree if only single or no particles are in the droplets. They agreed very well in number concentration except for very small dilution factor (100), where larger particles occurred due to agglomeration in the droplet. The curves were normalized by the peak number concentration. The normalization is possible because we are only interested in the sizing quality, not in absolute particle concentrations. The distributions were described as log-normal distributions represented by only two parameters. The normalized measured distribution as well as the corresponding log-normal distribution are shown in Fig. 1. The mode diameter and the corresponding standard deviation measured with SMPS are dm = 30.2 nm and σg = 1.10. They agree very well with the ones given by the manufacturer (dm = ∼30 nm; σg = ∼1.18) without defining the equivalent diameter. The manufacturer mainly specifies the number concentration of the dispersion.
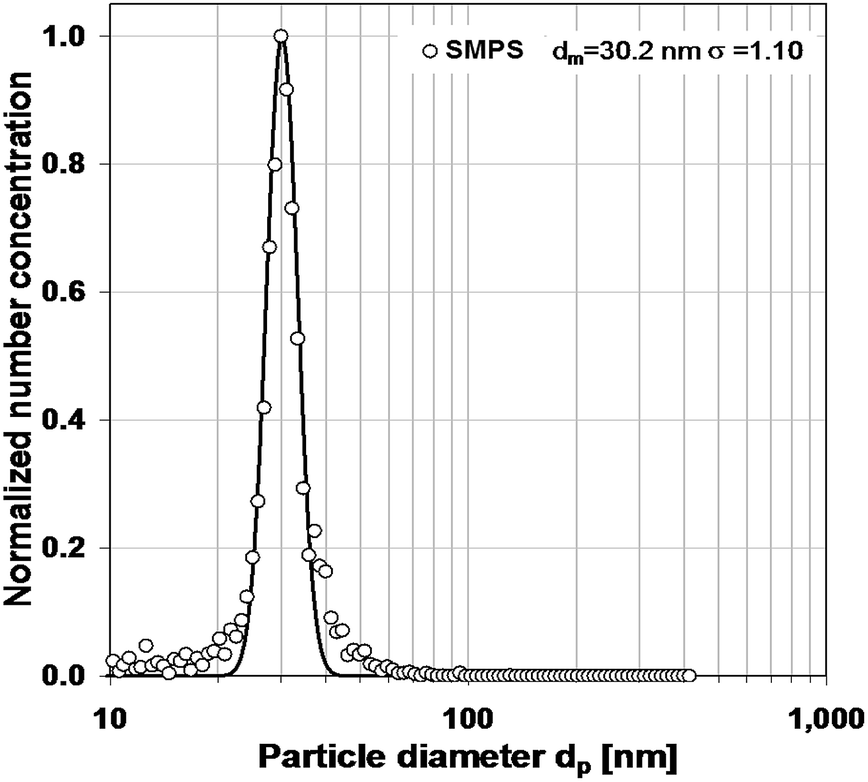 | ||
| Fig. 1 Normalized number size distribution of an SiO2 standard nanoparticle dispersion, measured with nebulizer + SMPS and normalized by peak number concentration, and the corresponding log-normal distribution. | ||
3.3 Dynamic Light Scattering (DLS) and Analytical Disc Centrifugation (ADC) for dispersions
Dynamic light scattering (DLS) is one of the most frequently used methods to obtain an average diameter of nanoparticles dispersed in liquids. While this nondestructive method offers a quick and easy measurement and has the advantage of simultaneously probing a large quantity of particles, it has a number of sample-specific limitations.28,29 The light scattering technique relies on Rayleigh scattering from the suspended nanoparticles that undergo Brownian motion. By illuminating the sample with a laser source to estimate the diffusion speed of the particles, the hydrodynamic diameter of the nanoparticles can be calculated. While leading to reasonably accurate results for strictly monodisperse nano-particles, dynamic light scattering is unable to distinguish between nanoparticles with slight differences in diameter or to precisely resolve polydisperse samples.8,30 This is due to the fact that this method measures the intensity of the scattered light which is proportional to the sixth power of the particle diameter. In the case of a polydisperse sample, the scattered light of larger particles or agglomerates will strongly overlay that of smaller particles. In comparison to the other analytical methods mentioned, dynamic light scattering measures the hydrodynamic diameter of the particles, which includes hydration layer, polymer shells or other possible stabilizers, leading to a larger particle size in general. On the assumption that the colloidal particles are treated as uniform isotropic non-interacting single scattering spheres, the measured intensity distribution may be converted into relative volume or number distribution of the particle size.31Analytical disc centrifugation (ADC) is a high-resolution particle sizing technique that utilizes Stokes' law to estimate an unknown particle size distribution in a known centrifugal field by measuring the sedimentation time of the particles in a fluid of known density and viscosity.32 The hollow centrifugal disc is filled with a density gradient and operated at a defined speed. Prior to each run a standard with very narrow particle size distribution is used to calibrate the time scale to particle size. As the particles' sedimentation rate is proportional to the square of their diameter, the resolution of the analytical disc centrifuge is adequate to separate particles with very small size differences. To measure a sample, the density of the nanoscopic material must be known. This leads to difficulties if a particle system of two different materials is to be examined. While alloyed or core–shell particles can be measured by applying a mixed density, a juxtaposition of two or more particle types of different density cannot be concurrently analyzed for all particle types.
4. Results and discussion
4.1 Scanning electron microscopy
Scanning electron microscopy is fully capable of resolving different particle sizes. It can also probe the morphology of the synthesized particles, in this case spherical. A histogram can be compiled from the images, either by measuring and counting the particles manually, or by using a specific software. From the measured data, a log normal distribution has been derived in our study. In the case of gold nanoparticles (Table 1), a mode diameter of 18.3 nm was obtained from the number distribution by manually measuring the diameter of 150 particles. Likewise, this method leads to a mode diameter of 71.3 nm for the silver nanoparticles (Table 1). The mixed gold–silver dispersion was accurately resolved with mode diameters of 19.4 nm for gold and 71.5 nm for silver (Table 1).| Particle material | SEM | DLS | ADC | N + SMPS | |||||
|---|---|---|---|---|---|---|---|---|---|
| d geometric | σ | d hydrodynamic | σ | d gravimetric | σ | d el-mobility | σ | ||
| a Based on Au. b Based on Ag. | |||||||||
| Au–Ag-mix | Au (number) | 18.3 | 1.17 | 22.0 | 1.25 | 13.9 | 1.19 | 22.0 | 1.15 |
| Ag (number) | 71.3 | 1.12 | 61.5 | 1.30 | 50.5 | 1.25 | 74.2 | 1.16 | |
| Au (number) | 19.4 | 1.17 | 14.6 | 1.17 | 22.6 | 1.22 | |||
| Ag (number) | 71.5 | 1.17 | 51.2 | 1.29 | 51.3 | 1.23 | 74.0 | 1.17 | |
| Au (massAu) | 19.8 | 1.17 | 25.5 | 1.25 | 15.2 | 1.19 | 23.3 | 1.15 | |
| Ag (massAg) | 74.3 | 1.12 | 75.6 | 1.30 | 58.7 | 1.25 | 79.0 | 1.16 | |
| Au–Ag-mix based on Au | Au (massAu) | 20.9 | 1.17 | 15.6 | 1.17 | 25.4 | 1.22 | ||
| Ag (massAg) | 38.1 | 1.24 | |||||||
| Au–Ag-mix based on Ag | Au (massAu) | 22.6 | 1.17 | ||||||
| Ag (massAg) | 76.9 | 1.17 | 58.5 | 1.23 | 79.6 | 1.17 | |||
The size of each particle was determined by measuring the corresponding largest dimension. The geometric standard deviations were 1.17, only for silver particles, the value was 1.12. There may be a statistical error because only a rather small number of particles had been counted.
When comparing the results from the SEM images, it has to be taken into account that the particle sizes derived from electron microscopy images represent the metallic core of the particles because the hydrated polymeric shell collapses during drying and in the high vacuum chamber of the SEM. It is also noteworthy that the accuracy of the measured particle size scales with the resolution of the SEM images. Apart from a possible distortion of the images due to charging effects, the edges of the particles become increasingly blurred with decreasing particle diameter, making a precise size prediction more difficult.
4.2 Discussion and comparison of size distributions measured in dispersions and after aerosolization
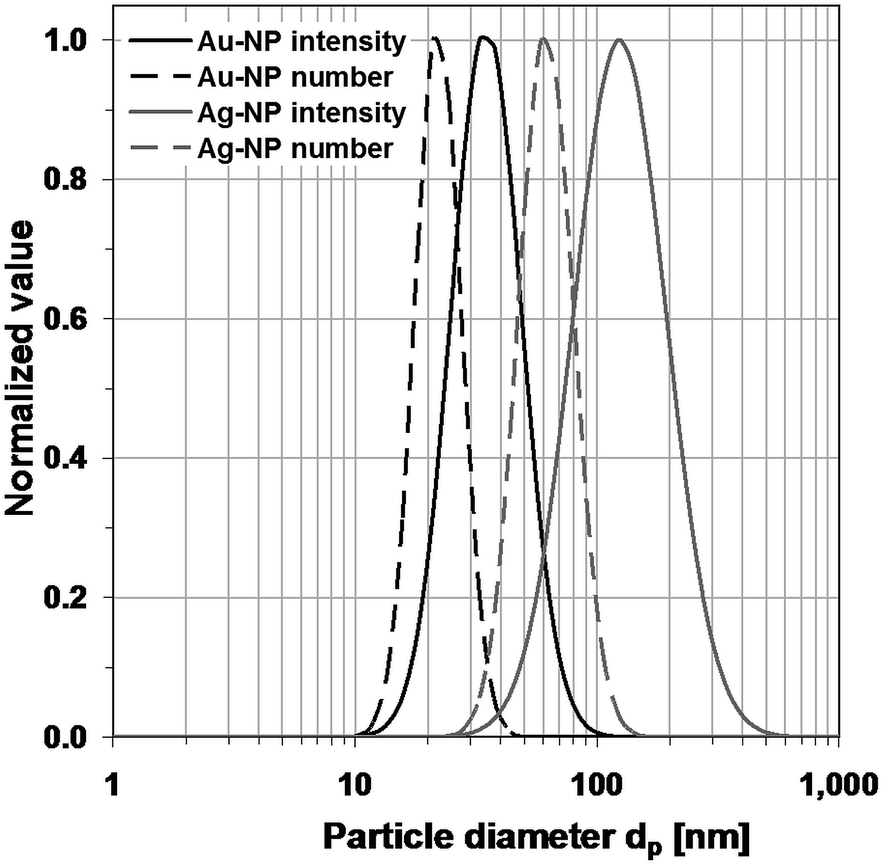 | ||
| Fig. 2 Normalized log-normal intensity and number concentration distributions of gold and silver nanoparticle dispersions measured with DLS. | ||
Note that the mean number-weighted hydrodynamic diameter of the silver nanoparticles is, against expectations, smaller than the geometric diameter derived from SEM images. This can probably be attributed to the fact that the SEM image represents only a very small fraction of the sample. Moreover, the number concentration is a mathematically derived distribution parameter that is strongly dependent on the quality of the intensity distribution and the monodispersity of the nanoparticles.
In Fig. 3, the normalized number distribution of the mixture is compared with the distributions of the components. The mixture shows only one peak at dm = 51.2 nm with σg = 1.29, similar to what was described by Mahl et al.8 The DLS distributions show only one distribution slightly shifted to larger particles in comparison to the smaller fraction. This has been observed already by several investigators.8 They argue that DLS cannot see the small particles because of the tremendously reduced scattered light at smaller particle sizes compared with the scattered light of the larger particles. As a result, DLS is indeed unable to resolve bimodal distributions, and therefore also not distributions with even higher number of modes.
 | ||
| Fig. 3 Normalized log-normal number concentration distributions of gold and silver nanoparticle dispersions, compared with the mixture number and intensity distributions as measured with DLS. | ||
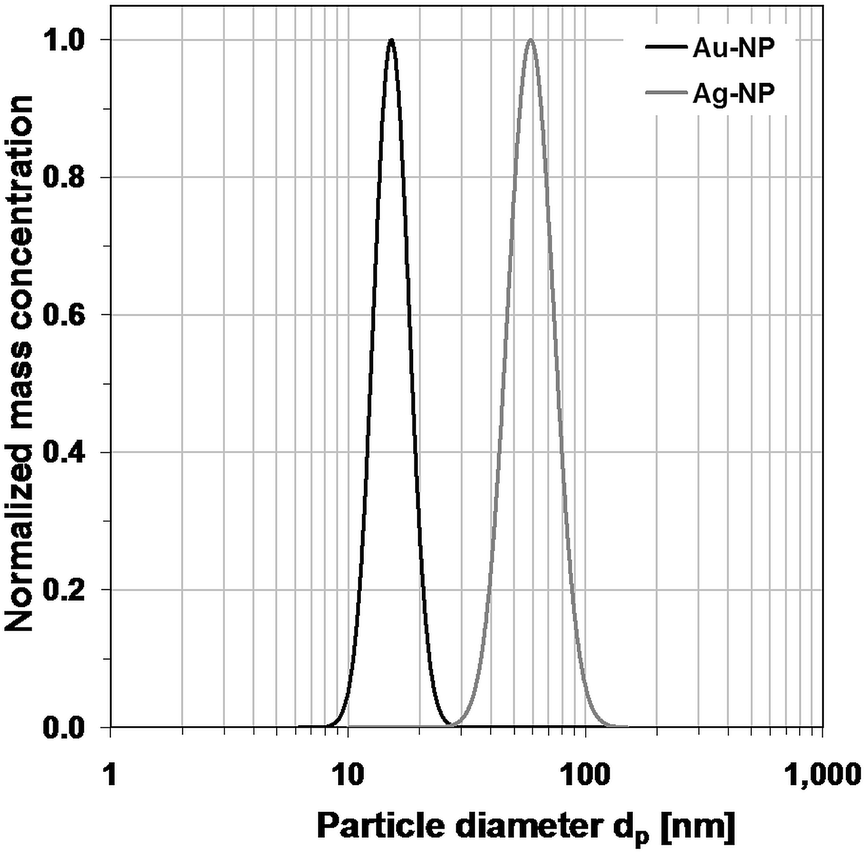 | ||
| Fig. 4 Normalized log-normal mass concentration distributions of gold and silver nanoparticle dispersions, measured with ADC. | ||
The mixture of both kinds of nanoparticles can be examined either with the density of pure gold, pure silver or with a calculated mixed density. However, as the given particle size distribution of the inspected mixed dispersion directly depends on the predefined density, not more than one of the two mean diameters of the bimodal size distribution will be a reliable result. A mixed density will yield a size distribution in which the size of the gold nanoparticles is overestimated and the silver nanoparticles underestimated. As Fig. 5 shows, the ADC is capable of separating the particles in the mixed dispersion.
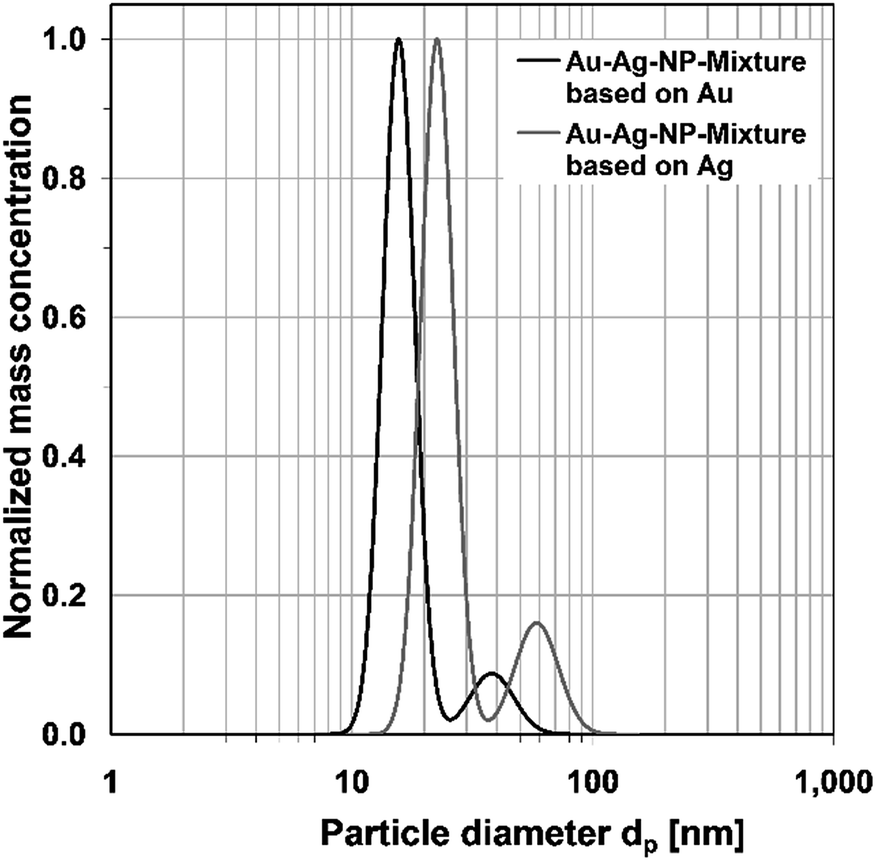 | ||
| Fig. 5 Normalized log-normal mass concentration distributions of the mixture of gold and silver nanoparticles, measured with ADC. | ||
Mode diameters of 15.2 nm for the gold nanoparticles and 58.7 nm for silver nanoparticles are obtained. The mode diameters of the particles in the mixed dispersion are almost identical to the corresponding pure particles, depending on the defined density. It is also observable that the reproducibility of measurements in the ADC is excellent, as the size distribution graphs of the mixed dispersions and their maxima are almost entirely congruent to the corresponding pure nanoparticle systems. It is also noteworthy that the particle diameters are slightly smaller than those obtained from scanning electron microscopy. This is likely due to the polymeric coating of the nanoparticles, which lowers the effective density of the particles.
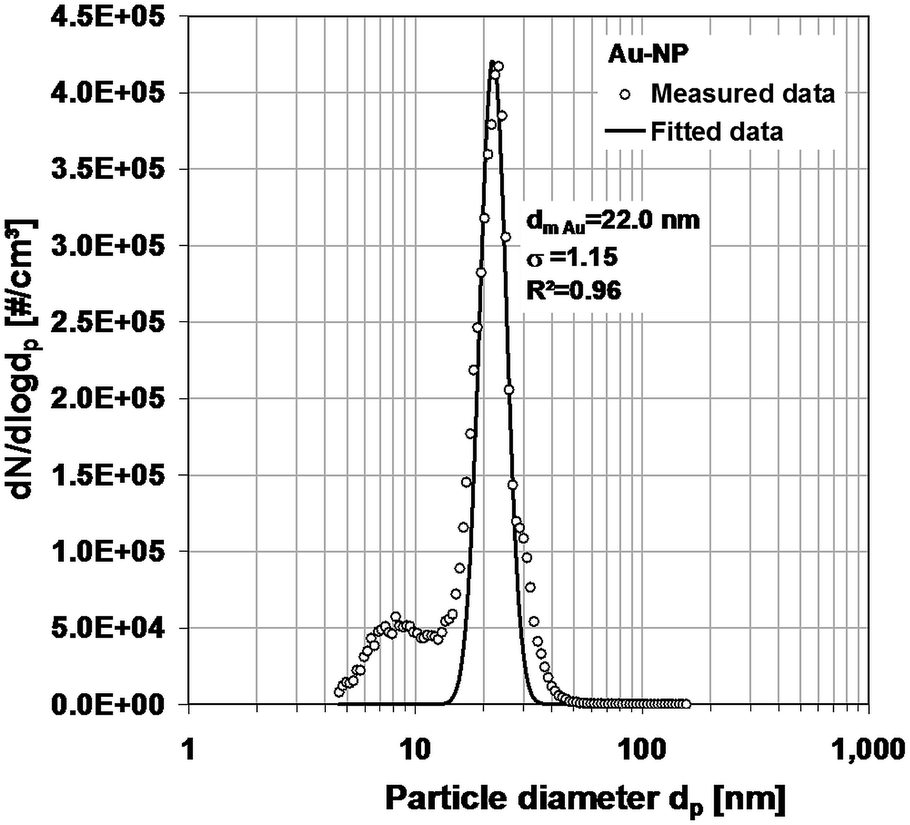 | ||
| Fig. 6 Number concentration distribution of the gold nanoparticle dispersion, measured with SMPS, and the derived log-normal distribution. | ||
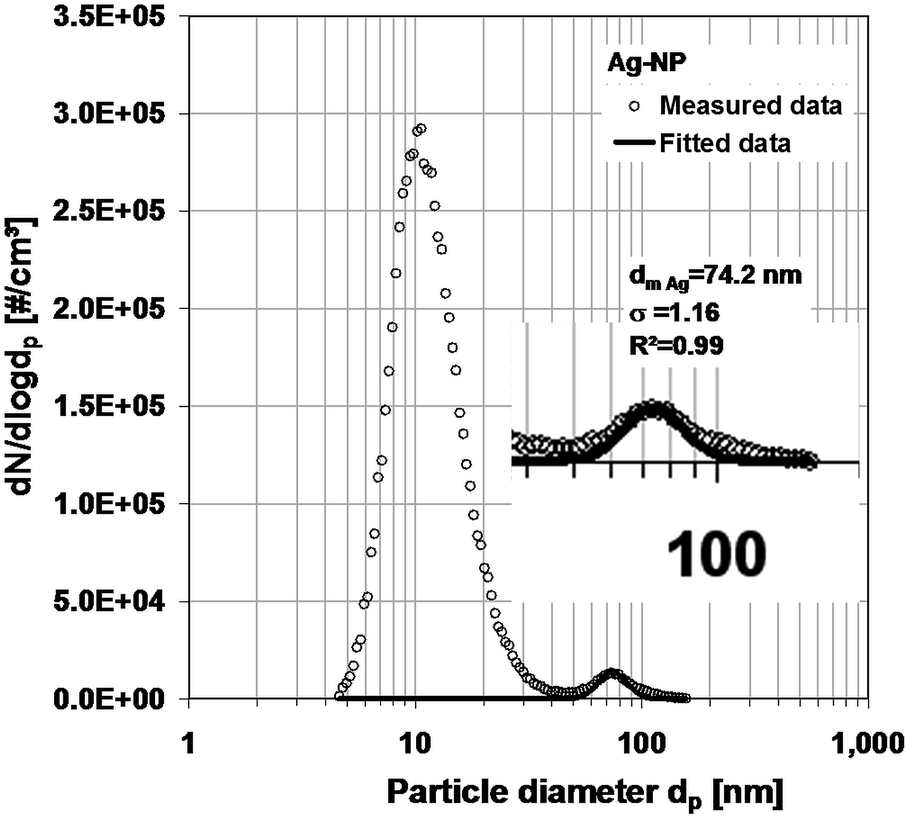 | ||
| Fig. 7 Number concentration distribution of the silver nanoparticle dispersion, measured with SMPS, and the derived log-normal distribution. | ||
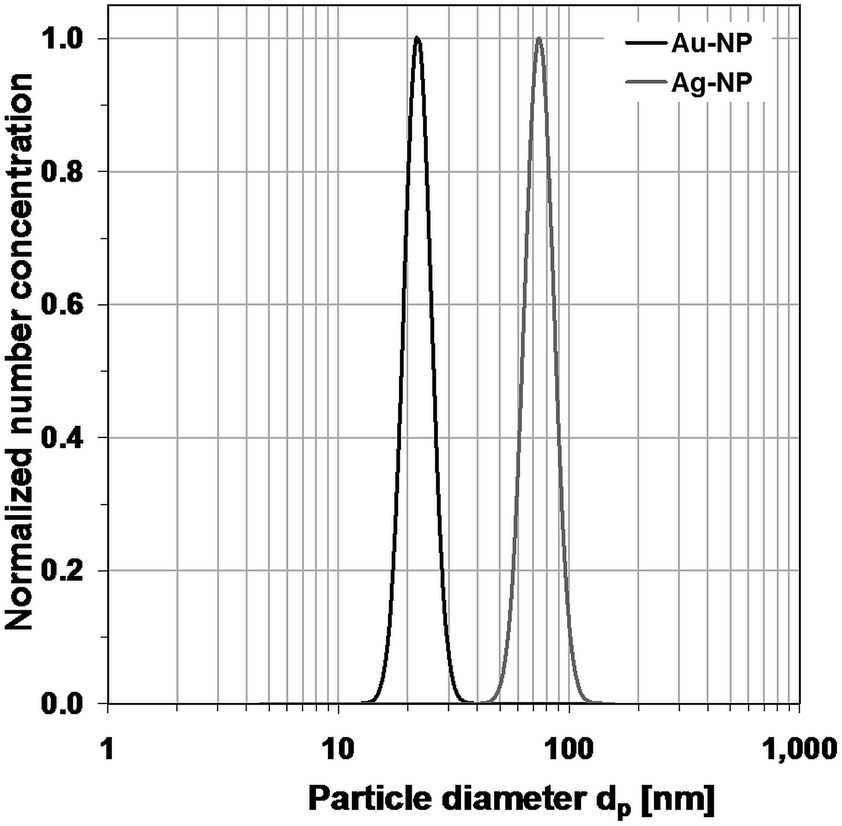
This distribution can be reduced by changing the dilution ratio of the dispersion and the sprayed dispersion. In the case of the gold particles, their distribution can easily be identified by subtracting the background (Fig. 6). In the case of the silver particles (Fig. 7), the peak is rather small compared with the peak of the residues. The quality of the data could be improved by higher dilution. Nevertheless, a log-normal distribution describing the measurement results could be derived for each metal. The normalized distributions are shown in Fig. 8.
 | ||
| Fig. 8 Normalized log-normal number concentration distributions of the two dispersions of gold and silver nanoparticles, derived from SMPS-data. | ||
In Fig. 9, the measured distributions of the gold–silver-mixture are shown. It is a tri-modal distribution. The peak on the left refers to the particles caused by residues from particle-free droplets. They would cause a limit in the measurable size range at the lower size end, if it were not avoided. Again, it is possible to identify the two separate gold and silver distributions and to describe them by log-normal distributions. The normalized log-normal number concentration distributions are shown in Fig. 10.
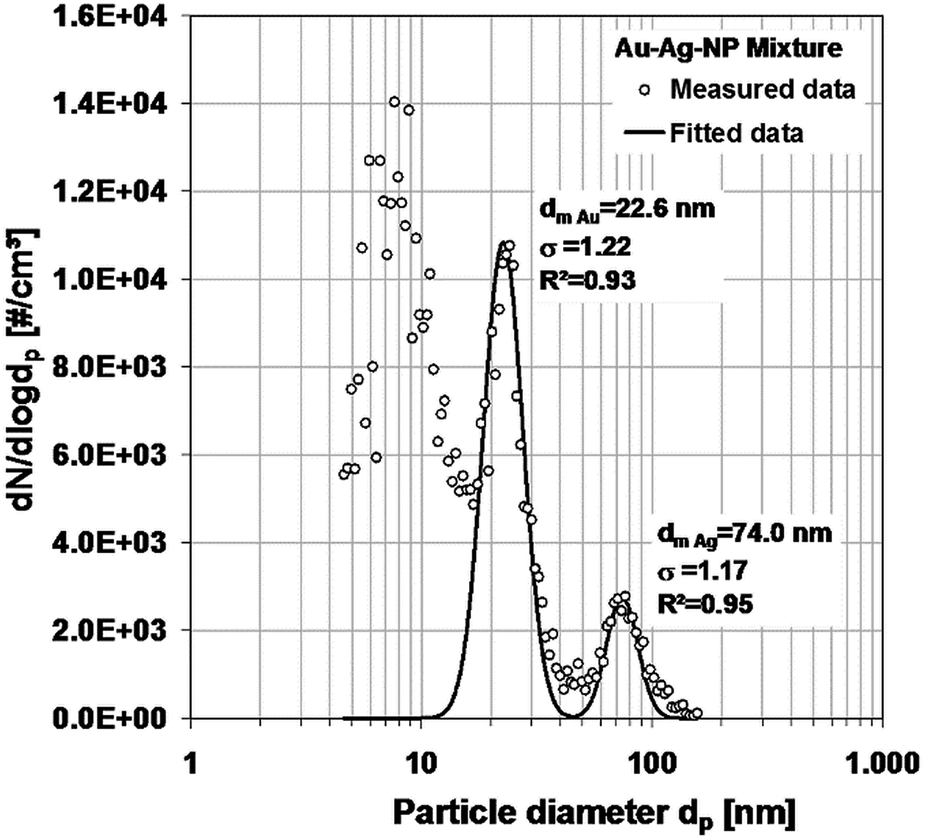 | ||
| Fig. 9 Number concentration distribution of the mixture of gold and silver nanoparticles, measured with SMPS, and the derived log-normal distributions. | ||
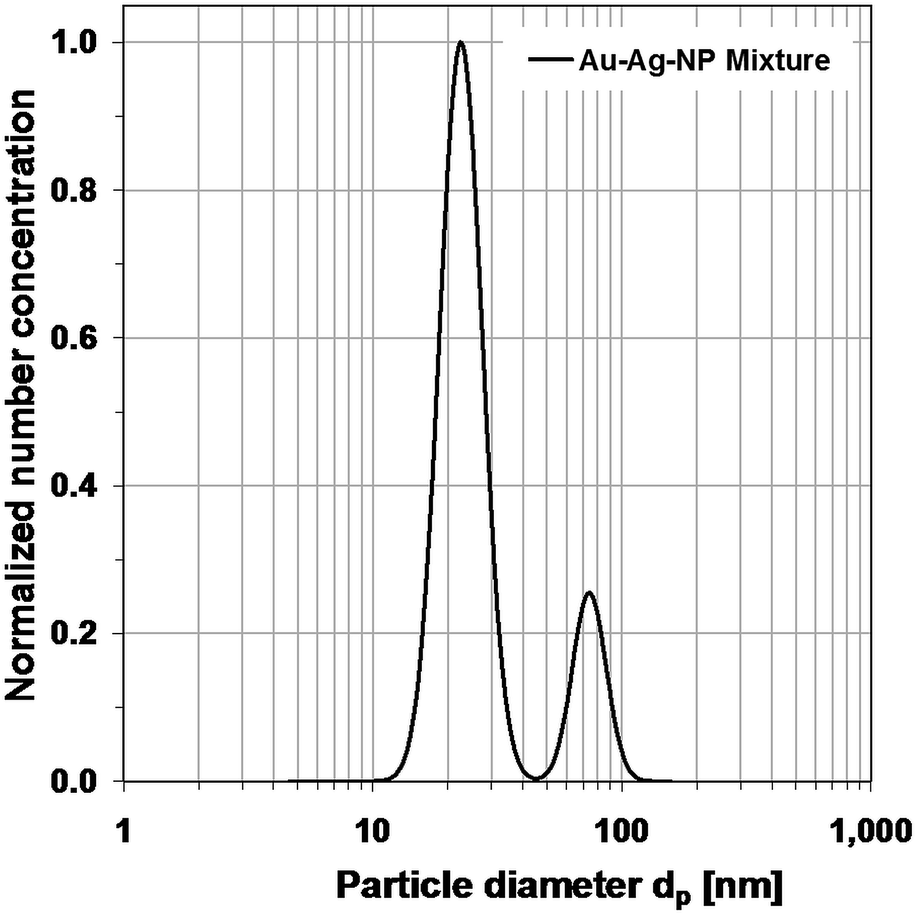 | ||
| Fig. 10 Normalized number concentration distributions for the mixture of gold and silver nanoparticles. | ||
4.3 Transformation of measured number size distributions (EM; DLS, N + SMPS) into volume (mass) size distributions and vice versa (ADC) for comparison
With the assumption of spherical particles, the measured number distributions (EM, N + SMPS) can be transferred into volume distributions, which can be converted into mass distributions, using the known density of the gold and silver particles. The mass distributions determined with ADC can similarly be turned into number distributions by applying the reverse procedure. All these distributions can be represented by the modal diameter and the geometric standard deviation of the log-normal distributions. These parameters, together with the parameters of the measured distributions, are summarized in Table 1.DLS measures intensity distributions. The derived modal diameters of the number distribution are larger in the case of gold, and smaller in the case of silver, compared to the corresponding SEM-values. The σg-values are larger, indicating the lack of sizing resolution. For the mixture, only one mode diameter is given, which is not very meaningful, especially for the mass distribution.
The SEM and nebulizer + SMPS are both used to determine number concentration distributions. SEM analysis gives the geometric diameter as a basic quantity. The SMPS measures the electrical mobility diameter, which in the case of a sphere is equal to the geometric diameter. Compared to the sizes from SEM, which we used as reference, the mode diameters measured with N + SMPS are 20% larger in the case of the small gold particles and only 4% in the case of the larger silver particles. The differences may be partly due to the residues in the liquid which are deposited on the particle surface during evaporation. However, as mentioned earlier, these size changes are rather minute and certainly do not amount to the deviations observed here. Other measurement errors, e.g. concerning the sizing accuracy of the SMPS, have to be taken into account. The SMPS sizing is affected by the accuracy of the applied voltage as well as the flow rates. On the other hand, a 20% difference for the small size range is acceptable in most cases. The smaller differences between the diameters of the single particles and their mixture in both measurement cases can be considered as an indicator for the measurement inaccuracies. The standard deviations (σg) in all cases are very similar with the extreme values of 1.12 and 1.22. The average value of all (σg) values of the SEM-measurements (1.16) is almost equal to the one of the N + SMPS-measurements (1.18). Except for the size increase due to residues that can be minimized, N + SMPS and SEM measurements agree very well.
ADC measures the mass distribution. The measured diameter is the geometric diameter of a sphere. The results cannot be directly compared with the results of the earlier described sizing methods. The comparison of ADC results with SEM results using the SEM values as a reference shows that the ADC-derived diameters are smaller by ∼18%. This is probably caused by a lower effective density of the polymer-stabilized gold and silver nanoparticles in comparison to naked metallic nanoparticles. The densities of pure gold and silver were used for the dispersions of gold and silver nanoparticles because it is difficult to estimate the influence of the polymer and the thickness of the polymeric shell on the hydrodynamic density. However, the polymer and the hydration layer contribute to the viscous drag of the particles during centrifugation.8 For the mixtures, the mode diameters of the two components measured with ADC compare very well with the values for the single components if the appropriate densities are chosen. Therefore, a mixture measurement with ADC is always biased by the chosen density. The (σg) values of the ADC-measurements appear to be a little bit larger than those of the SEM measurements.
Table 1 also shows the size parameters of the log-normal mass distributions, derived from the measured number size distributions with SEM and N + SMPS. A slight increase of the mode diameter is observed in all considered cases due to the weighting with r3. Therefore the difference between mode mass diameters of SEM and ADC measurements is also increased (Au 23%, Ag 21%).
A similar calculation has been performed to calculate the size parameters of the number distributions from the mass distribution parameters measured with ADC (Au 24%, Ag 29%). Again, the differences are increased.
5. Conclusions
Advantages and disadvantages of the colloidal dispersion measurement techniques DLS and ADC are compared with the aerosol measurement technique SMPS combined with a nebulizer (N + SMPS). DLS does not measure a basic parameter like number concentration and has low size resolution, suppressing the smaller particles in a size distribution. Therefore, it is not able to measure multi-modal distributions. ADC has a high resolution and is able to separate mixtures if the components cover different size ranges or have different densities. The measured mass concentration is affected by bulky polymeric stabilizers that cause an underestimation of particle size. ADC is not applicable for dispersions with particles having the same refractive index as the liquid. In the case of a mixture of particles with different density, it will assume the same density for both components. The method is very time-consuming, if the densities of particles and the liquids are comparable and the sedimentation rate is low.When applying aerosol measurement techniques, the dispersions have to be transferred into aerosols with a nebulizer. The dispersion has to be diluted to the extent that only one or no particle occurs in a droplet. This status can be controlled with the SMPS, showing no change in the relative size distribution following dilution.
The combination of a nebulizer with an SMPS shows high sizing resolution comparable to SEM and better than ADC. Since the method counts individual particles, it is independent of the density of the particles. Rather, it determines the number concentration as function of electrical mobility diameter that is equal to the geometric diameter for spheres. In the case of non-spherical particles, an extended SMPS technology11 may be used to obtain additional information based on a suitable model.33 In principle, the SMPS is able to measure very small nanoparticles (<3 nm), depending on the kind of DMA and the counter used. In combination with the nebulizer, the smallest detectable particle size is determined by the sizes of the residual particles from the dried liquid. The residual particles typically show modal diameter around or below 10 nm. The particles must be larger in order to be distinguishable.
Combining the SMPS with a nebulizer produces small residual particles (typically <10 nm, depending on the non-volatile residue concentration in the diluent) that can interfere with the nanoparticles of interest. The residues can also increase the diameter of the particles of interest. These effects can be minimized by very clean liquids and high dilution ratios. The droplets may carry high charge levels due to the spraying process that remain on the particles in the droplet. This may affect the particles' transport behavior.
One other advantage of the N + SMPS technique is that it determines the number size distribution of particles in liquids as distribution parameter directly without transformation from other distribution parameters. If, however, the mass size distribution of particles in liquids is of interest, the ADC technique is the preferred option, because it delivers this quantity without the need for additional assumptions.
Acknowledgements
We thank Axel Zerrath from TSI Inc. for the support providing the nebulizer and Carmen Nickel from IUTA for her support with the DLS measurements. Furthermore, we thank the German Federal Ministry of Economics and Technology for financial support within the agenda for the promotion of industrial cooperative research and development (IGF) on the basis of a decision by the German Bundestag. The access was opened by the member organization Energy and Environmental Technology (IUTA e.V.) and organized by the AiF, Arbeitsgemeinschaft industrieller Forschungsvereinigungen, Cologne, Germany (IGF Project no. 17660 N). We thank the Deutsche Forschungsgemeinschaft for funding within the priority program 1313 BioNanoResponses.Notes and references
- T. Hülser, S. M. Schnurre, H. Wiggers and C. Schulz, KONA Powder Part. J., 2011, 29, 191–206 CrossRef
.
- H. Schmidt, G. Jonschker, S. Goedicke and M. Mennig, J. Sol-Gel Sci. Technol., 2000, 19, 39–51 CrossRef CAS
- J. Wang, C. Asbach, H. Fissan, T. Hülser, T. A. J. Kuhlbusch, D. Thompson and D. Y. H. Pui, J. Nanopart. Res., 2011, 13, 1373–1387 CrossRef
- J. Wang, C. Asbach, H. Fissan, T. Hülser, H. Kaminski, T. A. J. Kuhlbusch and D. Y. H. Pui, J. Nanopart. Res., 2012, 14, 759 CrossRef
- T. A. J. Kuhlbusch, C. Asbach, H. Fissan, D. Göhler and M. Stintz, Part. Fibre Toxicol., 2011, 8, 22 CrossRef PubMed
- G. W. Mulholland, M. K. Donnelly, C. R. Hagwood, S. R. Kukuck, V. A. Hackley and D. Y. H. Pui, J. Res. Natl. Inst. Stand. Technol., 2006, 111, 257–312 CrossRef
- A. F. Zerrath, J. E. Farnsworth, J. H. Scheckman, J. S. Higgins and E. Willis, MRS Online Proc. Libr., 2013, 1504 Search PubMed
- D. Mahl, J. Diendorf, W. Meyer-Zaika and M. Epple, Colloids Surf., A, 2011, 377, 386–392 CrossRef CAS PubMed
- S. C. Wang and R. C. Flagan, Aerosol Sci. Technol., 1990, 13, 230 CrossRef CAS
- B. Y. H. Liu and D. Y. H. Pui, J. Colloid Interface Sci., 1974, 33, 155–171 CrossRef
- H. Fissan, H. Kaminski, C. Asbach, D. Pui and J. Wang, Aerosol Air Qual. Res., 2013, 13, 1393–1403 Search PubMed
- M. Fierz, L. Scherrer and H. Burtscher, J. Aerosol Sci., 2002, 33, 1049–1060 CrossRef CAS
- M. Marjamäki, J. Keskinen, D. R. Chen and D. Y. H. Pui, J. Aerosol Sci., 2000, 31, 249–261 CrossRef
- H. Kaminski, S. Rath, U. Götz, M. Sprenger, D. Wels, J. Polloczek, V. Bachmann, N. Dziurowitz, H. J. Kiesling, A. Schwiegelshohn, C. Monz, D. Dahmann, T. A. J. Kuhlbusch and C. Asbach, J. Aerosol Sci., 2013, 57, 156–178 CrossRef CAS PubMed
- C. Asbach, H. Kaminski, H. Fissan, C. Monz, D. Dahmann, S. Mülhopt, H. R. Paur, H. J. Kiesling, F. Hermann, M. Voetz and T. A. J. Kuhlbusch, J. Nanopart. Res., 2009, 11, 1593–1609 CrossRef
- D. R. Chen, D. Y. H. Pui and S. L. Kaufman, J. Aerosol Sci., 1995, 26, 963–977 CrossRef CAS
- K. Whitby and B. Y. H. Liu, Atmos. Environ., 1968, 2, 103–116 CrossRef CAS
- J. Turkevich, P. C. Stevenson and J. Hillier, Discuss. Faraday Soc., 1951, 11, 55–75 RSC
- H. Tammet, Atmos. Res., 2006, 82, 523–535 CrossRef CAS PubMed
- A. Wiedensohler, J. Aerosol Sci., 1988, 19, 387–389 CrossRef CAS
- W. A. Hoppel, J. Aerosol Sci., 1978, 9, 41–54 CrossRef
- H. Fissan, C. Helsper and H. J. Thielen, J. Aerosol Sci., 1983, 14, 354–357 CrossRef CAS
- J. Krames, H. Büttner and F. Ebert, J. Aerosol Sci., 1991, 35, 143–176 Search PubMed
-
W. C. Hinds, Aerosol Technology: Properties, Behavior, and Measurement of Airborne Particles, John Wiley & Sons, New York, 1999 Search PubMed
- D. Chen, D. Pui and S. Kaufman, J. Aerosol Sci., 1995, 26, 963–977 CrossRef CAS
-
D. C. Grant, M. R. Litchy, D. Blackford, Patent US8272253, 2012
- T. Niida, Y. Kousaka and S. Oda, Part. Part. Syst. Charact., 1988, 5, 139–143 CrossRef CAS
- Y. Dieckmann, H. Cölfen, H. Hofmann and A. Petri-Fink, Anal. Chem., 2009, 81, 3889–3895 CrossRef CAS PubMed
- H. Lange, Part. Part. Syst. Charact., 1995, 12, 148–157 CrossRef CAS
- P. A. Hassan and S. K. Kulshreshta, J. Colloid Interface Sci., 2006, 300, 744–748 CrossRef CAS PubMed
- B. N. Khlebstov and N. G. Khlebtsov, Colloid J., 2011, 73, 118–127 CrossRef
-
Analytical Ultracentrifugation, ed. D. J. Scott, S. E. Harding and A. J. Rowe, RSC Publishing, Cambridge, 2005 Search PubMed
- M. L. Eggersdorfer, D. Kadau, H. J. Herrmann and S. E. Pratsinis, J. Aerosol Sci., 2012, 467, 19 Search PubMed
| This journal is © The Royal Society of Chemistry 2014 |