 Open Access Article
 This Open Access Article is licensed under a
 Creative Commons Attribution 3.0 Unported Licence
Identification of materials' binding peptide sequences guided by a MALDI-ToF MS depletion assay†
Sascha
Steckbeck
a,
Julian
Schneider
b,
Linda
Wittig
c,
Klaus
Rischka
c,
Ingo
Grunwald
*c and
Lucio Colombi
Ciacchi
ac
aHybrid Materials Interfaces Group, Faculty of Production Engineering and Bremen Centre for Computational Materials Science, University of Bremen, D-28359 Bremen, Germany
bChair of Theoretical Chemistry, Technical University Munich, D-85747 Garching, Germany
cFraunhofer Institute for Manufacturing Technology and Advanced Materials IFAM, Department Adhesive Bonding and Surfaces, Group BioInspired Materials, D-28359 Bremen, Germany. E-mail: ingo.grunwald@ifam.fraunhofer.de/; Fax: +49 (0)421/2246-4 30; Tel: +49 (0)421/2246-6 30
First published on 19th December 2013
Abstract
We introduce a novel technique for an initial identification of peptide sequences that specifically bind to material surfaces based on the matrix assisted laser desorption ionization time of flight mass spectrometry (MALDI-ToF MS) depletion method. The technique relies upon time-resolved, sensitive measurements of the MALDI-ToF MS peak signals acquired from a solution containing several peptides placed in contact with an inorganic surface, in our case amorphous SiO2. Large errors intrinsic in the MALDI-ToF MS spectral analysis and uncertainties arising from the adsorption behaviour of peptide mixtures limit the predictive power of the method. However, when combined with other characterisation and modelling techniques, such as High-Performance Liquid Chromatography (HPLC), Atomic Force Microscopy (AFM), Quartz Crystal Microbalance with Dissipation (QCM-D) and Molecular Dynamics (MD), it can be used as a guide to identify novel material-binding peptide sequences, such as TPGSR for SiO2. The strategy presented in this work may have an impact on the design and synthesis of novel hybrid biomaterials based on the biomolecular recognition of inorganic surfaces.
Introduction
Protein adsorption is an ubiquitous phenomenon that takes place both in daily-life situations, for instance on the surface of contact lenses,1 and in very specific cases, for example when protein-based drugs adhere on the walls of glass storage packages.2 In the body, the adsorption of proteins on biomedical implants is the first step of a reaction cascade, which results in the adhesion of cells and thus regulates the host response upon implantation.3 Also the development of bacterial biofilms on materials' surfaces, which can influence the chemical, physical, mechanical or hygienic properties of materials, is initiated by the adsorption of a protein conditioning layer.4In the 1990s, seminal studies by Stanley Brown revealed that oligopeptides can selectively bind to inorganic mineral surfaces in a process reminiscent of biomolecular recognition.5 Several groups have recently contributed to the selection of a variety of sequences that “recognise” certain materials' classes, inorganic compounds or even crystallographic facets of the same material. From the last decade up to the present day the field has been expanding with impressive speed, due to the highly promising applications that selective peptide–material binding opens up in bionanotechnology.6–12
To date, the search for peptides that bind selectively to a certain inorganic phase is mainly confined to random selection using biotechnological methods, e.g. from phage-display libraries.7 It is therefore an open challenge to develop new techniques both to identify specific material binding motifs and to make conclusions about the underlying adhesion mechanisms.13 In this work, we present a novel and rapid technique based on matrix assisted laser desorption ionization time-of-flight mass spectrometry (briefly MALDI-ToF MS) that can be used as an initial guess to guide the discrimination between strong and weak material-binding peptides. MALDI-ToF MS is commonly used to assess the purity of protein solutions and has also been applied to investigate the adhesion between molecules and inorganic substrates.1,14–20 Different from these previous studies, the basic idea of our method relies upon time-resolved, sensitive measurements of the MALDI-ToF MS peak signals acquired from a solution containing several peptides placed in contact with an inorganic surface, in our case amorphous SiO2.
Specifically, we show that samples taken at various incubation times present different time evolutions of the peaks assigned to different peptides, as a result of their different binding affinities. Supported by additional experiments using bicinchoninic acid assay (BCA), high-performance liquid chromatography (HPLC), atomic force microscopy (AFM) and quartz crystal microbalance (QCM-D), we demonstrate the advantages and limitations of the method to discriminate strong from weak binding sequences from a mixture solution. Additional molecular dynamics (MD) simulations suggest a possible hydrophobic driving force for the affinity of tryptophan-containing sequences for the silicon oxide surface.
Experimental
Materials
SiO2 nanoparticles were purchased from Fiber Optic Center Inc. (New Bedford, USA) with a diameter of 150 nm and a BET specific surface area of 30 m2 g−1. Glass vessels were provided by Schott AG (Mainz, Germany). These included both standard borosilicate glass vials and so-called Type I Plus glass vials, whose inner walls were coated with pure amorphous SiO2 by plasma impulse chemical vapor deposition (PICVD) in order to prevent unspecific protein adhesion. Both types of vials had the same height and diameter dimensions of 40 mm and 22 mm (wall thickness: 1 mm). The Si wafers for the AFM investigation were purchased from Silchem Handelsgesellschaft GmbH (Freiberg, Germany).Lysozyme digestion
The digestion of lysozyme (Sigma-Aldrich, Steinheim, Germany, Cat. no. L4919-5G) was performed following the protocol in ref. 21 through incubation with trypsin (Sigma-Aldrich, T6567-5X20UG, Proteomics Grade) overnight at 37 °C in 400 mM NH4HCO3 buffer, at a trypsin/lysozyme (w/w) ratio of 1/50. Before the digestion, lysozyme was reduced with DTT (dithiothreitol, 45 mM) at 50 °C for 15 min and then alkylated with 100 mM iodacetamide (IAA) at room temperature for 15 min to achieve better cleavage results. The digestion was stopped by freezing the solution in liquid N2. Afterwards, the peptides were diluted to the concentration needed for the MALDI-ToF MS experiments and used immediately. Digested peptides were identified using MASCOT Peptide Mass Fingerprint software from Matrix Science. Peptides were searched against SwissProt database with a tolerance of 0.5 Da and carbamidomethylation as fixed modification.MALDI-ToF MS measurements
MALDI-ToF MS measurements were performed on a Voyager-DE™ PRO Biospectrometry Workstation from Applied Biosciences controlled by the Voyager Control Panel Software (Foster City, CA, USA). The analysis was performed with the Data Explorer 4.0 software from Applied Biosystems. All measurements were carried out on polished steel targets coated with a CHCA (α-cyano-4-hydroxycinnamic acid, Sigma, Germany, C-2020-10G) thin-film matrix. The latter was freshly prepared with a saturated CHCA solution in 100% acetone, which was allowed to dry immediately before starting the MALDI-ToF MS experiments. The matrix/sample ratio for spot preparation was 1![[thin space (1/6-em)]](https://www.rsc.org/images/entities/char_2009.gif) :1 using 0.5 μL of matrix and sample. Tests of other different preparation parameters have been performed as described in the ESI (Section S1 and Fig. S1†).
:1 using 0.5 μL of matrix and sample. Tests of other different preparation parameters have been performed as described in the ESI (Section S1 and Fig. S1†).
Lysozyme adsorption
The lysozyme adhesion experiments were performed in the same buffer as used for the digestion protocol (400 mM NH4HCO3). Four mL of protein solution at a concentration of 0.5 mg mL−1 were filled into borosilicate glass vials and 0.5 μL solution samples were collected at 0, 2, 4, 20, 22, 24, 26, 28, 44, 46 and 48 hours. During this time the solution was shaken at 100 rpm on an orbital shaker (IKA KS 260 basic, Staufen, Germany). On the one hand, each sample for the MALDI-ToF MS measurement was pipetted directly on the target coated with the CHCA matrix and allowed to dry at RT for MALDI-ToF MS analysis. In order to obtain statistically relevant measurements, at each time step we collected 5 spectra with 200 laser shots from 10 separate samples (spots). The acceleration voltage was adjusted to 25000 V and the delay time to 750 ns. The observed mass range was 5 to 20 kDa in reflector mode. On the other hand, comparative BCA assays of supernatants were performed following the instructions from the supplier (Pierce™ BCA Protein Assay Kit no. 23227, Thermo Fisher Scientific Inc., Rockford, IL, USA). The protein detection was carried out at a wavelength of 560 nm in a multimode microplate reader (Mithras LB 940, Berthold Technologies GmbH, Bad Wildbad, Germany).
Peptide adsorption
Evaluation of the adsorption of digested peptides as well as synthetic peptides was performed in protein LoBind tubes (Eppendorf, Hamburg, Germany) containing 2 mg SiO2 nanoparticles in 400 mM NH4HCO3 buffer. The concentration of the synthetic peptides amounts to 7 × 10⁻⁹ mol, which corresponds to the theoretical digest peptide concentration, assuming a complete and perfect digest (e.g., without any mis-cleavages). We note, however, that the activity of trypsin is pH-dependent and may be lower than expected at pH 8.4. This may lead to an actual concentration of cleaved peptides slightly different (smaller) than the theoretical one. During incubation, the samples were shaken at 20 °C and 1400 rpm in a thermomixer to avoid sedimentation of the nanoparticles and to assure an adequate mixing of particles and peptides. After 1, 120, 360 and 1440 minutes (24 hours) of incubation, samples of the supernatant were collected after 5 minutes of centrifugation at 21000 × g. Samples (0.5 μL) were then subsequently spotted on MALDI-ToF MS steel targets where CHCA has been applied before (0.5 μL). For calibration of the MALDI-ToF MS a peptide standard kit (P2-3143-00, AB SCIEX, Framingham, MA, USA) was used.
For the MALDI-ToF MS analysis, the acceleration voltage was adjusted to 20000 V and the delay time was 120 ns. Five spots were measured for each incubation time and peptide, recording spectra in the range of 0.4 to 2.6 kDa with 100 laser shots per spectrum (other preparation parameters were tested and the corresponding results regarding the variability of the MALDI-MS peak areas are presented in Fig. S1†).
Synthesis of peptides
Solid-phase-peptide-synthesis (SPPS) was performed adopting the Fmoc-strategy, using an automated ABI 433A Peptide Synthesizer (Foster City, CA, USA) applying the FastMoc protocol.22 Amino acids and preloaded tritylchloride polystyrene (TCP) resins were purchased from IRIS Biotech GmbH (Marktredwitz, Germany) and PepChem (Reutlingen, Germany), respectively. The activation of the carboxyl groups was performed by a mixture of HBTU (2H(1H-benzotriazole-1-yl)-1,1,3,3-tetramethyluronium hexafluorophosphate) and HOBt (1-hydroxybenzotriazole) at 0.5 M in DMF (N,N-dimethylformamide). After synthesis, the peptides were cleaved from the resin by adding 3.6 mL trifluoroacetic acid (TFA), 0.2 mL triisopropylsilane (TIPS) (Roth, Karlsruhe, Germany) and 0.2 mL H2O. The obtained solution was shaken briefly and left at RT for 2 hours. The peptides were purified by solution filtering and direct precipitation in ice-cold tert-butylmethylether (Cat. no. T175.1, Sigma-Aldrich, Steinheim, Germany). After centrifugation at 3500 rpm for 10 minutes the supernatant was removed, the pellet was frozen with liquid N2 and freeze-dried in 15 mL centrifuge tubes (VWR, Darmstadt, Germany). In analogy with the peptides obtained via lysozyme digestion, all cysteine residues of the synthetic peptides were alkylated with 100 mM IAA at room temperature for 15 min. All synthesised peptides were then tested by means of MALDI ToF-MS for the correct masses. A list of the six peptides employed in this work is presented in Table 1.| Name | Sequence | Mass | Origin | Note |
|---|---|---|---|---|
| P1 | TPGSR | 517 Da | This work | Strong SiO2 binder |
| P2 | NTDGSTDYGILQINSR | 1754 Da | This work | Weak SiO2 binder |
| P3 | GCRL | 447 Da | This work | Unclear SiO2 affinity |
| P4 | WWCNDGR | 936 Da | This work | Unclear SiO2 affinity |
| WBP | CINQEGAGSKDK | 1249 Da | Oren et al., 2007 | Weak binder to quartz |
| SBP | PPPWLPYMPPWS | 1467 Da | Oren et al., 2007 | Strong binder to quartz |
HPLC experiments
The HPLC (BioCat 700E system from Applied Biosystems, CA, USA) comparison with the MALDI-ToF MS data was performed preparing the samples as for the peptide adsorption experiments. After the centrifugation step, two 100 μL supernatant samples were injected into the HPLC C18-column (Polaris 5 μ, 250 × 4.6 mm, Agilent, Boblingen, Germany) after 1 and 1440 minutes (24 hours), during which time the solution was shaken at 1400 rpm (thermomixer). The gradient for the HPLC separation was from 0 to 7 min equilibration time with 100% solvent B (v/v). Afterwards (7 to 27 min) the peptides were eluted from the column by increasing the amount of solvent A to 70% (v/v). This was followed by 5 minutes (27 to 32 min) holding that gradient. The last step (32 to 39 min) involved the decrease of solvent A to 0% (v/v) and increase of B to 100% (v/v). Solvent A consisted of 100% (v/v) acetonitrile (HPLC grade, Roth, Karlsruhe, Germany) with 0.1% (v/v) trifluoroacetic acid (TFA, Roth, Karlsruhe, Germany). Solvent B was 90% (v/v) H2O (HPLC grade, Roth, Karlsruhe, Germany) and 10% (v/v) acetonitrile with 0.1% (v/v) TFA. The flow rate was adjusted to 1 mL min−1 and peptides were detected using a UV detector at a wavelength of 215 nm.QCM-D experiments
QCM-D measurements were performed using a Q-Sense E4 System from Biolin Scientific (Stockholm, Sweden). All tested peptides were prepared in the same concentration of 0.1 mg mL−1 in 400 mM NH4HCO3 buffer. The quartz crystal (Q-Sense, QSX 303, SiO2) was first allowed to equilibrate in air for 30 min and then in buffer for at least another 30 min. The flow rate was adjusted to 80 μL min−1. The recorded frequency shifts and dissipation were analysed by the PRISM software (v. 5.01, GraphPad Software Inc., San Diego, CA, USA). The temperature was controlled permanently to 25 °C.AFM imaging
A JPK Nanowizard III AFM (JPK Instruments AG, Berlin, Germany) was used to record surface images in liquid (AC mode) with silicon nitride probes (DNP-S10, Bruker, Germany) with a nominal spring constant of 0.35 N m−1 and a tip radius of 10 nm. The visual analysis was performed with JPK Data Processing software (v. spm-4.2.16). AFM imaging on oxidised Si was carried out after cutting a Si wafer into pieces of appropriate size. Each piece was cleaned in isopropanol in an ultrasonic bath and then thoroughly rinsed with doubly distilled water (ddH2O). Drops of peptide solutions (1 mg mL−1 in NH4HCO3 buffer) were incubated on each wafer surface for 120 minutes followed by rinsing with ddH2O. The samples were then transferred directly into an AFM liquid cell. Images (1 × 1 μm) were collected at a scan rate of 1 Hz (512 × 512 lines) at RT in NH4HCO3 buffer.Molecular dynamics simulations
The classical equilibrium Molecular Dynamics (MD) simulations were performed using the AMBER force field23 and the TIP3P water model in combination with an own force field for the interactions between oxidised Si surfaces and protein containing water solutions.24,25 The surface was modelled with a realistic structure of the natively oxidized (100) Si surface obtained and employed in previous studies.24–26,26–28 This surface features both neutral silanol groups as well as negatively charged deprotonated silanol terminations (surface charge density of −0.136 C m−2). The surface model covers an area of 43.49 × 43.49 Å2. Na+ counterions were included to ensure charge neutrality of the system. The simulations were performed using the LAMMPS29 code. The time step was set to 1 fs, the non-bonded interactions were cut off at a distance of 12.0 Å, and the electrostatic interactions were described by the particle–particle particle–mesh (ppm) method as implemented in the code. The structure of the peptide was equilibrated in solution for 6 ns at 450 and 300 K, before it was placed in close contact with the substrate, where it was once more equilibrated at 450 K for 1 ns and at 300 K for 10 ns. This protocol was repeated several times in order to explore different possible adsorbed peptide conformations.Results and discussion
When a protein solution comes in contact with a solid material surface, adhesion at the solid/liquid interface may occur, accompanied by a decrease of the protein concentration in solution. In fact, quantitative estimates of the amount of adsorbed proteins are often obtained by analysing the concentration decrease in the liquid phase with various spectroscopic or colorimetric techniques. Here we have performed MALDI-ToF MS measurements on samples of a protein solution placed in contact with SiO2 surfaces over a specific time range, assuming that protein adsorption should be accompanied by a decrease of the protein peak areas.After validating this concept with whole lysozyme proteins and mixtures of standard MALDI-ToF MS calibration peptides, we apply the method to digested lysozyme fragments, whose sequences can be assigned to specific mass/charge ratios (i.e. to specific MALDI-ToF MS peaks) by means of a database search. This permits an analysis of the adhesion behaviour of many single peptides with defined sequences at the same time. A schematic overview of the method is presented in Fig. 1.
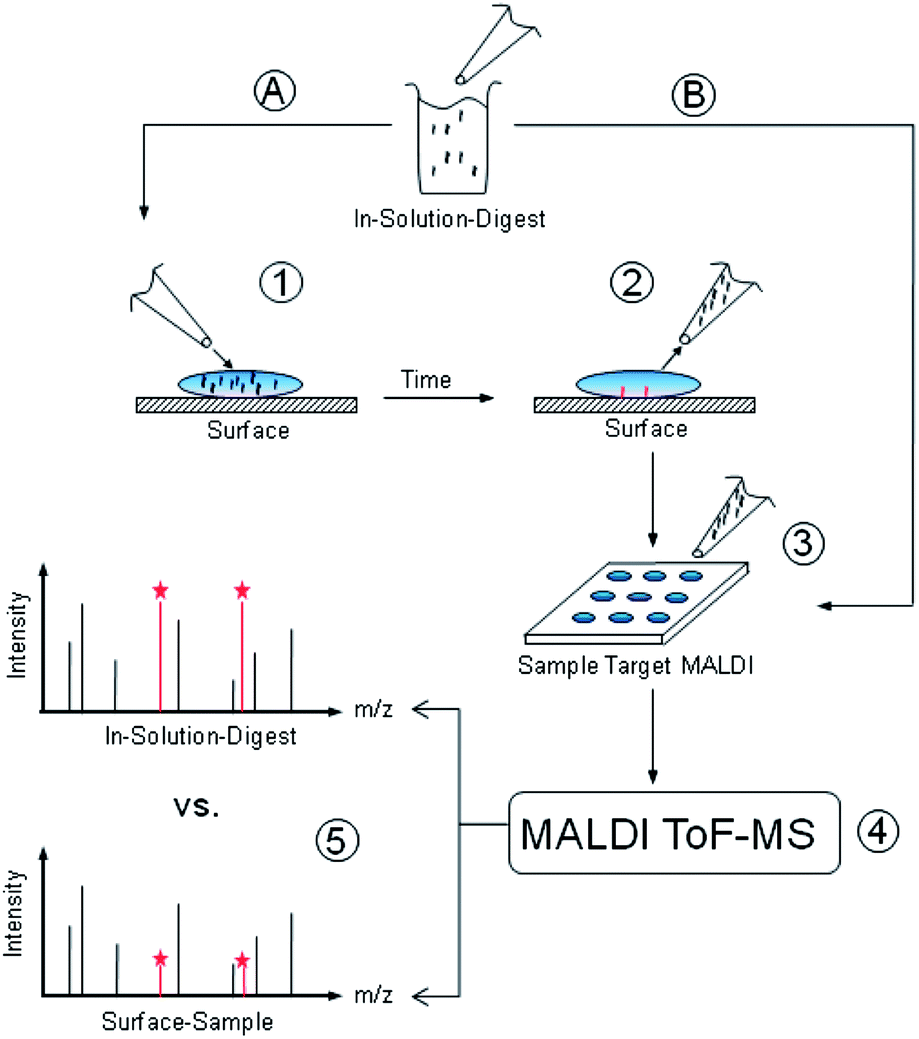 | ||
| Fig. 1 Scheme of the MALDI-ToF MS depletion technique used for the identification of material-binding peptide sequences. An in-solution-digest of a protein is split into two sample ways (A and B). Sample B is transferred immediately into the MALDI target for comparison with sample A and protein mass fingerprint. Sample A is applied to the surface to be tested (1). After specific time steps samples are taken from solution (2). Samples are prepared on MALDI targets, co-crystallizing with HCCA matrices (3). MALDI-ToF MS measurements reveal the changes in peak areas due to peptide adsorption (4 and 5). After a database search, noticeable peaks can be assigned to specific peptide sequences. | ||
Adsorption of whole lysozyme
We stored a solution of whole lysozyme for two days in uncoated borosilicate glass vials typically used as packages for pharmaceutical solutions, in particular protein-based drugs. The MALDI-ToF MS protein peak area as well as the protein amount (BCA absorbance) measured for samples in solution taken at increasing time intervals clearly decreased within the first 5 hours, indicating a loss of free proteins in solution and thus lysozyme adhesion on the vial's walls (Fig. 2, top). On the basis of calibration curves relative to BCA and MALDI-ToF MS (Fig. 2, bottom), the fraction of adhered proteins within these first 5 hours can be estimated as 20% or 40% of the total protein amount, respectively. An exact quantification, however, is prevented by the large uncertainties of the time-resolved data acquired in both assays.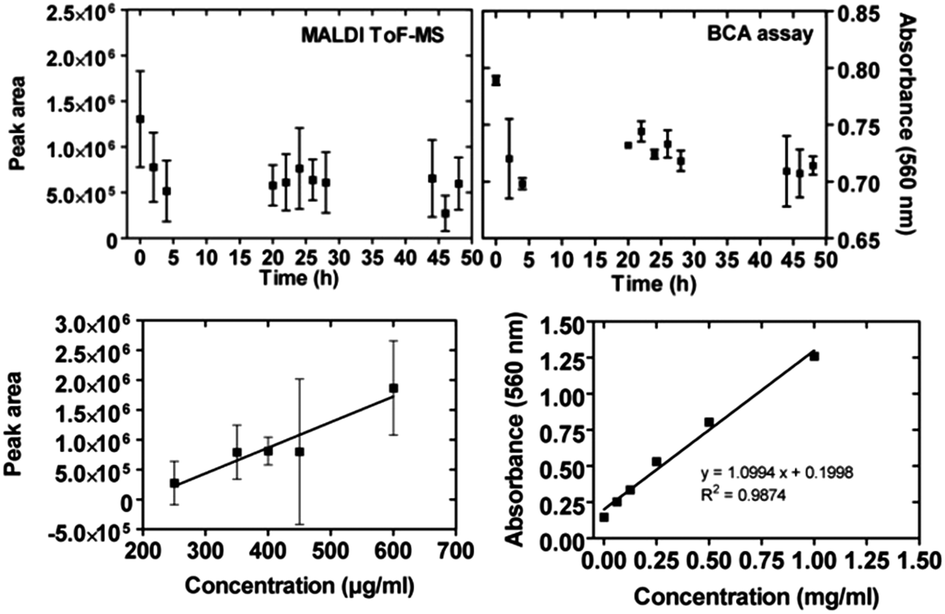 | ||
| Fig. 2 Top: adsorption of non-digested lysozyme on the wall of a borosilicate glass vial, as obtained from MALDI-ToF MS depletion (left) and BCA assay measurements (right). The squares are the experimental values. Bottom: standard curve of correlation between the lysozyme concentration and the MALDI peak area (left) and measured BCA absorbance in context to the lysozyme concentration (right). | ||
Validation with mixtures of standard calibration peptides
In order to assess whether different concentration ratios of peptide mixtures can be estimated by means of MALDI-ToF MS measurements, we performed a set of validation experiments using mixtures of three standard calibration peptides (PC1: sequence NTDGSTDYGILQINSR, PC2: sequence CINQEGAGSKDK, and PC3: sequence: PPPWLPYMPPWS). We prepared three solutions at different concentration ratios (see Fig. 3). Namely, the concentration of PC3 remains the same in the solutions A, B, and C; the concentration of PC2 decreased by 1/4 and 1/10 in solutions B and C with respect to solution A, respectively; the concentration of PC1 decreased by 1/10 in solution B and increased again to 1/4 in solution C. The three mixtures are analysed by means of MALDI-ToF MS and the peak areas of all three peptides are reported in Fig. 3.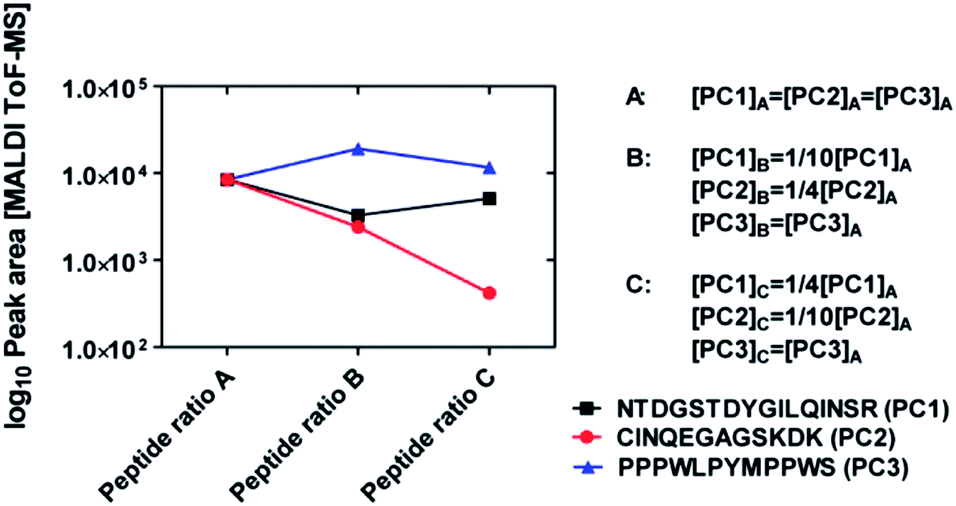 | ||
| Fig. 3 Variation of the MALDI peak areas of three different calibration peptides mixed in different concentration ratios in three solutions A, B, and C (total concentration: 100 μg mL−1). The concentrations in each solution are reported next to the graph. Note the logarithmic scale of the y axis and the normalization of the MALDI data to match the intensity values of the three peptides when their concentrations are equal (case A). | ||
It can be seen that peak areas of peptide PC3 (constant concentrations) changed only weakly in the three measurements. The peak areas of peptide PC2 decreased in the expected way and the peak areas of PC1 also followed the same trend as the concentrations. Note, from the variations of the peak areas it is not possible to gain quantitative knowledge about the original concentration ratios. This may be due either to the intrinsic large variation of the MALDI-ToF MS measurements (see Fig. S1†) or to ionisation suppression effects due to the presence of several peptides in the MALDI-ToF MS samples.
In any case, it is important that the measured peak areas qualitatively follow the same trend of the concentration ratios in the three solutions. Therefore, we conclude from this experiment that MALDI-ToF MS measurements can be applied to peptide mixtures monitoring qualitatively the change of their concentrations in adsorption experiments. Furthermore, it is possible to obtain information about their different binding affinity to the same material surface.
Adsorption of peptide mixtures from digested lysozyme
A mixture of several different peptides was obtained after digestion of lysozyme as described in the Experimental section. Using the MASCOT database search algorithm30 we were able to assign a sequence to each mass/charge peak with the total sequence coverage of 78%. The peptide mixture was placed in contact with both borosilicate glass and the SiO2-coated glass surfaces of pharmaceutical vials. The SiO2 coating was produced by plasma treatment using plasma-induced chemical vapour deposition (PICVD) to prevent protein adhesion.31 The evolution of the peaks with time demonstrated a drastic reduction of the amount of peptides in solution upon contact with borosilicate glass, irrespective of their sequences. In contrast, no or only a slight decrease of the peptide concentration in solution is observed on the SiO2-coated surface (Fig. 4), confirming the expected effect of adhesion minimization after plasma treatment.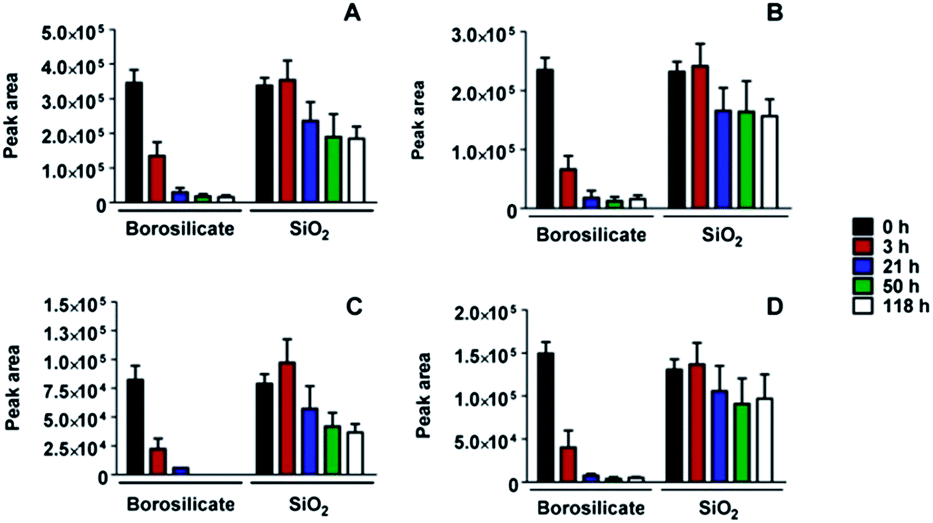 | ||
| Fig. 4 Four representative peptide adsorption plots from lysozyme digest on uncoated and SiO2-coated borosilicate glass surfaces. The change of peak areas quantifying the amount of peptides remaining in solution is reported as a function of time, over a long incubation period. The peptide sequences are as follows: (A) NRCK (518 Da), (B) HGLDNYR (875 Da), (C) FESNFNTQATNR (1429 Da) and (D) GTDVQAWIR (1046 Da). | ||
We note that, as a result of the small surface area displayed by the vials, we are not able to draw any conclusion about the specific adsorption behaviour of different peptide sequences on the SiO2-coated glass. For this reason, we performed a further MALDI-ToF MS depletion assay placing the digested lysozyme solution in contact with SiO2 nanoparticles and collecting solution samples over a time frame of 24 hours. In this experiment we can distinguish between peptide sequences that display a more or less marked reduction of MALDI-ToF MS peak areas, and thus a higher or weaker affinity for the SiO2 nanoparticle surface (Fig. 5). We realised in these experiments that the possible adsorption of the peptides to the vial's walls influence the results only to a negligible extent due to the much larger surface area of the nanoparticles. Control experiments addressing this issue are reported in the ESI† (Section S2 and Fig. S2).
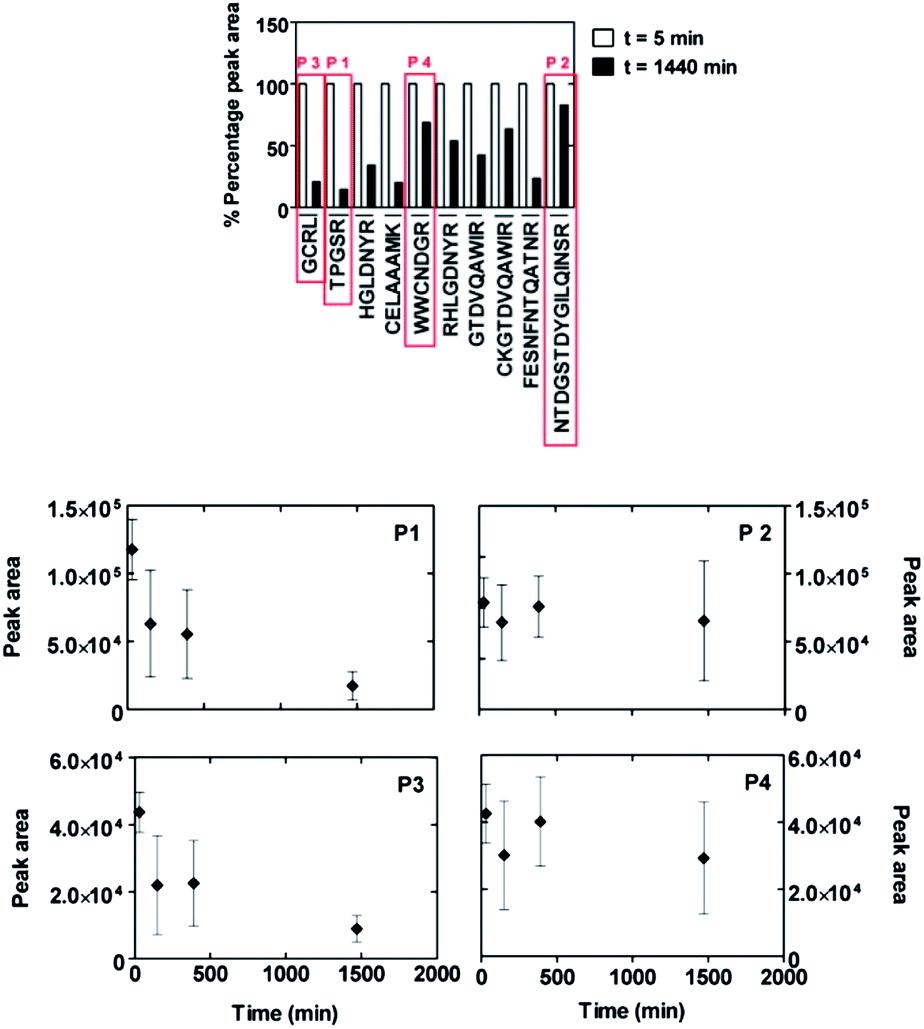 | ||
| Fig. 5 Comparison of the adhesion behaviour of peptides from a lysozyme digest mixture on amorphous SiO2 nanoparticles measured with the MALDI-ToF MS depletion technique. The diagram (upper figure part) shows the differences of peptide amounts in solution between the start of the experiment (t = 5 min) and after 24 hours (t = 1440 min) of incubation with the nanoparticles. Two peptides are selected as putative strong binders (P1: TPGSR and P3: GCRL) and two as putative weak binders (P2: NTDGSTDYGILQINSR and P4: WWCNDGR). A more detailed plot with time evolution of data points for these four peptides is shown in the lower figure part. | ||
It should be noted that different peptides possess different ionization efficiencies in MALDI-ToF MS experiments, leading to different absolute values of the peak areas. Moreover, each individual experiment is subjected to relatively large error bars concerning the peak area quantifications. Therefore, this technique can only be used as a rough and qualitative mean of estimating the surface-binding affinity of different peptides, when focusing on relative changes of the same peak during the course of one and the same experiment.
Despite these limitations, we were able to classify, for instance, the sequences TPGSR (named henceforth P1, 517 Da) and GCRL (henceforth P3, 447 Da) as strong binding peptides and the sequences NTDGSTDYGILQINSR (henceforth P2, 1754 Da) and WWCNDGR (henceforth P4, 936 Da) as weak binding peptides. In particular, peptides P1 and P3 showed a decrease of peak area starting within the first minutes after placing the solution in contact with SiO2 nanoparticles and continuously decreasing until about 1440 minutes (see Fig. 5). This behaviour was not observable for peptides P2 and P4.
It is worth noting that the identification has been performed starting from a complex mixture of peptides, with the strong advantage of rapid detection over other techniques based on biotechnological assays. A disadvantage is represented by the large error fluctuations intrinsic in the MALDI-ToF MS depletion measurements (see Fig. S1†). Moreover, at this point nothing can be said about the influence of clustering, weakening or amplifying phenomena caused by the existence of other peptides in solution on the binding affinity of a specific sequence. In fact, the existence of more than one kind of biomolecule in a solution inevitably leads to a competition for binding sites on surfaces,36 as a generalisation of the well-known Vroman effect. For these reasons, in the next section we present complementary investigations of the binding affinity of pure oligopeptides synthesised with solid phase peptide synthesis (SPPS). MALDI-ToF MS spectra in Fig. S3† illustrate the level of purity of our synthetic peptides.
Adsorption of single synthetic peptides
In order to verify the adsorption behaviour of the pure peptides, for instance to avoid competition effects in the peptide mixture, we synthesised all four peptides P1 to P4 by means of SPPS. The results are compared in particular with two other synthetic peptides which have been identified as a strong binder to quartz (sequence PPPWLPY-MPPWS, henceforth strong binding peptide, SBP) and a weak-binder to quartz (sequence CINQEGAGSKDK, henceforth weak-binding peptide, WBP) in previous studies.32,33All six peptides were investigated individually with our MALDI-ToF MS depletion technique. The results are presented in Fig. 6. As a mean of comparison, the concentration depletion in the pure peptide solutions was also measured independently by RP-HPLC immediately and 1440 minutes after incubation with the nanoparticles. To highlight the differences in binding affinity among the different peptides, we scaled their MALDI-ToF MS peak areas so that they all present the same values at t = 1 min (this reflects the usage of equal initial concentrations in all cases). We arbitrarily take the value of peptide P1 as the reference to obtain the scaling factors for all other peptides at all times. The initial peak area value is highlighted with black dotted lines in all panels of Fig. 6.
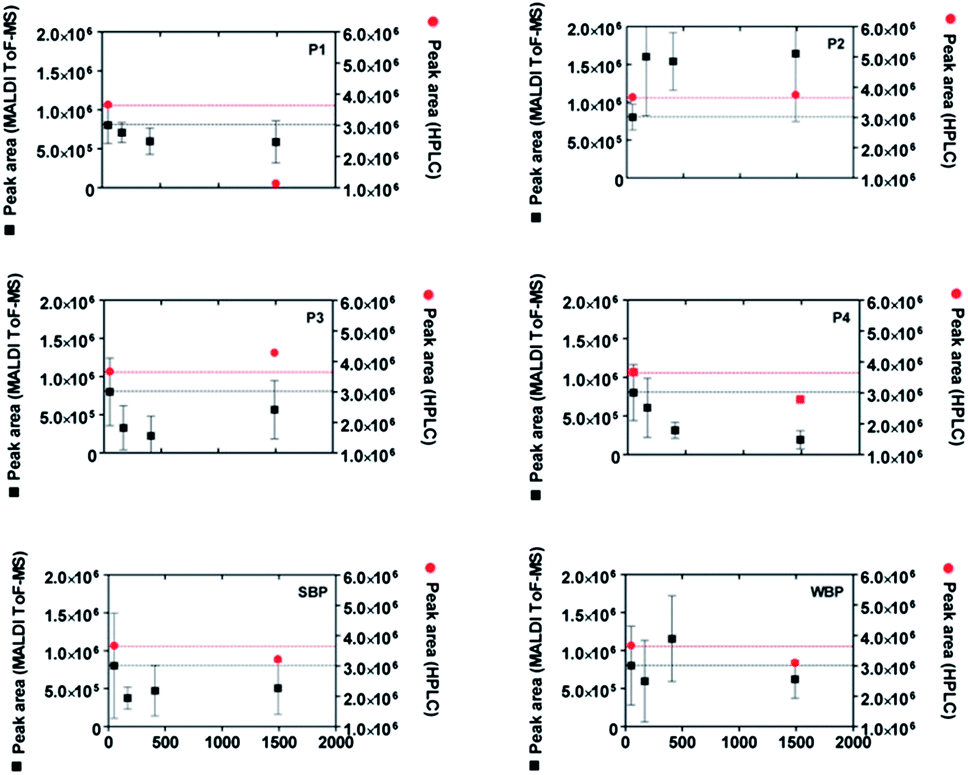 | ||
| Fig. 6 Time evolution of the MALDI-ToF MS peak areas (black squares) of four isolated peptides (P1 to P4) identified from Fig. 5 and two previously identified peptides32 (SBP: strong binding peptide and WBP: weak binding peptide) in contact with SiO2 nanoparticles. As a comparison, the results of HPLC depletion assays are reported as red circles. All peptides were synthesized by SPPS and cysteine residues were alkylated to permit comparisons to peptides from lysozyme digest. The MALDI-ToF MS data were normalized as described in the text. | ||
The obtained MALDI-ToF MS peak area evolutions confirm the strong binding character of peptides P1, P3 and SBP and the weak binding character of P2 and WBP. The HPLC results are in fairly good agreement with the MALDI-ToF MS measurements, although a slight increase of the HPLC area is visible for the P3 peptide.
Interestingly, a clear decrease of the MALDI-ToF MS peak area of P4 visible in Fig. 6 (synthetic peptides) was not observed using the peptide digestion mixture (Fig. 5). This may be because of interactions with other peptides which result in a depletion prevention of the P4 peak in the former case. Alternatively, the oxidation of tryptophan residues could result in a spurious decrease of the MALDI-ToF MS peak due to the mass change associated with oxidation. However, additional tests showed only a negligible amount of Trp oxidation during the course of the experiments thus seem to exclude this hypothesis (see ESI, Section S4†). Other spurious effects as a result of the synthesis process, e.g. remaining impurities (see ESI, Section S3†)34 or ionization suppression effects cannot be excluded. We also note that the high sensitivity of the MALDI-ToF MS technique to small changes of the peptide concentration, while being an advantage in detecting the adhesion of peptides for small surface areas (Fig. 4), is also a source of error, for instance due to inhomogeneities of the solution arising from incomplete mixing.
The slow evolution and decomposition of peptide coronas around the used SiO2 nanoparticles can be a further source of uncertainty.35 This may explain the unexpected increases of the MALDI-ToF MS and HPLC peak areas during the adsorption experiments (visible especially in Fig. 6 for P2 and WBP). However, the observed clear decrease of the peak areas for strong binding peptides is most probably a signature of strong surface affinity.
QCM-D and AFM investigations
In order to further confirm the strong or weak binding character of the peptides for silicon oxide surfaces, we performed complementary AFM imaging on an oxidised Si wafer and QCM-D analysis using a sensor coated with SiO2. The QCM-D results (Fig. 7) showed weak but clear attenuations of the oscillation frequencies (and corresponding slight increases of the dissipation signals) within the first 1500 seconds after surface contact, as expected for surface adsorption.38 In particular, the very small frequency changes (less than 1 Hz) indicated that only a few peptides interact with the surface, in agreement with the results obtained for SiO2-coated glass vials (see Fig. 4).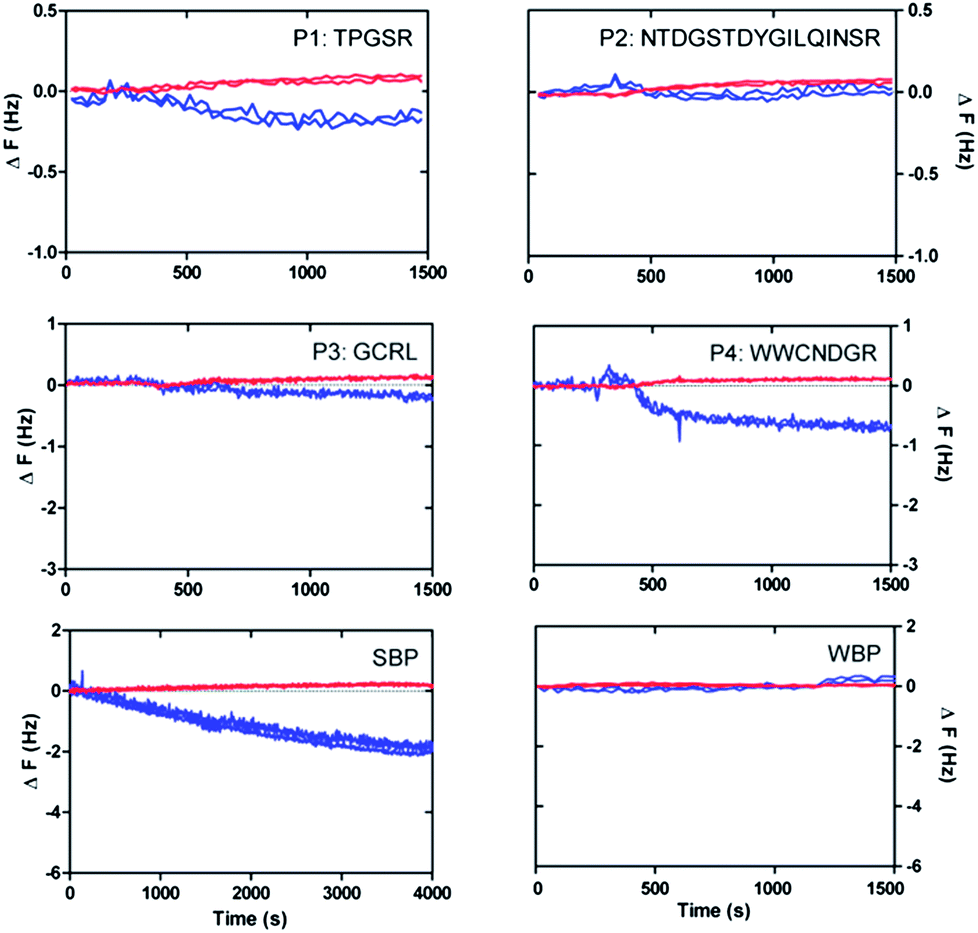 | ||
| Fig. 7 Changes of frequency (blue lines) and dissipation (red lines) obtained in QCM-D experiments (7th and 11th overtone frequencies) after placing solutions of the individual peptides P1, P2, P3, P4, SBP and WBP on SiO2-coated sensor surfaces. | ||
In particular, the reference peptide SBP produced the largest QCM-D frequency shift over a long measurement time, while no frequency shift at all is obtained for the WBP peptide, as expected.32 Similar trends are obtained for the newly identified SiO2-binder P1 with respect to the weak-binder P2. Notably, also the AFM images, in particular the different roughness of typical line sections (Fig. 8), suggest a higher adsorbed amount of P1 with respect to P2, despite the larger size of the latter peptide. For peptides P3 and P4 the situation remains less clear. Peptide P3 leads to a very small (albeit detectable) QCM-D frequency shift. This may indicate some binding affinity of the peptide for SiO2 surfaces, in agreement with the MALDI-ToF MS results obtained for peptide mixtures (Fig. 5) and the isolated peptide (Fig. 6). The AFM imaging also indicated a slight amount of adsorption, since the obtained roughness is larger than that of the clean Si wafer, although below 0.5 nm, also due to the very small peptide size. As for P4, both the QCM-D analysis and the AFM imaging suggest binding of the peptide to the surface, which we could detect by means of MALDI-ToF MS using synthetic peptides (Fig. 6) but not for peptides in digest solution (Fig. 5). Discrepancies may arise from the different nature of the surfaces investigated (amorphous SiO2 nanoparticles in the MALDI-ToF MS experiments, SiO2-coated QCM-D sensors and oxidised Si wafer for AFM).
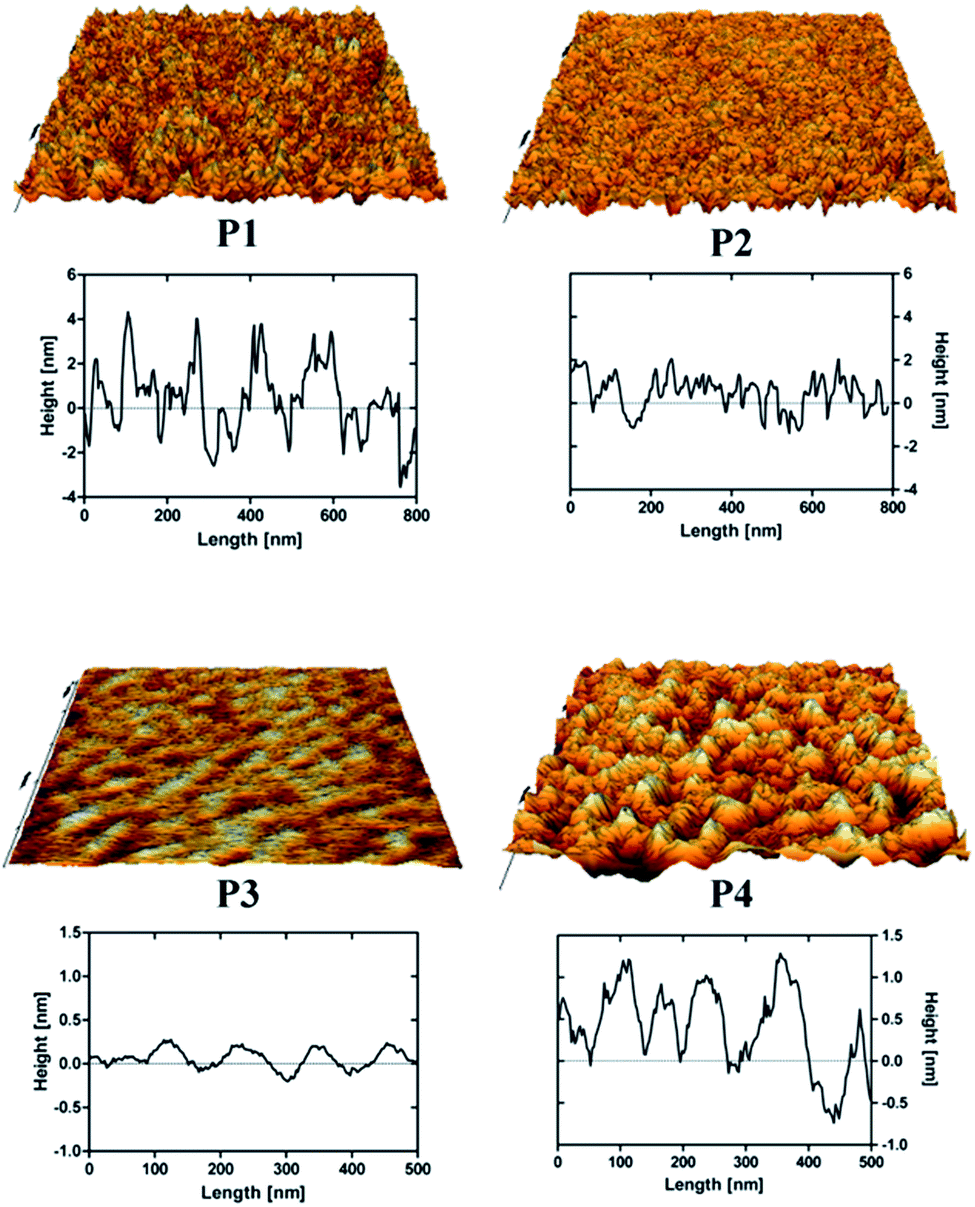 | ||
| Fig. 8 AFM 3D-rendered images and representative line sections of the peptides P1, P2, P3 and P4 adsorbed on an oxidised Si wafer (image areas 1 × 1 μm). The overall appearances and the height profiles of the peptide-adsorbed surfaces are comparable with previous AFM studies performed by other groups.29 | ||
Molecular dynamics simulations
In order to investigate a possible driving force for the adsorption of the P4 peptide, we performed all-atom molecular dynamics simulations using a realistic model of the natively oxidised Si surface and a carefully tuned force field for the SiOx/water/peptide interface.25 After placing the equilibrated peptide in proximity of the surface and starting constant-temperature simulations in explicit water solvents, it spontaneously adsorbed on the surface. Two principal adsorption sites are identified in several independent simulations carried out in order to explore different possible adsorbed peptide conformations (Fig. 9). Namely, (1) the negatively charged surface terminations attract polar residues, particularly the positively charged R residue as well as the N-terminal ammonium group. These groups reside in regions of increased water density at the surface, where they form hydrogen bonds with surface groups and physisorbed water molecules, similar to our previous findings of the interaction between RGD and RKLPDA peptides on oxidised Ti surfaces.26,39 Furthermore, (2) in almost all adsorbed conformations obtained in our simulations, P4 additionally binds to the surface via its two aromatic tryptophan residues, which lie above hydrophobic surface regions with decreased water density. In detail, the aromatic rings are able to form a stable anchor between the surface and patches of high water density, as displayed in Fig. 9. We could speculate that this “hydrophobic” adsorption mode may be prevented for the case of highly hydrophilic SiO2 nanoparticles, but not for flat oxidised Si wafer or QCM-D sensor surfaces.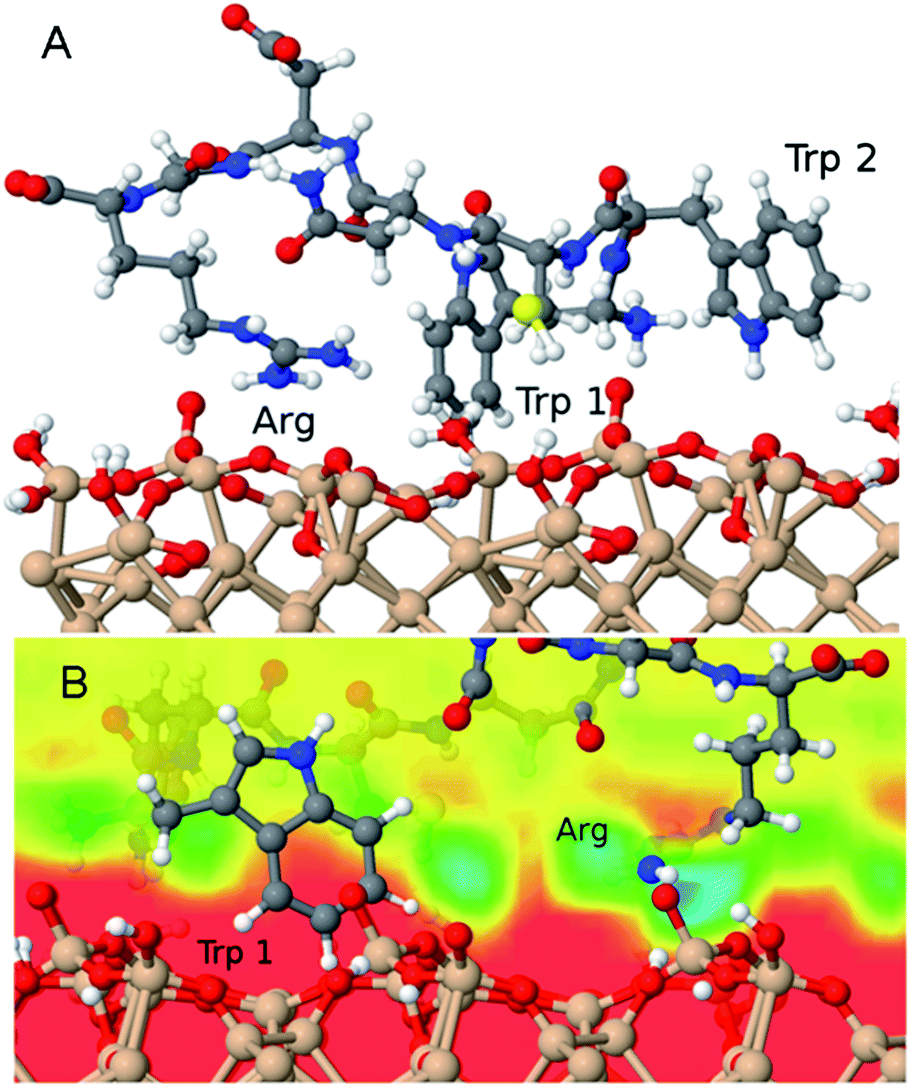 | ||
| Fig. 9 (A) Snapshot of a typical adsorbed configuration of the P4 (WWCNDGR) peptide on an oxidized Si surface model obtained in molecular dynamics simulations. (B) The interplay of the hydrophobic W (Trp) and hydrophilic R (Arg) residues with the local variations of the water density above the surface is displayed. The water density in the absence of peptides is shown as a colour map (red corresponds to zero and blue corresponds to high density) within a vertical plane that includes the Trp ring as well as the Arg side chains. | ||
Conclusions
MALDI-ToF mass spectrometry has been used in the past to detect the presence of proteins on material surfaces.1,14,16–19 We have shown here that it can be also exploited for qualitative investigation of the affinity and kinetics of adsorption of proteins and peptides on material surfaces. In particular, in our study we have used it to show that a plasma-SiO2 coating of borosilicate glass surfaces reduces the adsorption of peptides drastically with respect to uncoated surfaces (see Fig. 4). More importantly, it can enable an unbiased initial discrimination between strong and weak material-binding peptide sequences, starting from complex peptide mixtures (see Fig. 1 and 5). However, due to the large error bars intrinsic in the MALDI-ToF MS spectral analysis and to the numerous sources of uncertainty regarding specific surface affinity when working with peptide mixtures, its combination with more established and sensitive methods such as QCM-D remains unavoidable. Only via a combination of various methods we could clearly identify the sequence TPGSR as a novel strong SiO2-binding motif. In the case of other peptide sequences the MALDI-ToF MS prediction was not unequivocally confirmed by further analysis.In particular, the sequence WWCNDGR seems to be affined to certain types of silicon oxides (e.g. the native oxide layer of a Si wafer or the SiO2 coating of QCM-D sensor surfaces). Molecular dynamics simulations suggest that such affinity is most probably due to the peculiar properties of the oxidised Si surface to bind both hydrophilic (Arg) and hydrophobic (Trp) residues (see Fig. 9), as a consequence of the recognition capability of amino acid sequences for local variations of the water density at the solid/liquid interface.26
In summary, we conclude that the technique introduced in this work can provide an initial guess to guide the identification of strong vs. weak material binding peptides. It may be considered as a viable alternative to commonly used methods, such as phage display library screening, probably at the expense of quantitative selectivity, but gaining in rapidity and simplicity. This may be important in industrial applications when a quick assessment of the adsorption affinity of proteins or protein segments is required, such as during the development of anti-adherent coatings of pharmaceutical glass packaging for protein-based drugs.2
Moreover, the developed depletion assay can be used to estimate which regions (peptide sequences) of a larger protein can be expected to strongly bind to a certain material, thus giving an indication on the binding orientation over the surface.37 Finally, especially when used in combination with atomistic modelling, it can help rationalise fundamental mechanisms of material/peptide interaction and thus support a rational design and synthesis of novel hybrid biomaterials based on the biomolecular recognition of inorganic surfaces.
Acknowledgements
We would like to thank Holger Roehl (Schott AG) for providing us with the glass vials used in this study. We are grateful to Juergen Schluetter (LOT-Oriel) for helpful suggestions concerning the analysis of the QCM-D data. We acknowledge funding from the Deutsche Forschungsgemeinschaft (DFG) under the Emmy Noether grant CI 144/2 and from the EU-FP7-NMP grant 229205 “ADGLASS”.References
- P. Kingshott, H. A. W. St. John, R. C. Chatelier and H. J. Griesser, J. Biomed. Mater. Res., 2000, 49, 36–42 CrossRef CAS.
- A. Kraut, M. Marcellin, A. Adrait, L. Kuhn, M. Louwagie, S. Kieffer-Jaquinod, D. Lebert, C. D. Masselon, A. Dupuis, C. Bruley, M. Jaquinod, J. Garin and M. Gallagher-Gambarelli, J. Proteome Res., 2009, 8, 3778–3785 CrossRef CAS PubMed.
- S. D. Puckett, E. Taylor, T. Raimondo and T. J. Webster, Biomaterials, 2010, 31, 706–713 CrossRef CAS PubMed.
- T. Hayashi, K.-I. Sano, K. Shiba, Y. Kumashiro, K. Iwahori, I. Yamashita and M. Hara, Nano Lett., 2006, 6, 515–519 CrossRef CAS PubMed.
- S. Brown, Nat. Biotechnol., 1997, 15, 269–272 CrossRef CAS PubMed.
- S. R. Whaley, D. S. English, E. L. Hu, P. F. Barbara and A. M. Belcher, Nature, 2000, 405, 665–668 CrossRef CAS PubMed.
- K. Shiba, Curr. Opin. Biotechnol., 2010, 21, 412–425 CrossRef CAS PubMed.
- M. Sarikaya, C. Tamerler, A. K.-Y. Jen, K. Schulten and F. Baneyx, Nat. Mater., 2003, 2, 577–585 CrossRef CAS PubMed.
- K. T. Nam, D.-W. Kim, P. J. Yoo, C.-Y. Chiang, N. Meethong, P. T. Hammond, Y.-M. Chiang and A. M. Belcher, Science, 2006, 312, 885–888 CrossRef CAS PubMed.
- H. V. Demir, U. O. S. Seker, G. Zengin, E. Mutlugun, E. Sari, C. Tamerler and M. Sarikaya, ACS Nano, 2011, 5, 2735–2741 CrossRef CAS PubMed.
- Z. Kuang, S. N. Kim, W. J. Crookes-Goodson, B. L. Farmer and R. R. Naik, ACS Nano, 2010, 4, 452–458 CrossRef CAS PubMed.
- D. Khatayevich, M. Gungormus, H. Yazici, C. So, S. Cetinel, H. Ma, A. Jen, C. Tamerler and M. Sarikaya, Acta Biomater., 2010, 6, 4634–4641 CrossRef CAS PubMed.
- B. R. Peelle, E. M. Krauland, K. D. Wittrup and A. M. Belcher, Langmuir, 2005, 21, 6929–6933 CrossRef CAS PubMed.
- A. Doucette, D. Craft and L. Li, Anal. Chem., 2000, 72, 3355–3362 CrossRef CAS.
- K. Agrawal and H.-F. Wu, Rapid Commun. Mass Spectrom., 2008, 22, 283–290 CrossRef CAS PubMed.
- H. J. Griesser, P. Kingshott, S. L. McArthur, K. M. McLean, G. R. Kinsel and R. B. Timmons, Biomaterials, 2004, 25, 4861–4875 CrossRef CAS PubMed.
- K. M. McLean, S. L. McArthur, R. C. Chatelier, P. Kingshott and H. J. Griesser, Colloids Surf., B, 2000, 17, 23–35 CrossRef CAS.
- P. Kingshott, H. A. W. St John and H. J. Griesser, Anal. Biochem., 1999, 273, 156–162 CrossRef CAS PubMed.
- E. M. Leize, E. J. Leize, C. Leize, J.-C. Voegel and A. V. Dorsselaer, Anal. Biochem., 1999, 272, 19–25 CrossRef CAS PubMed.
- S. L. McArthur, K. M. McLean, H. A. W. St John and H. J. Griesser, Biomaterials, 2001, 22, 3295–3304 CrossRef CAS.
- The protein protocols handbook, ed. J. M. Walker, Humana Press, 2nd edn, 2002 Search PubMed.
- Applied Biosystems, 09/2002: User Bulletin no. 33: FastMoc™ Chemistry: HBTU Activation in Peptide Synthesis on the Model 4331A.
- W. D. Cornell, P. Cieplak, C. I. Bayly, I. R. Gould, K. M. Merz Jr, D. M. Ferguson, D. C. Spellmeyer, T. Fox, J. W. Caldwell and P. A. Kollman, J. Am. Chem. Soc., 1995, 117, 5179–5197 CrossRef CAS.
- D. J. Cole, G. Csányi, M. C. Payne, S. M. Spearing and L. Colombi Ciacchi, J. Chem. Phys., 2007, 127, 204704–204715 CrossRef PubMed.
- A. Butenuth, G. Moras, J. Schneider, M. Koleini, S. Köppen, R. Meissner, L. B. Wright, T. R. Walsh and L. Colombi Ciacchi, Phys. Status Solidi B, 2012, 249, 292–305 CrossRef CAS.
- J. Schneider and L. Colombi Ciacchi, J. Am. Chem. Soc., 2012, 134, 2407–2413 CrossRef CAS PubMed.
- L. Colombi Ciacchi and M. C. Payne, Phys. Rev. Lett., 2005, 96, 196101–196104 CrossRef.
- L. Colombi Ciacchi, D. J. Cole, M. C. Payne and P. Gumbsch, J. Phys. Chem. C, 2008, 112, 12077–12080 CAS.
- S. J. Plimpton, J. Comput. Phys., 1995, 117, 1–19 CrossRef CAS.
- D. N. Perkins, D. J. C. Pappin, D. M. Creasy and J. S. Cottrell, Electrophoresis, 1999, 20, 3551–3567 CrossRef CAS.
- M. Walther, M. Heming and M. Spallek, Surf. Coat. Technol., 1996, 80, 200–202 CrossRef CAS.
- E. E. Oren, C. Tamerler, D. Sahin, M. Hnilova, U. O. S. Seker, M. Sarikaya and R. Samudrala, Bioinformatics, 2007, 23, 2816–2822 CrossRef CAS PubMed.
- E. E. Oren, R. Notman, I. W. Kim, J. S. Evans, T. R. Walsh, R. Samudrala, C. Tamerler and M. Sarikaya, Langmuir, 2010, 26, 11003–11009 CrossRef CAS PubMed.
- K. Richter, G. Diaconu, K. Rischka, M. Amkreuz, F. A. Müller and A. Hartwig, Bioinspired, Biomimetic and Nanomaterials, 2012, vol. 2, pp. 45–53 Search PubMed.
- T. Cedervall, I. Lynch, S. Lindman, T. Berggard, E. Thulin, H. Nilsson, K. A. Dawson and S. Linse, Proc. Natl. Acad. Sci. U. S. A., 2007, 104, 2050–2055 CrossRef CAS PubMed.
- S.-Y. Jung, S.-M. Lim, F. Albertorio, G. Kim, M. C. Gurau, R. D. Yang, M. A. Holden and P. S. Cremer, J. Am. Chem. Soc., 2003, 125, 12782–12786 CrossRef CAS PubMed.
- M. Lundqvist, C. Andresen, S. Christensson, S. Johansson, M. Karlsson, K. Broo and B.-H. Jonsson, Langmuir, 2005, 21, 11903–11906 CrossRef CAS PubMed.
- O. Mermut and D. C. Phillips, J. Am. Chem. Soc., 2006, 128, 3598–3607 CrossRef CAS PubMed.
- J. Schneider and L. Colombi Ciacchi, J. Chem. Theory Comput., 2011, 7, 473–484 CrossRef CAS.
Footnote |
| † Electronic supplementary information (ESI) available. See DOI: 10.1039/c3ay42042f |
| This journal is © The Royal Society of Chemistry 2014 |