 Open Access Article
A formaldehyde trace gas sensor based on a thermoelectrically cooled CW-DFB quantum cascade laser
Jingsong
Li
*ab,
Uwe
Parchatka
a and
Horst
Fischer
a
aDepartment of Atmospheric Chemistry, Max Planck Institute for Chemistry, Hahn-Meitner-Weg 1, 55128 Mainz, Germany. E-mail: ljs0625@126.com; Fax: +49 (0)6131 305-4009; Tel: +49 (0)61313-05-4341
bKey Laboratory of Opto-Electronic Information Acquisition and Manipulation of Ministry of Education, Anhui University, Hefei, 230601, China
First published on 3rd April 2014
Abstract
We report the development of a trace gas sensor for the detection of atmospheric formaldehyde utilizing a thermoelectrically cooled distributed-feedback quantum cascade laser operating in continuous-wave mode at 5.68 μm. Wavelength modulation spectroscopy was combined with second harmonic detection and zero air based background subtraction techniques to enhance both detection sensitivity and precision to ∼2.5 ppbv for H2CO measurement with an integration time of less than 1 second and a 36 m optical path length. A novel analysis technique based on wavelet transform for noise reduction was successfully applied to improve the sensor performance, yielding sub-ppb measurement precision without reducing the fast temporal response.
Introduction
In the atmosphere, the measurement of trace gas concentrations can be important in deducing air mass origins, tracer transport pathways, and photochemical processing. For example, formaldehyde (H2CO, CH2O or HCHO) is an important intermediate in photooxidation processes of many hydrocarbons and thus plays a central role in understanding the chemical mechanisms that impact the oxidative capacity of the atmosphere. Ambient mixing ratios of H2CO are normally in the sub-ppbv to ppbv range. Therefore, high precision and sensitivity are often required to detect small changes in mixing ratios and subtle changes in air mass origin. In the free troposphere, formaldehyde mixing ratios are dominated by the oxidation of methane (CH4) resulting in H2CO mixing ratios often of the order of a few hundred parts per trillion by volume (pptv). Accurate H2CO measurements in the troposphere are very useful for evaluating our understanding of the mechanistic details of tropospheric photochemistry, as well as for the validation and refinement of photochemical models of the troposphere.Both the 3.5 and 5.7 μm spectral regions of H2CO absorption bands can be used for the optical spectroscopy detection of this molecule in the atmosphere,1 since they cover the strong ν1, ν2 and ν5 fundamental vibration bands centred at 2785, 1750 and 2850 cm−1, respectively. Measurements of H2CO in tropospheric air using tunable diode laser absorption spectroscopy (TDLAS) were first presented in the early 1980s by utilizing lead-salt lasers.2 Since then, lead-salt laser based TDLAS measurements of H2CO in the upper troposphere aboard aircrafts have also been reported by the Fried group3 at the National Center for Atmospheric Research, USA and the Fischer group4 at the Max Planck Institute for Chemistry, Germany using the 2831.64 cm−1 ro-vibrational line of the ν5 band and the 1766.32 cm−1 ro-vibrational line of the ν2 band, respectively. Due to the limits in the power, noise and stability, as well as cryogenic cooling requirement of the lead salt lasers (typically below 130 K), detection limit and duty cycle were seriously limited. Moreover, Fourier-transform infrared spectroscopy (FTIR) and differential optical absorption spectroscopy (DOAS) based instruments,5,6 as well as CO-overtone sideband lasers,7 difference-frequency generation (DFG)8 and optical parametric oscillator (OPO) based spectrometers9 have also been developed for atmospheric formaldehyde detection. However, the large size, high weight and complexity of these traditional laser source based instruments have limited their applications in some cases for real-time and in situ measurements of atmospheric trace gases, where size, weight and power are very critical.
The newly developed Quantum Cascade Lasers (QCLs) offer the advantages of long lifetime, high power, compactness and robustness, which make instruments based on these laser sources very suitable for long term in situ and on-line real time measurements of atmospheric trace gases.10–14 Compared to some traditional mid-IR laser sources, QCLs overcome many drawbacks, for example, the cryogenic cooling requirement and low power of lead salt diode lasers, the lack of continuous wavelength tunability, the large size and weight of gas lasers (e.g., CO and CO2), as well as the complexity of coherent sources based upon DFG and OPO. Therefore, several spectroscopic approaches utilizing QCLs for the optical sensing of atmospheric H2CO in laboratory have recently been developed, such as photoacoustic spectroscopy15 and optical-feedback cavity-enhanced absorption spectroscopy.16 In the past, our group has also developed various QCL-based instruments (QLAS17 and TRISTAR18) for simultaneous measurements of multitude of trace gases (e.g., CO, H2CO, CH4, and N2O) on various aircrafts to study exchange across the tropopause and tropospheric chemistry. Although these instruments have been used successfully over more than 500 flight hours, they suffer from their use of liquid nitrogen (LN2) for cooling purposes, which limits their operation time and causes instrument drifts due to the dependency of the boiling temperature of LN2 on the changing cabin pressure inside the aircraft. An alternative approach to avoid these drawbacks is to use room temperature (RT) QCL light sources operating in continuous-wave (CW) mode, which exhibit significant advantages over pulsed QCLs.19 In this paper, we report the development of a CW near the RT QCL based spectrometer for tropospheric H2CO measurements. High sensitive wavelength modulation spectroscopy and zero air based background subtraction techniques were used to enhance detection sensitivity and measurement precision. A novel analysis technique based on wavelet transform for noise reduction was also applied to further improve the sensor performance. A preliminary evaluation of the instrument performance under laboratory conditions was performed by consecutive measurements of a H2CO calibration sample over several days with a high temporal resolution (<1 s).
Experimental
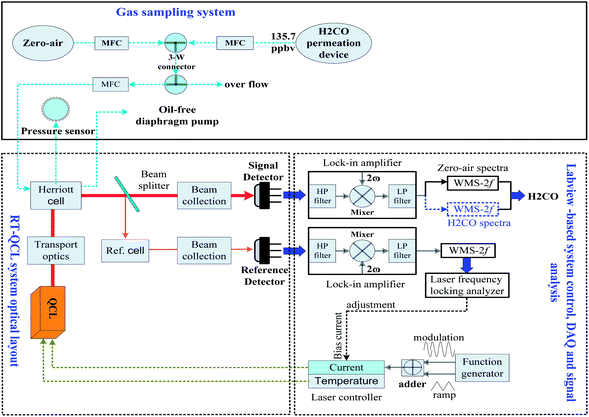
The experimental set-up is depicted in Fig. 1. The spectrometer system consists of an astigmatic Herriott cell, a commercial distributed feedback (DFB) QCL supplied by Alpes Lasers (Switzerland), two TE-cooled mercury cadmium telluride (MCT) infrared detectors, a sophisticated optical set-up for optical stirring and electronic modules,20 which are similar to our original system, with only minor modifications to adjust the operating conditions of the current system. Details of the optical and electronic modules have been described previously.21 Here, only a brief overview will be presented.The diverging QCL beam is first collected and collimated by a mirror objective made up of two flat mirrors and a 26° off-axis ellipsoid (OAE) with 40 mm and 140 mm focal distances, which is adjustable in three orthogonal axes. Then a series of flat mirrors, OAE and off-axis parabolic (OAP) mirrors, that further transfer and convert the diverging beam emitted from the laser into a parallel beam of 14 mm diameter that is subsequently coupled into a 0.3 litre volume multi-pass cell (Aerodyne Research Inc., Model AMAC-36). The configuration of the astigmatic folding optics allows for a 36 m optical path length within the 20 cm long Herriott cell. Finally, the out-coming beam is collected and focused onto a TE-cooled mercury cadmium telluride (MCT) infrared detector (PVI-4TE-6, Vigo Systems) via OAPs. Another fraction of the beam reflected from the beam splitter (BS) is directed through a short reference cell (3.5 cm) with pure H2CO and also collected and imaged onto a second similar detector for active controlling of the laser wavelength (i.e., frequency locking). The reference path can also be used to determine the laser tuning rate by inserting a Ge-etalon (FSR = 0.0311 cm−1).
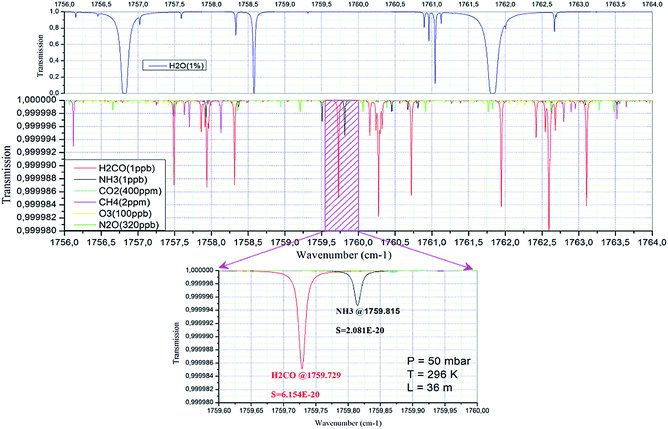
A commercial laser temperature and current controller (Thorlabs Inc., model ITC110) was modified to set the operation conditions for the wavelength tuning of the QCL. The QCL has a tuning range of 1756.4–1763.1 cm−1 over a temperature range of 243–268 K with a power range of 0.1–1.8 mW. The H2CO ro-vibrational absorption line at 1759.72869 cm−1 of the ν2 band was chosen for the present experiments, because it exhibits the smallest overlap with absorption lines from other molecules, especially water vapor, as shown in Fig. 2. For this wavelength, the laser was operated at ∼253 K. The DFB-QCL emitting in the 5.68 μm wavelength range and operating in CW mode was mounted inside a thermoelectrically cooled housing (Alpes LLH-100) equipped with a thermoelectric Peltier cooler. In order to reach the operational temperature (i.e., 253 K), a circulating alcohol cooling system (Julabo F20) was used for removing heat inside the laser housing produced by the Peltier cooler.
Wavelength modulation spectroscopy (WMS) combined with a second-harmonic (2f) detection technique and a background subtraction procedure to suppress optical noise (fringes) was employed to improve the system's performance. By pumping the atmospheric sample rapidly through a low-pressure cell (approximately 50 mbar), the width of the pressure-broadened absorption line is reduced and overlap with other absorptions in air is minimized, resulting in excellent specificity. To acquire WMS signals, the combination of a low frequency triangle ramp (61 Hz) for wavelength tuning and a high frequency sinusoidal modulation (31.5 kHz) was supplied to the QCL as additions to the injection current and the second harmonic signal was demodulated at the double modulation frequency using a digital lock-in amplifier programmed with Labview software.
To make a portable and field deployable system, we used a NI (National Instrument) compact cRIO-9114 chassis, which employs a real time processor and FPGA (Field-Programmable Gate Array) for laser control, data acquisition and real-time analysis of acquired spectra. A standalone program and graphical user interface based-on Labview software were developed to run on the FPGA using a laptop linked via a local area network. Generally, the spectra were averaged from multi-sequential laser scans (∼0.9 s) to improve the signal-to-noise ratio (SNR), and stored on the acquisition board for post-signal processing.
Results and discussion
Repeated measurements under the same experimental conditions were used to estimate the sensor precision and sensitivity. To perform background subtraction, the sampling protocol (see Fig. 1) involved alternately measuring zero-air for 1 min and a diluted H2CO sample from a permeation source for 9 min, respectively. Considering the sampling delay, only the zero-air spectra recorded in the final 50 s during each 10 min measurement period were averaged and used as the background spectra to retrieve H2CO concentrations. The background spectrum was subtracted from both sample and calibration spectra before fitting to determine the mixing ratio. The fitting procedure is carried out over the entire 2f signal profile by using a multiple linear regression scheme.22A calibration mixture with a H2CO concentration of 135.7 ppbv was produced by mixing the flow of a H2CO permeation source with zero air gas. The permeation rate of the H2CO standard used in this study was calibrated by the chromotropic acid method. This photometric technique as described by Harris et al.23 has been extensively reevaluated and significantly improved so that a total uncertainty in the calibration mixture of less than 5% could be achieved. Gas mixture samples from the permeation source were continuously collected via a 1/4 inch PFA Teflon tube and passed through the multi-pass absorption cell, with a controlled flow rate of 1.2 slm (standard litres min−1), using an oil-free scroll pump. The loss of H2CO in the sampling line made of Teflon has been verified to be not significant.24
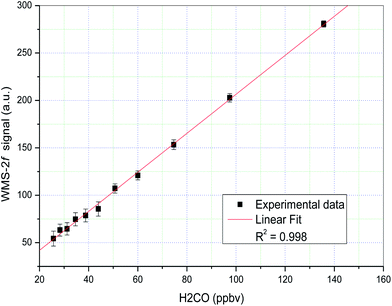
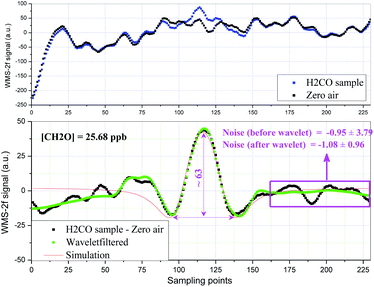
The linearity of the QCL sensor for H2CO concentrations ranging from 25.68 to 135.7 ppbv was checked in the laboratory. The WMS-2f signals at each concentration step were recorded over several hours, and the mean values and deviations are plotted in Fig. 3. The solid line is a linear fit of the data, a very good linear relationship (R2 = 0.998) between the WMS-2f signal and H2CO concentration was observed. When using WMS, the sensitivity of a spectrometer is often determined from the signal-to-noise ratio by dividing the peak-to-peak amplitude of the WMS signal of an absorption line with the noise level.25 A 1-s averaged WMS-2f H2CO signal (25.68 ppbv) and a zero air background signal are presented in Fig. 4 (upper panel). As we can see, it is almost impossible to distinguish the WMS-2f absorption signal profile from the background signal, but is clearly identifiable after background subtraction (Fig. 4, lower panel). The minimum concentration that can be detected by the spectrometer is determined by the S/N ratio, where S is the WMS-2f signal and N the noise level. By regarding the standard deviation of the non-absorbing baseline region of the measured WMS-2f signal as the noise (background) level, a sensitivity of the order of ∼1.6 ppbv (SNR = 1) formaldehyde at a concentration level of 25.68 ppbv was found after background subtraction as shown in Fig. 4 (lower panel), which is less than the mean standard deviation (2.5 ppbv, 1σ) determined from the reproducibility of the zero air measurements during the entire calibration measurement period. Indeed, due to the variation of each spectral background structure, the detection limit estimated from zero air should be more credible than that determined from a single spectrum signal, thus it should finally be adopted in this work. To further improve the spectral S/N, a novel digital signal processing algorithm based-upon wavelet transform (WT) developed in our group has been employed for additional noise reduction.26 Unlike the traditional Fourier transform which considers only a single set of basis functions (sines or cosines), WT uses an infinite set of possible basis functions (i.e., mother wavelets) with different properties that are both localized in the time and frequency domains. Because of this property, both time and frequency characteristics of the signal can be captured in WT. Although there are many types of wavelets, we restrict ourselves in this study to Daubechies and Symmlet family wavelets by Stein thresholding policy, due to their relatively better performance by large numbers of simulated tests and comparison. Moreover, the simulated WMS-2f signal according to the experimental conditions and spectroscopic parameters taken from HITRAN database is also given in Fig. 4. Note that the slight asymmetric profile in the left wing is mainly due to the background drift. As can be seen, after the application of the wavelet filter, the noisy signal becomes smoother. Also note that the wavelet de-noised signal keeps its original spectral features without any distortion relative to the simulated signal. It greatly improves the spectral SNR yielding an enhancement factor of 4. In this study, the effect of the optical interference fringes inherent to multi-pass cells is a major problem that limits the current system performance. It is worth noting that no special effort was made to thermally control the optical system, therefore, the background subtraction method suffers from changing interference fringes due to temperature changes.
Fig. 5 shows an example of a time series of H2CO concentration data obtained from a continuous, one-hour measurement interval from the permeation source using WMS-2f detection and zero air based background subtraction. During this time window, we obtain a measurement precision of ∼2.2 ppbv with a 1 Hz sampling rate based on the reproducibility of the standard measurement. Indeed, we investigated similar tests on a longer time scale of tens of hours, a replicate precision of 2.4 ppbv on average was obtained. Generally, utilization of wavelet filtering improves the spectral SNR, minimizes the dispersion of concentration values, and yields an improvement of the precision by a factor of 3.5 without reducing the fast temporal response. For achieving optimal performance in practical applications, drifts in the optical system, including the laser source itself, must be minimized by utilizing a temperature controlled enclosure so that the optical background is stable over the measurement period used to acquire both the ambient and background information. Therefore, the short-term stability was investigated by applying the Allan variance technique on a concentration time series.27 The optimum integration time ranges between 80 s and 90 s as shown in Fig. 6, corresponding to a precision of ∼0.34 ppbv on average. From this figure, we also can see that at least 10 s averaging time is required to obtain the same precision level (i.e., 0.63 ppbv) achieved by using wavelet filtering. As performed here, the results can be further averaged into longer time intervals determined based upon instrument optimal stability times to improve measurement precision, but at the expense of a good time resolution for field applications. The detection limit reported here indicates a potential application for monitoring in polluted urban environments, but is poorer than required for unpolluted tropospheric H2CO measurements, mainly limited by the changing etalon fringes due to a lack of thermally controlling the optical system and the low laser power. Generally, a sealed and temperature controlled enclosure for the whole system is possible to further remove the influence of the temperature-dependent etalon effect. Moreover, the etalon interference effect could be more effectively eliminated if a mother wavelet to describe the characteristics of the optical fringes appropriately would be available or could be modelled. Currently we are focusing on this issue.
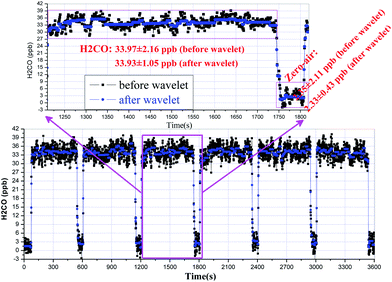 | ||
| Fig. 5 Alternating measurements of H2CO from a permeation source (∼34 ppbv) and zero air during a 1 h period at 1 Hz sampling rate, and the application of a wavelet filter. | ||
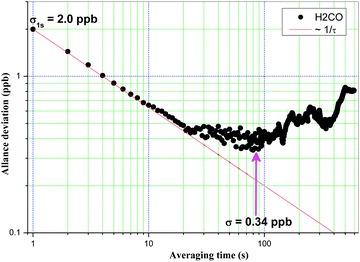 | ||
| Fig. 6 Allan variance plot of H2CO. The solid line indicates the Allan variance that is estimated by only white noise. | ||
Conclusions
We have developed and demonstrated a high-sensitivity near room-temperature CW-QCL sensor for the detection of ppbv levels (1 Hz sampling rate) of H2CO near 5.68 μm. The detection limit reported here is slightly higher than required for unpolluted tropospheric H2CO concentrations. The accuracy of the H2CO sensor system is limited primarily by the accuracy of the empirical calibrations, i.e., the accuracy of H2CO permeation sources. The described QCL sensor offers excellent time resolution on the order of seconds and permits unattended continuous operation for long periods of time. The inherent maintenance-free design of the CW-RT-QCL-based spectrometer and the capability of remotely controllable computerized operation make such instrumentation a convenient, robust tool for mobile H2CO trace-gas detection in polluted urban locations. This instrument can be easily adapted to other trace gases by changing the QCL chip and the corresponding detector. In particular, HITRAN simulations predict that NH3 could be simultaneously measured with formaldehyde in the same spectral region of this work (see Fig. 2).In the present configuration, the main sources of the instrument drift are believed to be temperature induced changes (interference fringes) in the optical alignment, temperature drifts of the electronic components affecting laser power and temperature of the laser itself, which strongly limits the performances of the background subtraction method used here. The second problem is related to the low SNR of the detector signals, which is related to the low laser power available. For field applications, work is currently in progress to improve the system performances in terms of sensitivity and precision. In this respect, better performance is expected by using a sealed and temperature controlled enclosure for the whole system, a longer path absorption cell, as well as the utilization of real-time digital filtering techniques and high power QCL light sources.16
Acknowledgements
The authors gratefully acknowledge the anonymous reviewers and the editors for their valuable comments and suggestions to improve the quality of the paper. Jingsong Li would like to thank Andreas Reiffs and Raoul Axinte for useful discussion on preparation of the H2CO permeation source.Notes and references
- L. S. Rothman, I. E. Gordon, A. Barbe, D. C. Benner, P. F. Bernath, M. Birk, V. Boudon, L. R. Brown, A. Campargue and J. P. Champion, et al. , J. Quant. Spectrosc. Radiat. Transfer, 2009, 110, 533 CrossRef CAS PubMed.
- H. I. Schiff, D. R. Hastie, G. I. Mackay, T. Iguchi and B. A. Ridley, Environ. Sci. Technol., 1983, 17, 352A CAS.
- A. Fried, B. Henry, B. Wert, S. Sewell and J. R. Drummond, Appl. Phys. B, 1998, 67, 317 CrossRef CAS.
- V. Wagner, C. Schiller and H. Fischer, J. Geophys. Res., 2001, 106, 28529 CrossRef CAS.
- D. R. Lawson, H. W. Biermann, E. C. Tuazon, A. M. Winer, G. I.Mackay, H. I. Schiff, G. L. Kok, P. K. Dasgupta and K. Fung, Aerosol Sci. Technol., 1990, 12, 64 CrossRef.
- T. Gilpin, E. Apel, A. Fried, B. Wert, J. Calvert, Z. Genfa, P. Dasgupta, J. Harder, B. Heikes, B. Hopkins, H. Westberg, T. Kleindienst, Y. N. Lee, X. Zhou, W. Lonneman and S. Sewell, J. Geophys. Res., 1990, 102, 21161 CrossRef.
- H. Dahnke, G. Von Basum, K. Kleinermanns, P. Hering and M. Mürtz, Appl. Phys. B, 2002, 75, 311 CrossRef CAS.
- D. Rehle, D. Leleux, M. Erdelyi, F. K. Tittel, M. P. Fraser and S. Friedfeld, Appl. Phys. B, 2001, 72, 947 CrossRef CAS.
- M. Angelmahr, A. Miklós and P. Hess, Appl. Phys. B, 2006, 85, 285 CrossRef CAS PubMed.
- C. R. Webster, G. J. Flesch, D. C. Scott, J. Swanson, R. D. May, W. S. Woodward, C. Gmachl, F. Capasso, D. L. Sivco, J. N. Baillargeon, A. L. Hutchinson and A. Y. Cho, Appl. Opt., 2001, 40, 321 CrossRef CAS.
- D. S. Sayres, E. J. Moyer, T. F. Hanisco, J. M. St. Clair, F. N. Keutsch, A. O'Brien, N. T. Allen, L. Lapson, J. N. Demusz, M. Rivero, T. Martin, M. Greenberg, C. Tuozzolo, G. S. Engel, J. H. Kroll, J. B. Paul and J. G. Anderson, Rev. Sci. Instrum., 2009, 80, 044102 CrossRef PubMed.
- R. Provencal, M. Gupta, T. G. Owano, D. S. Baer, K. N. Ricci, A. O'Keefe and J. R. Podolske, Appl. Opt., 2005, 44, 6712 CrossRef CAS.
- S. Wright, G. Duxbury and N. Langford, Appl. Phys. B, 2006, 85, 243 CrossRef CAS.
- K. G. Hay, S. Wright, G. Duxbury and N. Langford, Appl. Phys. B, 2008, 90, 329 CrossRef CAS.
- A. Elia, C. Di Franco, V. Spagnolo, P. M. Lugarà and G. Scamarcio, Sensors, 2009, 9, 2697 CrossRef CAS PubMed.
- P. Gorrotxategi-Carbajo, E. Fasci, I. Ventrillard, M. Carras, G. Maisons and D. Romanini, Appl. Phys. B, 2013, 110, 309 CrossRef CAS.
- R. Kormann, R. Königstedt, U. Parchatka, J. Lelieveld and H. Fischer, Rev. Sci. Instrum., 2005, 76, 075102 CrossRef PubMed.
- C. L. Schiller, H. Bozem, C. Gurk, U. Parchatka, R. Königstedt, G. W. Harris, J. Lelieveld and H. Fischer, Appl. Phys. B, 2008, 92, 419 CrossRef CAS PubMed.
- J. B. McManus, D. D. Nelson, S. C. Herndon, J. H. Shorter, M. S. Zahniser, S. Blaser, L. Hvozdara, A. Muller, M. Giovannini and J. Faist, Appl. Phys. B, 2006, 85, 235 CrossRef CAS PubMed.
- R. Kormann and H. Fischer, Proc. SPIE, 1999, 3758, 162 CrossRef CAS PubMed.
- J. S. Li, U. Parchatka, R. Königstedt and H. Fischer, Opt. Express, 2012, 20, 7590 CrossRef CAS PubMed.
- P. Werle, P. Mazzinghi, F. D'Amato, M. De Rosa, K. Maurer and F. Slemr, Spectrochim. Acta, Part A, 2004, 60, 1685 CrossRef CAS PubMed.
- G. W. Harris, G. I. Mackay, T. Iguchi, L. K. Mayne and H. I. Schiff, J. Atmos. Chem., 1989, 8, 119 CrossRef CAS.
- P. Wert, A. Fried, B. Henry and S. Cartier, J. Geophys. Res., 2002, 107, 4163 CrossRef.
- K. Namjou, S. Cai, E. A. Whittaker, J. Faist, C. Gmachl, F. Capasso, D. L. Sivco and A. Y. Cho, Opt. Lett., 1998, 23, 219 CrossRef CAS.
- J. S. Li, U. Parchatka and H. Fischer, Appl. Phys. B, 2012, 108, 951 CrossRef CAS.
- P. Werle, R. Mucke and F. Slemr, Appl. Phys. B, 1993, 57, 131 CrossRef.
| This journal is © The Royal Society of Chemistry 2014 |

