Enrichment and analysis of typically persistent organic pollutants at trace level using micro-solid phase extraction based on titanium dioxide nanotube arrays
Qingxiang
Zhou
*ab,
Wei
Wu
b,
Guohong
Xie
c and
Yunrui
Huang
d
aCollege of Geosciences, China University of Petroleum Beijing, Beijing 102249, China. E-mail: zhouqx@cup.edu.cn; zhouqx@henannu.edu.cn; Fax: +86-10-89732300; Tel: +86-10-89732300
bSchool of Chemistry and Environmental Sciences, Henan Normal University, Xinxiang 453007, PR China
cCollege of Resources and Environment, Henan Institute of Science and Technology, Xinxiang 453003, China
dCollege of Chemistry and Pharmacy Engineering, Nanyang Normal University, Nanyang, 473061, China
First published on 15th October 2013
Abstract
In present study, a micro-solid phase extraction with highly ordered titanium dioxide nanotube arrays as the adsorbent was developed for the enrichment and determination of eight persistent organic pollutants including heptachlor, heptachlor-epoxide, α-endosulfan, dieldrin, endrin, β-endosulfan, endosulfan sulfate and methoxychlor. The optimal conditions were as follows: elutant solvent, dichloromethane; cetyltrimethyl ammonium bromide (CTAB), 900 μL; extraction time, 40 min; desorption time, 5 min: sample pH, pH 7. The results showed that eight target persistent organic pollutants were successfully enriched and good limits of detection in the range of 0.018–0.19 μg L−1 were achieved. The precision of the proposed method was in the range 4.6–8.5% (RSD, n = 6). Analysis of genuine environmental water samples resulted in good spiked recoveries in the range of 75.1–107%. Based on these results, the titanium dioxide nanotube array demonstrated its advantages for enrichment and separation, and we predict it will be of great value in the development of new preconcentration and determination methods for other pollutants.
1. Introduction
Persistent organic pollutants are important environmental pollutants and have received much attention due to the threat they pose to the environment and human health. The persistent organic pollutants, heptachlor, dieldrin, and endrin are toxic pesticides. Heptachlor-epoxide, α-endosulfan, β-endosulfan, endosulfan sulfate and methoxychlor are important pesticides and they also are well known for their toxicity to crop pests in agriculture applications and for their use to control mosquitoes, as well as for other applications. These pollutants may accumulate in the environment and can be very persistent, they are able to move long distances in surface runoff or groundwater. The pollutants are neurotoxicants and exposure may result in various diseases, therefore their significant use has resulted in environmental concerns.1–3 Although these pesticides have been banned for decades, the residual problems are still serious due to their persistence in the environment and the exent of their historical usage and the fact that these compounds are still detected in the environmental samples and foodstuffs.4 On this basis, there is an increasing demand to determine residues in environmental samples.5Up to now, many techniques have been developed for the analysis of the above mentioned pesticides. However, due to strict environmental legislation on pesticide residues and the demand for ultra-trace analysis, a preconcentration step is mandatory prior to measurement.6,7 Monitoring the trace levels of these target pesticides in water is important for human health protection and environmental control. So far, the most important techniques for pretreatment are liquid–liquid extraction (LLE), solid-phase extraction (SPE), stir bar sorptive extraction and solid phase microextraction (SPME), etc. SPE is a versatile technique that has been widely used in the environmental field8–16 since it was introduced due to its advantages of high recovery, short extraction time, high enrichment factor, low cost, and low consumption of organic solvents. Various solid-phase extraction sorbents, including polystyrene–divinylbenzene polymers, and various carbonaceous sorbents17–22 have been used. Up to now, in order to widen the application of the SPE, the development of new adsorbents is on-going.
Over the past years, TiO2 materials have received much attention and been used in many applications. Particularly, the occurrence of nanoscale TiO2 material has rekindled the interest of researchers. Specific TiO2 nanostructures have become the focus of considerable interest as they possess unique properties relevant to applications including water photolysis, solar energy cells, gas sensors, chemical sensing, photocatalysis, and photovoltaics,23–28etc. Several fabrication routes including anodic oxidation, electrochemical lithography, photoelectrochemical etching, sol–gel routes, hydrothermal synthesis, ultrasound assisted synthesis, solvothermal synthesis and template synthesis29–35 have been used to prepare nanometer-sized TiO2 tubules, wires, dots, and pillars. Highly ordered, vertically oriented TiO2 nanotube arrays have a large surface area, which means that they have many more adsorption sites for analytes, especially hydrophobic pollutants have good adsorption by electrostatic interaction or Van der Waals forces. For other substances TiO2 nanotube arrays also have great adsorption potential by simple modification. Our group has investigated the potential that TiO2 nanotube arrays have as an effective adsorbent for the enrichment and preconcentration of DDTs, HCHs, PAHs, PCBs and pyrethroid pesticides at trace level.36–39 Up to now, to the best of our knowledge, there are few reports found on the enrichment of typical persistent organic pollutants including heptachlor, heptachlor-epoxide, α-endosulfan, dieldrin, endrin, β-endosulfan, endosulfan sulfate, and methoxychlor with TiO2 nanotube arrays. In the present paper, the applicability of TiO2 nanotube arrays as adsorbents for micro-solid-phase extraction (μSPE) was investigated for the trapping of eight typical persistent organic pollutants including heptachlor, heptachlor-epoxide, α-endosulfan, dieldrin, endrin, β-endosulfan, endosulfan sulfate and methoxychlor.
2. Experimental
2.1 Reagents and materials
Heptachlor, heptachlor-epoxide, α-endosulfan, dieldrin, endrin, β-endosulfan, endosulfan sulfate and methoxychlor at a concentration of 100 μg mL−1 were obtained from Beijing Ruizhihanxing Chemical Science and Technology Co., Ltd. (Beijing, China). The working solutions with a concentration of 10 μg mL−1 were freshly prepared daily from stock solutions. Cetyltrimethyl ammonium bromide (CTAB) was purchased from Beijing Ruizhihanxing Chemical Science and Technology Co., Ltd (Beijing, China). HPLC grade methanol was obtained from Jiangsu Guoda Chemical Reagent Co., Ltd (Huaian, China). Ultrapure water was prepared in the laboratory using a Millipore (Billerica, MA, USA) water generator system and all the other solvents were analytical reagent grade unless stated. One percent (w/v) sodium hydroxide and 1 mol L−1 hydrochloric acid were used for adjusting the pH value of the water samples. All glassware used in the experiments was cleaned with pure water, then soaked in 6 mol L−1 nitric acid for 24 h and rinsed five times with ultrapure water before use. Titanium sheets (99.6% purity) was obtained from Beijing Hengli Taiye Co., Ltd. (Beijing, China), the Pt electrode was obtained from Shanghai Dianguang Device Factory. A 30 V potentiostat was obtained from The Fourth Wearless Factory of Shijiazhuang (JWY-30G, Shijiazhuang, China).2.2 Preparation of TiO2 nanotube array
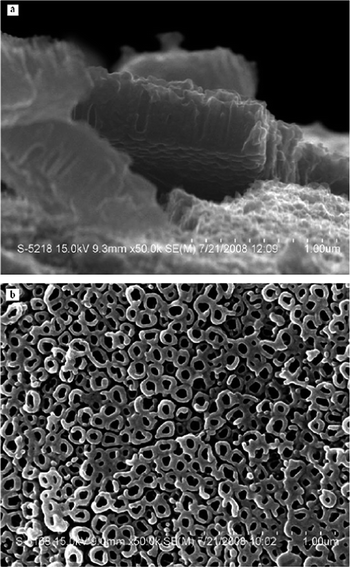
Titanium sheets (0.2 mm thick, 10 × 20 mm size) were polished with metallographic abrasive paper, and then degreased by sonication in acetone, methanol and ultrapure water, finally the sheets were air-dried. The anodic oxidation was accomplished using a titanium sheet as the anode and platinum as the cathode. The distance between two electrodes was 3 cm in all experiments. The electrolyte was composed of 0.14 mol L−1 sodium fluoride and 0.5 mol L−1 phosphoric acid. The anodic oxidation was carried out at 20 V for 1 h. After electrolysis, the titanium sheet was rinsed with ultrapure water and air-dried. The TiO2 nanotube arrays prepared were then analyzed with a field emission scanning electron microscope (S-4800 FESEM, Hitachi, Japan) (see Fig. 1).2.3 Micro-solid phase extraction procedure
The TiO2 nanotube array sheet was directly immersed into a 10 mL solution with a constant depth and then the sample vial was sealed. The extraction conditions were kept the same as the optimized conditions. A magnetic stirrer was used at a stirring rate of 500 rpm. After the equilibrium between adsorption and desorption was reached, the TiO2 nanotube array sheet was removed, rinsed with ultrapure water and then air-dried. Further the sheet was directly immersed in a small amount of dichloromethane in order to make the target analytes desorb completely. After 10 min, the TiO2 nanotube array sheet was removed, and the dichloromethane solution was dried with a mild stream of nitrogen gas. The residues were then dissolved in 100 μL of methanol. Finally, 1 μL of the solution was injected for GC analysis.2.4 GC analysis
An Agilent GC 7890 (Agilent, USA) equipped with a HP-5 column (30 m × 0.25 mm × 0.25 μm) and a Ni electron capture detector (μ-ECD) was used for the analysis and separation. The GC system was operated in a splitless mode. 1 μL of sample was injected. The oven temperature was maintained at 100 °C for 1 min, raised to 250 °C at a rate of 10 °C min−1 and held for 5 min, then programmed to 280 °C at 10 °C min−1 and held for 1 min. The injector was maintained at 260 °C and the detector was maintained at 300 °C, respectively. Nitrogen (purity >99.999%) was employed as the carrier gas at a flow rate of 1.0 mL min−1.2.5 Water samples
In this work, four environmental water samples, lake water, waste water, and river water were used for validating the proposed method. Lake water sample was collected from Donghu Lake in Xinxiang City, Henan province, China. The waste water sample was taken from Luotuowan in Xinxiang City, Henan Province, China. River water samples were collected from the White River in Nanyang City, Henan Province and the communist canal in Xinxiang City, Henan Province. All the collected water samples were filtered through 0.45 μm micropore membranes after sampling and were maintained in glass containers, then stored at a temperature of 4 °C.3. Results and discussion
3.1 Effect of the type of elutant
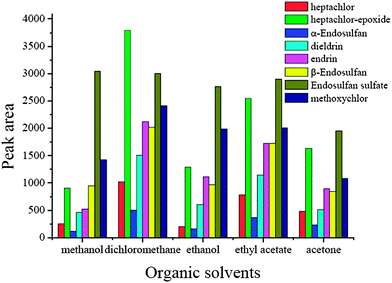
In this μSPE procedure, different desorption efficiency will be obtained when different solvents are used due to the different physical and chemical properties of the organic solvents and the characteristics of the target analytes. In this experiment, methanol, ethanol, acetone, n-hexane and dichloromethane were tested for desorption. The results are shown in Fig. 2. According to Fig. 2, it was observed that different solvents resulted in different desorption performances. Dichloromethane was the most effective solvent for all the analytes tested, and the elution performance of acetone was the lowest. Based on these considerations, dichloromethane was used as the elutant because of its high elution efficiency and ease of drying.3.2 Effect of volume of surfactant
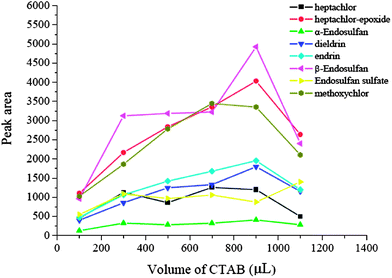
In most cases, the addition of surfactant will enhance the preconcentration performance and so it is an important factor in the method development procedure. In these experiments, it was investigated and CTAB was selected for use. The volume of CTAB was optimized in the range of 100–1100 μL. The experimental results are shown in Fig. 3. From Fig. 3, we can see that the extraction efficiencies of most of the analytes were improved significantly when the volume of CTAB increased from 100 μL to 900 μL. Further increase of CTAB resulted in the decrease of the extraction efficiencies because the micelles formed were found to be more than the limited amount of those adsorbed on to the nanotube array, and some of the analytes would therefore be trapped into the micelles, which remained in the sample solution and led to a decrease in the extraction efficiencies. Hence, 900 μL CTAB was used as the optimum concentration.3.3 Effect of extraction time
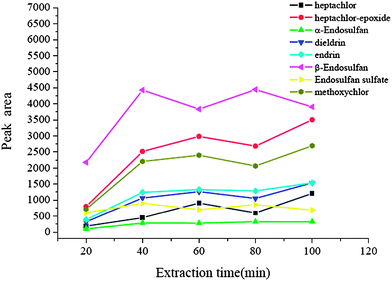
In solid phase extraction and other enrichment techniques, the extraction procedure needs a time interval to achieve the best extraction performance. In this new equilibrium extraction procedure, to reach equilibrium results in the largest amount of analytes to be adsorbed onto the surface of the array. So the equilibrium time may be considered as the extraction time, which determines the enrichment performance to be better or not. In order to achieve a reasonable extraction time, the effect of extraction time was studied over the time range of 20–100 min. The results are shown in Fig. 4. It was obvious that for all analytes, the extraction efficiency was improved significantly with increasing extraction time up to 40 min, and then no obvious change occurred. Hence 40 min was used as the extraction time.3.4 Effect of desorption time
The desorption of analytes from the adsorbent is a crucial procedure in solid phase adsorption techniques for extraction. In general, thermal desorption and solvent elution are the two most often used methods. Solvent elution is the most popular and key in the enrichment and cleanup of environmental samples. In this μSPE procedure, elution is also an equilibrium procedure, and so a time interval is needed to reach the desorption equilibrium for the target analytes. In order to desorb analytes completely, the effect of desorption time was investigated in the range of 2–20 min. The results demonstrated that the peak areas of the analytes increased with an increase of time in the range of 2–5 min, and then kept a relatively constant value when the time increased continuously from 5 to 20 min. So 5 min was selected as the desorption time.3.5 Effect of sample pH
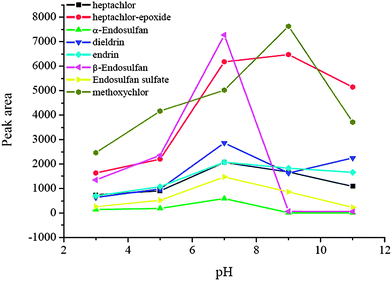
Sample pH plays an important role in the μSPE procedure because pH value determines the existing forms of the analytes, and further affects the extraction efficiency. In this experiment, the effect of sample pH on the enrichment was evaluated in a range of pH 3.0–11.0. The data are shown in Fig. 5. The peak areas of the analytes at pH 7.0 were the largest because the target analytes are not stable in strong acid and alkaline environments and it is difficult to extract them under these conditions. Therefore, pH 7.0 was used for the extraction in the subsequent experiments.3.6 Salting-out effect
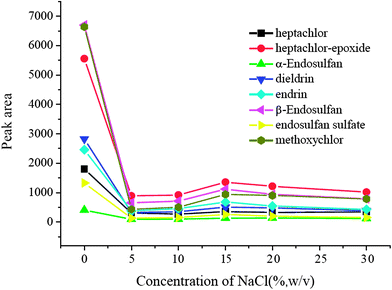
A salting-out effect was often an influencing factor in the extraction procedure, and it was optimized in the range of 0–30% (w/v). The results were exhibited in Fig. 6. It is obvious that the extraction performance without NaCl was much better than that with the addition of NaCl. The presence of salt did not result in significant positive changes in the extraction efficiencies of all target analytes and no NaCl was added in the following experiments.3.7 Analytical performance
The detection limits, precision and linear ranges were important parameters in evaluating the sensitivity and the stability of the proposed method. A series of experiments were designed to obtaining the related parameters. These data are shown in Table 1. It was found that there was excellent linearity in the range 0.1–50 ng mL−1 for heptachlor, heptachlor-epoxide, α-endosulfan, dieldrin, endrin and β-endosulfan, 0.05–50 ng mL−1 for endosulfan sulfate, and 0.5–100 ng mL−1 for methoxychlor, respectively. The limits of detection were in the range 0.018–0.19 ng mL−1 on the basis of a signal-to-noise ratio of 3 (S/N = 3), respectively. The reproducibility was obtained by six duplicate experiments. Based on these results, the proposed method provided much better LODs and higher stability, so it has excellent potential for the enrichment and determination of these analytes in real water samples.| Analyte | Linear range | R 2 | Precision (RSD%, n = 6) | LOD (μg L−1, S/N = 3) |
|---|---|---|---|---|
| Heptachlor | 0.1–50 | 0.9967 | 7.3 | 0.076 |
| Heptachlor-epoxide | 0.1–50 | 0.9943 | 6.5 | 0.04 |
| α-Endosulfan | 0.1–50 | 0.9932 | 6.2 | 0.074 |
| Dieldrin | 0.1–50 | 0.9915 | 4.6 | 0.078 |
| Endrin | 0.1–50 | 0.9927 | 6.8 | 0.03 |
| β-Endosulfan | 0.1–50 | 0.9964 | 6.4 | 0.04 |
| Endosulfan sulfate | 0.05–50 | 0.9909 | 8.5 | 0.018 |
| Methoxychlor | 0.5–100 | 0.9928 | 5.7 | 0.19 |
3.8 Analysis of real water samples
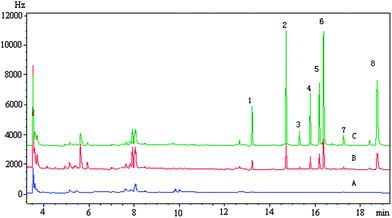
The proposed method has been applied to analyze four real environmental water samples, and the results are shown in Table 2. The results indicated that no target pesticides were found in the blank water samples. These samples were then spiked with target analytes at two different concentrations to investigate the effect of sample matrices. The spiked recoveries were satisfied in the range 75.1–107%. A typical chromatogram of a real water sample is shown in Fig. 7.| Analyte | Spiked level (ng mL−1) | Luotuowan Water | Donghu Lake | White River | Gongchanshuyi Canal |
|---|---|---|---|---|---|
| Heptachlor | 0 | — | — | — | — |
| 1 | 77.1 ± 3.8 | 79.2 ± 5.7 | 107.0 ± 1.4 | 85.5 ± 5.4 | |
| 4 | 85.4 ± 3.2 | 86.5 ± 5.2 | 105.1 ± 1.2 | 85.1 ± 5.3 | |
| Heptachlor-epoxide | 0 | — | — | — | — |
| 2.5 | 76.9 ± 3.4 | 89.8 ± 4.7 | 103.9 ± 1.2 | 86.5 ± 4.1 | |
| 10 | 81.9 ± 3.1 | 87.6 ± 5.4 | 106.2 ± 1.5 | 86.4 ± 2.6 | |
| α-Endosulfan | 0 | — | — | — | — |
| 0.5 | 85.4 ± 6.1 | 92.4 ± 1.3 | 97.8 ± 2.1 | 89.2 ± 2.2 | |
| 2 | 87.4 ± 4.2 | 93.6 ± 2.8 | 100.2 ± 1.4 | 89.1 ± 3.1 | |
| Dieldrin | 0 | — | — | — | — |
| 1 | 75.1 ± 2.8 | 88.6 ± 5.3 | 92.3 ± 1.1 | 77.4 ± 3.3 | |
| 4 | 77.5 ± 2.7 | 85.2 ± 5 | 103.5 ± 2.1 | 77.4 ± 4.6 | |
| Endrin | 0 | — | — | — | — |
| 2.5 | 83.9 ± 4.1 | 94.6 ± 6.5 | 94.2 ± 1.4 | 79.8 ± 3.9 | |
| 10 | 84.3 ± 3.3 | 89.3 ± 2.5 | 97.4 ± 3.1 | 88.6 ± 5.4 | |
| β-Endosulfan | 0 | — | — | — | — |
| 2.5 | 82.2 ± 2.1 | 75.4 ± 4.3 | 96.7 ± 4.9 | 89.6 ± 2.4 | |
| 10 | 83.9 ± 1.9 | 79.2 ± 3 | 99.7 ± 3.4 | 76.8 ± 2.9 | |
| Endosulfan sulfate | 0 | — | — | — | — |
| 0.4 | 86.1 ± 4.6 | 87.3 ± 5.2 | 87.3 ± 4.6 | 86.3 ± 4.7 | |
| 1 | 76.4 ± 1.9 | 76.8 ± 2.1 | 88.4 ± 3.8 | 76.3 ± 2.4 | |
| Methoxychlor | 0 | — | — | — | — |
| 5 | 84.6 ± 2.5 | 75.1 ± 3.8 | 88.2 ± 5.9 | 76.4 ± 3.2 | |
| 20 | 81.2 ± 2.2 | 84.3 ± 2.6 | 94.6 ± 4.7 | 84.3 ± 3.8 |
4. Conclusions
A TiO2 nanotube array was synthesized by anodic oxidation method, and was investigated as a method to enrich typical persistent organic pollutants such as heptachlor, heptachlor-epoxide, α-endosulfan, dieldrin, endrin, β-endosulfan, endosulfan sulfate and methoxychlor. The experimental results showed that TiO2 nanotube array had good adsorption ability for the above-mentioned pollutants and could be used as an effective micro-solid phase extraction material. The determination method based on micro-solid phase extraction with TiO2 nanotube array is simple, robust and sensitive, and achieved low LODs in the range 0.018–0.19 ng mL−1. The method was validated with real water samples and the spiked recoveries were in the range 75.1–107.0%. These results indicated that the TiO2 nanotube array is a promising sorbent and the method established could be an alternative tool for the determination of such pollutants in the environment.Acknowledgements
This work was financially supported by the Program for New Century Excellent Talents in University (NCET-10-0813) and the Science Foundation of China University of Petroleum, Beijing (KYJJ2012-01-15), the Special Fund of Nanyang Normal University (ZX2012011), and the Research Program of Application Foundation and Advanced Technology of Henan Province (no. 122300410177).References
- S. Hong, J. Y. Kim, J. Hwang, K. S. Shin and S. J. Kang, Biochem. Biophys. Res. Commun., 2013, 437, 632 CrossRef CAS PubMed.
- A. G. Kanthasamy, M. Kitazawa, A. Kanthasamy and V. Anantharam, Neurotoxicology, 2013, 82, 40 Search PubMed.
- D. C. G. Muir, C. A. Ford, B. Rosenberg, R. J. Norstrom, M. Simon and P. Beland, Environ. Pollut., 1996, 93, 219 CrossRef CAS.
- UNEP/GCDecision19/13C, Stockholm Convention on Persistent Organic Pollutants, 1997 Search PubMed.
- I. K. Konstantinou, D. G. Hela and T. A. Albanis, Environ. Pollut., 2006, 141, 555 CrossRef CAS PubMed.
- S. P. J. van Leeuwen and J. de Boer, J. Chromatogr., A, 2008, 1186, 161 CrossRef CAS PubMed.
- D. Muir and E. Sverko, Anal. Bioanal. Chem., 2006, 386, 769 CrossRef CAS PubMed.
- H. P. Li, G. C. Li and J. F. Jen, J. Chromatogr., A, 2012, 1012, 129 CrossRef.
- G. N. Rallis, V. A. Sakkas, V. A. Boumba, T. Vougiouklakis and T. A. Albanis, J. Chromatogr., A, 2012, 1227, 1 CrossRef CAS PubMed.
- J. L. R. Júnior and N. Ré-Poppi, Talanta, 2007, 72, 1833 CrossRef PubMed.
- M. Fernandez-Alvarez, M. Llompart, J. P. Lamas, M. Lores, C. Garcia-Jares, R. Cela and T. Dagnac, J. Chromatogr., A, 2008, 1188, 154 CrossRef CAS PubMed.
- M. Barriada-Pereira, P. Serôdio, M. J. González-Castro and J. M. F. Nogueira, J. Chromatogr., A, 2010, 1217, 119 CrossRef CAS PubMed.
- P. Mayer, W. H. J. Vaes, F. Wijnker, K. Legierse, R. H. Kraaij, J. Tolls and J. L. M. Hermens, Environ. Sci. Technol., 2000, 34, 5177 CrossRef CAS.
- J. A. Koziel, J. Noah and J. Pawliszyn, Environ. Sci. Technol., 2001, 35, 1481 CrossRef CAS.
- B. I. Escher and J. L. M. Hermens, Environ. Sci. Technol., 2002, 36, 4201 CrossRef CAS.
- M. Carballa, F. Omil, J. M. Lema, M. Llompart, C. Garcia-Jares, I. Rodriguez, M. Gomez and T. Ternes, Water Res., 2004, 38, 2918 CrossRef CAS PubMed.
- V. I. Valsamaki, V. I. Boti, V. A. Sakkas and T. A. Albanis, Anal. Chim. Acta, 2006, 573–574, 195 CrossRef CAS PubMed.
- L. C. Lu, C. I. Wang and W. F. Sye, Carbohydr. Polym., 2011, 83, 1984 CrossRef CAS PubMed.
- J. Hong, H.-Y. Kim, D.-G. Kim, J. Seo and K.-J. Kim, J. Chromatogr., A, 2010, 1217, 119 CrossRef PubMed.
- A. M. Geller, F. C. Stedile, M. do C. R. Peralba, T. M. Pizzolato and J. H. Z. dos Santos, J. Colloid Interface Sci., 2006, 299, 163 CrossRef CAS PubMed.
- A. Salemi, E. Shafiei and M. Vosough, Talanta, 2012, 101, 504 CrossRef CAS PubMed.
- C. Qiu and M. Cai, J. Chromatogr., A, 2010, 1217, 1191 CrossRef CAS PubMed.
- J. H. Park, S. Kim and A. J. Bard, Nano Lett., 2006, 6, 24 CrossRef CAS PubMed.
- G. K. Mor, K. Shankar, M. Paulose, O. K. Varghese and C. A. Grimes, Nano Lett., 2005, 5, 191 CrossRef CAS PubMed.
- G. K. Mor, K. Shankar, M. Paulose, O. K. Varghese and C. A. Grimes, Nano Lett., 2006, 6, 215 CrossRef CAS PubMed.
- S. Q. Liu and A. C. Chen, Langmuir, 2005, 21, 8409 CrossRef CAS PubMed.
- S. Livraghi, A. Votta, M. C. Paganini and E. Giamello, Chem. Commun., 2005, 498 RSC.
- D. W. Gong, C. A. Grimes, O. K. Varghese, W. C. Hu, R. S. Singh, Z. Chen and E. C. Dickey, J. Mater. Res., 2001, 16, 3331 CrossRef CAS.
- B. Yuan, Y. Wang, H. Bian, T. Shen, Y. Wu and Z. Chen, Appl. Surf. Sci., 2013, 280, 523 CrossRef CAS PubMed.
- S. Z. Chu, S. Inoue, K. Wada, S. Hishita and K. Kurashima, J. Electrochem. Soc., 2005, 152, B116 CrossRef CAS PubMed.
- Q. Wu, J. Ouyang, K. Xie, L. Sun, M. Wang and C. Lin, J. Hazard. Mater., 2012, 199–200, 410 CrossRef CAS PubMed.
- W. Z. Wang, O. K. Varghese, M. Paulose, C. A. Grimes, Q. L. Wang and E. C. Dickey, J. Mater. Res., 2004, 19, 417 CrossRef CAS.
- S. S. Kalanur, S. H. Lee, Y. J. Hwang and O.-S. Joo, J. Photochem. Photobiol., A, 2013, 259, 1 CrossRef CAS PubMed.
- D. V. Bavykin, V. N. Parmon, A. A. Lapkin and F. C. Walsh, J. Mater. Chem., 2004, 14, 3370 RSC.
- X. H. Li, W. M. Liu and H. L. Li, Appl. Phys. A, 2005, 80, 317 CrossRef CAS PubMed.
- Q. X. Zhou, Y. R. Huang, J. P. Xiao and G. H. Xie, Anal. Bioanal. Chem., 2011, 400, 205 CrossRef CAS PubMed.
- Y. R. Huang, Q. X. Zhou and J. P. Xiao, Analyst, 2011, 136, 2741 RSC.
- Y. R. Huang, Q. X. Zhou and G. H. Xie, J. Hazard. Mater., 2011, 193, 82–89 CrossRef CAS PubMed.
- Q. X. Zhou, Y. R. Huang and G. H. Xie, J. Chromatogr., A, 2012, 1237, 24 CrossRef CAS PubMed.
| This journal is © The Royal Society of Chemistry 2014 |

