 Open Access Article
Creative Commons Attribution 3.0 Unported Licence
Correction: Spatial organization of Pseudomonas aeruginosa biofilms probed by combined matrix-assisted laser desorption ionization mass spectrometry and confocal Raman microscopy
Rachel N.
Masyuko
a,
Eric J.
Lanni
b,
Callan M.
Driscoll
c,
Joshua D.
Shrout
c,
Jonathan V.
Sweedler
*b and
Paul W.
Bohn
*ad
aDepartment of Chemistry and Biochemistry, University of Notre Dame, Notre Dame, IN 46556, USA. E-mail: pbohn@nd.edu
bDepartment of Chemistry, University of Illinois at Urbana-Champaign, 600 S. Mathews Ave., Urbana, IL 61801, USA. E-mail: jsweedle@illinois.edu
cDepartment of Civil and Environmental Engineering and Earth Sciences, University of Notre Dame, Notre Dame, IN 46556, USA
dDepartment of Chemical and Biomolecular Engineering, University of Notre Dame, Notre Dame, IN 46556, USA
First published on 29th September 2014
Abstract
Correction for ‘Spatial organization of Pseudomonas aeruginosa biofilms probed by combined matrix-assisted laser desorption ionization mass spectrometry and confocal Raman microscopy’ by Rachel N. Masyuko et al., Analyst, 2014, DOI: 10.1039/c4an00435c.
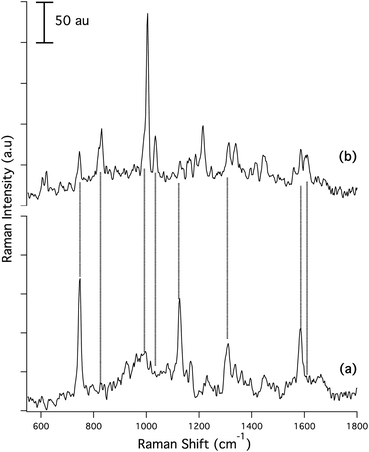
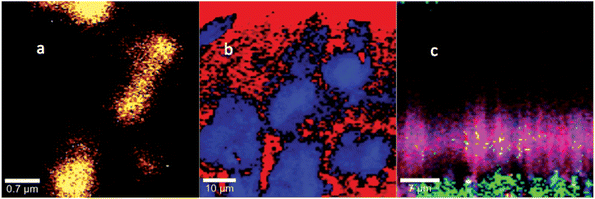
In the original study for the DOI detailed above, Masyuko et al. examined the Raman and mass spectrometric microspectra and images accompanying transition from planktonic cells to biofilms in wild-type Pseudomonas aeruginosa and in a quorum sensing (QS)-deficient mutant, ΔlasIΔrhlI. In the course of follow-up studies, we became aware that some of the Raman spectra attributed to wild-type biofilm could have arisen from a contaminant, microparticulate polystyrene (PS). Subsequently, a new series of wild-type Pseudomonas biofilms were grown under rigorously PS-free conditions, and new spectra and images were acquired. For the new data shown in the figures below, Fig. 1 replaces the spectrum shown in Fig. 1(b) of the original and Fig. 3 replaces the images shown in Figs. 3(b) and S2 of the original. A detailed consideration of the bands and their assignments in the new biofilm spectrum is given in the Supplemental Information (see below).
While detailed analysis of the biofilm spectrum, Fig. 1(b), and the image acquired, Fig. 3(b), differ from the corresponding data in the original, the major conclusions of the paper are unaffected. In particular:
(1) the wild-type biofilm spectra are markedly different than the corresponding wild-type planktonic cell spectra, cf.Fig. 1(b)vs.Fig. 1(a);
(2) wild-type biofilms produce spectra that are characteristic of rhamnolipids, secreted as part of the biofilm formation process, and by a co-secreted protein/peptide component; and
(3) these data are consistent with the formation of a thick (relative to the sampling depth of the CRM) biofilm after 72 h in the wild type cells, but not in the QS mutant.
Supplemental Information
Text in the original describing the Raman spectra (Figs. 1(b) and 3(b) in the original) should be replaced with the following.Upon biofilm formation, dramatic changes occur in the spectrum, Fig. 1(b). Biofilms cultivated on bare Si exhibit a greatly reduced SiO2 background (915–1015 cm−1), presumably because biofilms at 72 h are much thicker than the <1 μm confocal depth of the CRM. In addition, the strong DNA/RNA-related bands at 747 (thymine), 1126 (cytosine), and 1310 cm−1 (adenine) are all diminished in relative intensity. The strong band at 1585 cm−1 is reduced in strength and a new band at 1606 cm−1 grows in. In addition, narrow bands with peaks centered at 1005 cm−1 and 1034 cm−1 appear as well as bands centered at 830 cm−1, 1166 cm−1, 1186 cm−1, 1417 cm−1, 1445 cm−1 and 1558 cm−1. Most striking is the intense peak at 1005 cm−1 attributed to symmetric ring breathing vibrations in phenylalanine and tryptophan, indicative of proteins.1 Other bands characteristic of proteins are at 830 cm−1 ring breathing vibrations in tyrosine (with a possible contribution from rhamnolipid), 1186 cm−1 arising from C–H in plane bending vibrations in tyrosine and phenylalanine,2 1214 cm−1 and 1246 cm−1 both assigned to amide III vibrations, 1558 cm−1 linked to the C–C pyrrole ring stretching vibrations in tryptophan and the two bands at 621 cm−1 and 1605 cm−1 arising from in plane ring deformation and C![[double bond, length as m-dash]](https://www.rsc.org/images/entities/char_e001.gif) C stretching vibrations in phenylalanine, respectively.1
C stretching vibrations in phenylalanine, respectively.1
The important band at 1034 cm−1, as well as bands at 1129 cm−1 and 1163 cm−1, lie in the carbohydrate region of the spectrum, and are observed in the wild-type biofilm spectrum, Fig. 1(b), but not in the spectrum from the planktonic cells, Fig. 1(a). These are classified as C–O stretching with contributions from in plane C–H deformations in phenylalanine (1034 cm−1), C–C and C–O symmetric (1128 cm−1) and asymmetric (1163 cm−1) ring breathing vibrations.3–5 In the context of Pseudomonas-derived biofilms, these bands are consistent with the presence of rhamnolipids,6 a specific class of glycolipids known to be secreted by Pseudomonas species concurrently with biofilm formation,7,8 an assignment confirmed via MS. Comparison of representative microspectra from a Pseudomonas wild-type biofilm, Fig. 1(b) with a mixed rhamnolipid standard shows that the standard has contributions from common Raman bands at 1030 cm−1, 1068 cm−1, and 1155 cm−1 (wide band that includes the contributions at 1163 cm−1) characteristic of the sugar moieties, as well as a strong band at 1445 cm−1 as described above consistent with the presence of rhamnolipids in the biofilm matrix. Confirming the assignment of these bands to rhamnolipids, the MS data not only show the presence of rhamnolipids, but also allow their assignment to individual congeners.
Band assignments for the biofilm spectrum are summarized in Table S1.
| Frequency (cm−1) | Assignment |
|---|---|
| 621 | In plane ring breathing deformation in phenylalanine1 |
| 674 | Ring breathing modes in DNA bases9 |
| 704 | |
| 746 | |
| 830 | Tyrosine ring breathing3,10 |
| 849 | Tyrosine ring breathing3,10 |
| 879 | C–C stretching, C–O–C glycosidic link4,5,10 |
| 908 | C–O–C stretching11 |
| 952 | |
| 1005 | Ring breathing phenylalanine and tryptophan1 |
| 1034 | C–H in plane phenylalanine, C–C and C–O stretching3–5 |
| 1064 | C–C and C–O stretching3–5 |
| 1099 | C–O–C glycosidic link symmetric ring breathing3–5 |
| 1128 | C–C str, C–O–C glycosidic link symmetric ring breathing3–5 |
| 1163 | C–C str, C–O–C glycosidic link asymmetric ring breathing3–5 |
| 1186 | Tyrosine, phenylalanine |
| 1215 | Amide III3–5,10 |
| 1246 | Amide III3–5,10 |
| 1310 | δ (CH) in carbohydrates and proteins4,5,10 |
| 1341 | δ (CH) in carbohydrates and proteins4,5,10 |
| 1392 | COO− symmetric stretch |
| 1417 | COO− symmetric stretch |
| 1445 | CH2 deformation5,10 |
| 1558 | Tryptophan ring12 |
| 1587 | Ring stretch doublet – benzene derivative |
| 1605 | C![[double bond, length as m-dash]](https://www.rsc.org/images/entities/char_e001.gif) C phenylalanine1 C phenylalanine1 |
References
- G. J. Puppels, H. S. P. Garritsen, G. M. J. Segersnolten, F. F. M. Demul and J. Greve, Biophys. J., 1991, 60, 1046–1056 CrossRef CAS.
- N. Uzunbajakava, A. Lenferink, Y. Kraan, B. Willekens, G. Vrensen, J. Greve and C. Otto, Biopolymers, 2003, 72, 1–9 CrossRef CAS PubMed.
- I. Notingher, S. Verrier, H. Romanska, A. E. Bishop, J. M. Polak and L. L. Hench, Spectrosc. Int. J., 2002, 16, 43–51 CrossRef CAS PubMed.
- M. Harz, P. Rosch, K. D. Peschke, O. Ronneberger, H. Burkhardt and J. Popp, Analyst, 2005, 130, 1543–1550 RSC.
- U. Neugebauer, U. Schmid, K. Baumann, W. Ziebuhr, S. Kozitskaya, V. Deckert, M. Schmitt and J. Popp, ChemPhysChem, 2007, 8, 124–137 CrossRef CAS PubMed.
- M. Jadhav, S. Kalme, D. Tamboli and S. Govindwar, J. Basic Microbiol., 2011, 51, 385–396 CrossRef CAS PubMed.
- B. R. Boles, M. Thoendel and P. K. Singh, Mol. Microbiol., 2005, 57, 1210–1223 CrossRef CAS PubMed.
- M. E. Davey, N. C. Caiazza and G. A. O'Toole, J. Bacteriol., 2003, 185, 1027–1036 CrossRef CAS.
- J. W. Chan, D. S. Taylor, T. Zwerdling, S. M. Lane, K. Ihara and T. Huser, Biophys. J., 2006, 90, 648–656 CrossRef CAS PubMed.
- K. Maquelin, C. Kirschner, L. P. Choo-Smith, N. van den Braak, H. P. Endtz, D. Naumann and G. J. Puppels, J. Microbiol. Methods, 2002, 51, 255–271 CrossRef CAS.
- J. De Gelder, K. De Gussem, P. Vandenabeele, M. Vancanneyt, P. De Vos and L. Moens, Anal. Chim. Acta, 2007, 603, 167–175 CrossRef CAS PubMed.
- J. T. Pelton and L. R. McLean, Anal. Biochem., 2000, 277, 167–176 CrossRef CAS PubMed.
| This journal is © The Royal Society of Chemistry 2014 |


