 Open Access Article
Creative Commons Attribution 3.0 Unported Licence
Diagnosing malaria infected cells at the single cell level using focal plane array Fourier transform infrared imaging spectroscopy
Bayden R.
Wood
*a,
Keith. R.
Bambery
ab,
Matthew W. A.
Dixon
c,
Leann
Tilley
c,
Michael J.
Nasse
d,
Eric
Mattson
e and
Carol J.
Hirschmugl
*e
aCentre for Biospectroscopy, School of Chemistry, Monash University, VIC 3800, Australia. E-mail: bayden.wood@monash.edu
bAustralian Synchrotron, 800 Blackburn Rd, Clayton, VIC 3168, Australia
cDepartment of Biochemistry and Molecular Biology, Bio21 Institute, and ARC Centre of Excellence for Coherent X-ray Science, University of Melbourne, Melbourne, VIC 3010, Australia
dLaboratory for Applications of Synchrotron Radiation, Karlsruhe Institute of Technology, Karlsruhe, 76049, Germany
eDepartment of Physics, University of Wisconsin–Milwaukee, Milwaukee, 53211, Wisconsin, USA
First published on 14th July 2014
Abstract
New methods are needed to rapidly identify malaria parasites in blood smears. The coupling of a Focal Plane Array (FPA) infrared microscope system to a synchrotron light source at IRENI enables rapid molecular imaging at high spatial resolution. The technique, in combination with hyper-spectral processing, enables imaging and diagnosis of early stage malaria parasites at the single cell level in a blood smear. The method relies on the detection of distinct lipid signatures associated with the different stages of the malaria parasite and utilises resonant Mie extended multiplicative scatter correction to pre-process the spectra followed by full bandwidth image deconvolution to resolve the single cells. This work demonstrates the potential of focal plane technology to diagnose single cells in a blood smear. Brighter laboratory based infrared sources, optical refinements and higher sensitive detectors will soon see the emergence of focal plane array imaging in the clinical environment.
The malaria parasite Plasmodium falciparum causes one of the most deadly diseases of humans, with a mortality rate approaching 1.2 million per annum.1 To reduce mortality and prevent overuse of antimalarial drugs early diagnosis followed by the immediate treatment of infections is critical.2 Technologies to diagnose malaria must have high sensitivity and be cost effective for the developing world. Moreover, they need to be able to detect the immature asexual stage of the parasite (ring stage), which are the only stages that are present in the peripheral circulation in new infections and the mature sexual stage (gametocytes), which appear later are the only stage capable of transmission to mosquitoes. Optical diagnosis is still the method of choice for thick blood films because it is inexpensive and has good sensitivity (5–10 parasites per μL blood).3–6 Unfortunately it is labour-intensive and is increasingly burdensome as malaria rates decline due to treatment, with most smears examined being negative. Rapid Diagnostic Tests (RDTs), which are based on capture of parasite antigens by monoclonal antibodies incorporated into a test strip, are easy to apply but are unable to quantify parasitemia.6 Other techniques include gene amplification techniques such as polymerase chain reaction (PCR).7,8 PCR is arguably the most sensitive and specific method, but is expensive, sophisticated and time consuming. Serological detection tests using antibodies such as immunofluorescence (IFA)9 and enzyme-linked immunosorbent assay (ELISA) are also highly sensitive but are difficult to implement.9,10 Given the distinct morphological stages of the parasite and dramatic chemical changes between uninfected and infected cells, a spectroscopic method in combination with a morphological approach would seem a logical alternative.
Fourier Transform Infrared (FTIR) spectroscopy detects molecular vibrations from the absorption of light in the 4000–400 cm−1 (2.5–25 μm) range. The FTIR spectrum of P. falciparum-infected red blood cell shows bands mainly associated with protein, lipid, nucleic acids and haemozoin (malaria pigment).11 Other optical spectroscopic techniques including Raman microscopy12–16 and magneto-based technologies5,17,18 have also been applied to diagnose malaria. Unlike FTIR spectroscopy, these techniques rely on detecting the presence of haemozoin, which only appears in significant amounts in late stage ring forms, gametocytes, trophozoites and schizonts and not the early stage rings especially those less than 10 hours old, which are often found in peripheral blood. Recently we demonstrated the potential of Attenuated Total Reflection (ATR) spectroscopy to diagnose malaria.19 While the ATR technique can detect very low parasitemia levels it does have the capability to make the diagnosis at the single cell level. Here we show that FPA technology coupled with sophisticated data pre-treatment can be applied to spatially resolve images of malaria infected red blood cells in a blood smear. Moreover, we demonstrate that the averaged spectrum from each single cell can be used to unequivocally to diagnose the stage of the parasite in a highly reproducible manner from independent trials.
Materials and methods
Cell culture
Plasmodium falciparum was cultured as previously described.21 Briefly, parasite infected RBCs were cultured in O+ RBCs (Australian Red Cross blood service), in RPMI-GlutaMAX™-HEPES (Invitrogen) supplemented with 5% v/v human serum (Australian Red Cross blood service), 0.25% w/v AlbuMAX II (Invitrogen), 0.58 mg L−1 gentamycin (Invitrogen) and 10 mM glucose. Parasite infected RBCs were maintained at 37 °C in a low oxygen environment (5% CO2, 1% O2 in nitrogen). Ring stage parasites (0–12 h post invasion) were prepared from culture by sorbitol synchronisations.22 Purified and harvested parasite infected RBC's were allowed to recover under standard culture conditions prior to sample preparation. Infected red blood cells (RBCs) and uninfected RBCs (controls) were fixed in solution using 2% paraformaldehyde, 0.0075% glutaraldehyde, and 0.1 M cacodylate buffer for 1 h before being washed twice with Milli-Q water and placed on individual 12 mm diameter × 0.5 mm thick CaF2 IR grade polished windows. Excess water was removed, and the windows were allowed to dry. The experiment was repeated two times from two separate visits to IRENI. In all cases the cells were fixed in glutaraldehyde and transported from Australia to the USA. The data was analysed using Principal Component Analysis (PCA) in the spectral range 3100–2800 cm−1 using normalised second derivatives. Classification of the cell types was based on morphological assessment from highly enriched ring, trophozoite and schizont samples compared to the uninfected cells. The gametocyte data was excluded from this model as we only had data from one trial for this stage.FTIR data collection
Synchrotron FTIR (sFTIR) image data were recorded in transmission mode at the IRENI beamline (SRC, University of Wisconsin–Madison). sFTIR images were acquired using a 74× objective (Ealing Inc., Rocklin, CA, USA), with a pixel size of 0.54 × 0.54 mm2 at 4000 cm−1 on the Focal Plane Array (FPA). Spectra were recorded at 6 cm−1 with a zero-filling factor of 2. Second derivatives were calculated using a Savistky–Golay algorithm convolved to a 9 smoothing point smoothing function. 128 scans were co-added in order to obtain good signal to noise. Each tile was selected to be 64 × 64 pixels; mosaic images are comprised of 2 × 2, to 3 × 2 tiles.Data pre-processing
Results and discussion
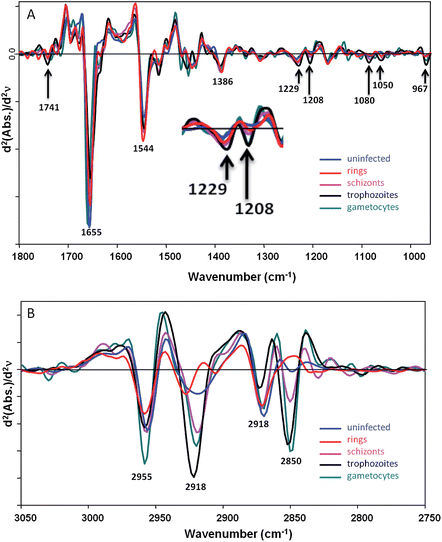
Fig. 1 shows averaged second derivative FTIR spectra (20 spectra for each stage and 3 central pixels per cell) extracted from FPA images recorded from fixed P. falciparum-infected cells at different stages of the parasite's asexual (ring and trophozoite stages) and sexual (gametocyte) intraerythrocytic development acquired at IRENI in the 1800–950 cm−1 (Fig. 1A) and the 3050–2750 cm−1 (Fig. 1B) ranges.The spectra are rich in detail and show clear differences between each of the parasitic stages. Ring forms and, in some patients, transmissible gametocytes, are found in peripheral blood. The gametocytes, like the later stage trophozoites, show high levels of haemozoin as evidenced by a small but pronounced band at 1208 cm−1 from the C–O stretching vibration of the propionate functional group.23 The gametocyte haemozoin band at 1208 cm−1 is totally overlapped by the trophozoite band indicating the gametocytes have significant amounts of haemozoin. This band is not observed in the uninfected cells and is barely discernable in the ring stage consistent with the extremely low levels of haemozoin found in rings. The trophozoite spectra also show evidence of high concentrations of nucleic acids compared to the other stages including a sharp band at 1080 cm−1 assigned to the symmetric phosphodiester vibration and another band at 1229 cm−1 assigned to the asymmetric phosphodiester vibration. The band at 967 cm−1 is assigned to a C–C stretching vibration from the DNA backbone and supports the other DNA assignments. Both the gametocytes and trophozoites also show a strong ester carbonyl band at 1741 cm−1 indicating a higher concentration of lipids compared to the other stages. The amide I mode at 1655 cm−1 appears most intense in the uninfected cells, which is consistent with the higher haemoglobin content in these cells especially when compared to the trophozoites where the majority of haemoglobin has been catabolised and converted to haemozoin. The gametocytes also have a strong amide I mode indicating a high protein content in these cells. However, the amide II mode at 1544 cm−1 is weaker for the uninfected cells compared to the rings and other infected cells. This is likely the result of light dispersion and scattering, which results in a reduced amide I/amide II ratio and is often seen in FTIR spectra recorded at the edges of cells and tissues. The band at 1386 cm−1 is tentatively assigned to the amide III mode, which follows a similar pattern to the amide I mode where the trophozoites show a low protein concentration compared to uninfected cells and the other stages. The discrimination in the CH stretching region (Fig. 1B) is even more dramatic due to strong and distinctive lipid contributions from the parasite. While single point measurements with a synchrotron source can be used to determine differences between functional red blood cells at early stages of infection the technique is not conducive for rapid diagnosis.
FPA infrared detectors were originally developed by defence as infrared seekers in antitank guided missiles.24 These detectors were declassified approximately 15 years ago but FPAs with fast electronics and robust epitaxial fabrication are quite recent (∼5 years).25–27 A 64 × 64 pixel FPA detector is capable of recording 4096 spectra in 20 seconds at 8 cm−1 and 32 scans. However, the image processing can take a further 5 minutes using a standard CPU and Unsupervised Hierarchical Cluster Analysis in Cytospec™. Still this is rapid compared to RDTs, which take 10–15 minutes to achieve a result. Moreover, with a motorised microscope stage, mosaic images can be collected for analyzing large fields of cells. At the new IRENI (IR ENvironmental Imaging) facility, Synchrotron Radiation Center (SRC) Madison, WI (USA), 12 synchrotron beams illuminate an FPA detector, thereby multiplexing the advantages of the parallel pixel detection of a multi-element FPA detector with the large-area illumination from the high brightness, stable, broadband synchrotron source.27 IRENI with 74× magnification provides an effective geometric pixel size of 0.54 × 0.54 μm2 exceeding conventional FTIR-FPA configurations by an order of magnitude.25 A schematic of the instrumental configuration is shown in an earlier publication.27
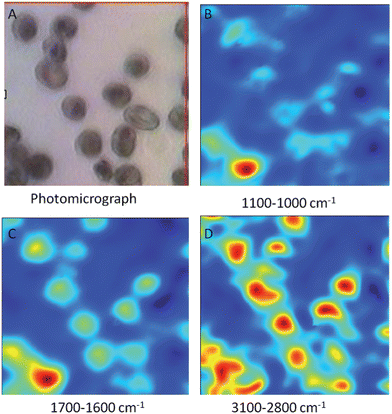
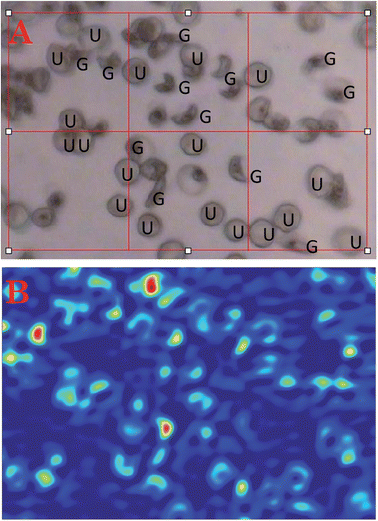
Fig. 2A shows a photomicrograph of fixed red blood cells infected with mainly ring stage parasites on a CaF2 window while Fig. 2B–D shows FTIR mosaic images of the same cells generated by integrating the bands between 1100–1000 cm−1 (2B), 1700–1600 cm−1 (2C) and 3100–2800 cm−1 (2D). There is an improvement in image quality as the wavenumber value increases because of the wavelength dependence on spatial resolution. Consequently the best images are achieved when using the 3100–2800 cm−1 characteristic of the CH stretching region of lipids and proteins. The FTIR images of the cells appear similar in resolution to those in the visible photomicrograph even though the visible wavelengths are an order of magnitude smaller than the infrared wavelengths. The red areas in the images show areas of high lipid concentration mainly associated with mature ring stage parasites. The light blue areas are mainly associated with uninfected and immature ring stage parasites, while the dark blue is the background. A similar image showing early stage gametocytes exhibiting their distinct crescent shapes is presented in Fig. 3.
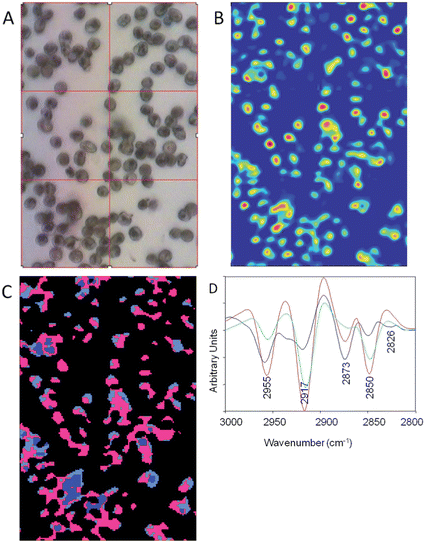
Because of the higher spatial resolution along with the excellent discrimination of the different parasitic stages we chose the 3100–2800 cm−1 range for the ensuing Unsupervised Hierarchical Cluster Analysis (UHCA). The spectra for the UHCA were processed using Resonance Mie Extended Multiplicative Scatter Correction (RMie-EMSC)20,21,28,29 followed by full bandwidth image deconvolution for each resolved wavelength (every 4 cm−1) based on measured point spread functions. RMie-EMSC corrects spectra for baseline distortions resulting from Mie scattering effects of single cells due to their wavelength-comparable size21 while deconvolution removes blur mainly from diffraction effects, and is scaled appropriately for each image to recover realistic spectra.22 Background pixels with low absorbance were removed prior to UHCA using a routine in Cytospec™. Fig. 4A shows a photomicrograph of a monolayer blood film of mainly ring stage infected red blood cells. Fig. 4B shows the corresponding chemical image after deconvolution generated by integrating CH stretching region (3100–2800 cm−1). The deconvolution improves the discrimination of the single cells in the image. This is further improved when the low absorbance pixels are removed and UHCA is performed. The pink cluster is associated with high lipid content from parasite lipid inclusions and membranes. The light blue areas result mainly from CH stretching vibrations from a mixture of haemoglobin and lipid, while the dark blue cluster correlates with uninfected stacked cells. The corresponding mean second derivative spectra extracted as averages for each cluster show the pronounced lipid bands indicative of the ring form. The infected cells have very intense and shifted asymmetric methyl and methylene stretching modes at 2955 cm−1 and 2917 cm−1 (pink spectrum) compared to the normal haemoglobin spectrum (blue).
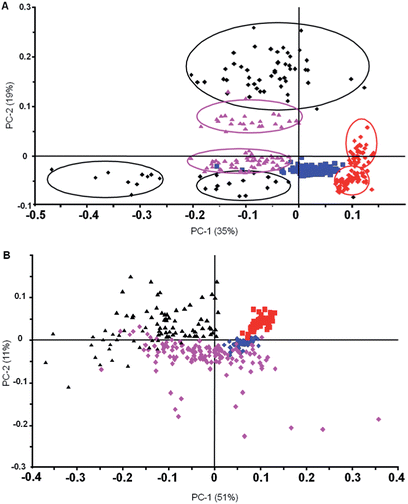
To further investigate the reproducibility of the FPA diagnostic approach we combined data sets from two independent trials over a two-year period. The results of the PCA for spectra processed with and without RMie-EMSC are shown in Fig. 5.
Fig. 5A shows a PC1 versus PC2 scores plot for uncorrected second derivatives after min/max normalisation, while Fig. 5B shows the same data but after RMie-EMSC. The uninfected, schizont and ring stage parasites group extremely well for the two independent trials on the uncorrected spectra. The trophozoite spectra, on the other hand, were more heterogeneous and formed three distinct clusters, two of which were oppositely correlated with a third along PC2. The two clusters of trophozoite spectra with PC2 scores below 0 were early stage trophozoites from two trials, while the group with positive PC2 scores were late stage trophozoites. The opposite correlation comes from scattering effects from haemozoin crystals, which manifests in the spectra as sinusoidal modulations. Because haemozoin crystal aggregates are in the range of infrared wavelengths (∼2–3 μm) significant light scattering can result especially from parasites in the trophozoite and schizont stages. To address the scattering we performed RMie-EMSC on the spectra prior to taking the second derivative and min/max normalisation. The PC1 versus PC2 scores plot (Fig. 5B) show that following RMie-EMSC the spectra from both trials are grouped much more tightly yet still show excellent discrimination between all stages investigated. The combination of FPA imaging coupled with rigorous pre-processing using full bandwidth image deconvolution and RMie-EMSC enables malaria diagnosis to be performed at the single cell level in a blood smear.
At present a synchrotron source is required to achieve the high contrast in the images presented. Recently the Bhargava group demonstrated the feasibility of recording FPA images using a 74× objective of tissue without a synchrotron source.30 With the development of tuneable quantum cascade lasers for cell and tissue analysis31 and amplified frequency difference generated broadband mid-infrared laser sources,32 along with refinements to the optic and detector electronics, a new laboratory-based gold standard for malaria diagnosis utilising FTIR focal plane array imaging is on the horizon.
The combination of FPA technology with 74× magnification and sophisticated algorithms to correct for Mie scattering prior to full bandwidth image deconvolution can produce high contrast chemical images of single cells in a blood smear. The application of a simple classification algorithm following pre-processing such as UHCA or PCA can then be used to diagnose and identify the early ring stages, which are diagnostic of new infections, as well as gametocytes, which are diagnostic of carriage of forms that can be transmitted to mosquitoes. Other optical/magneto-based technologies are often based on detecting haemozoin from the later stage trophozoites and schizonts, which are scarce in peripheral blood and tend to accumulate in small capillaries in organs, such as the brain. The key to this approach is using the CH stretching region first, enhancing the image quality through the spatial wavelength dependence advantage gained at 3100–2800 cm−1 and secondly, using the unique profile to not only diagnose the parasite but also classify its stage of development.
Acknowledgements
We acknowledge travel funding provided by the International Synchrotron Access Program (ISAP) managed by the Australian Synchrotron and funded by the Australian Government. BRW is supported by an Australian Research Council Future Fellowship (FT120100926). We acknowledge funding from the Australian Research Council and the National Health & Medical Research Council. We also acknowledge the Multi-modal Australian Science Imaging and Visualisation Environment (MASSIVE) (http://www.massive.org.au). This work has been done with support from a National Science Foundation (NSF) Major Research Instrumentation grant (DMR-0619759) and also NSF Chemistry: CHE-1112234. This research is based upon work performed at the Synchrotron Radiation Center. The SRC is funded by the University of Wisconsin–Madison and University of Wisconsin–Milwaukee and through user fees.References
- C. J. Murray, L. C. Rosenfeld, S. S. Lim, K. G. Andrews, K. J. Foreman, D. Haring, N. Fullman, M. Naghavi, R. Lozano and A. D. Lopez, Lancet, 2012, 379, 413–431 CrossRef.
- A. M. Dondorp, F. Nosten, P. Yi, D. Das, A. P. Phyo, J. Tarning, K. M. Lwin, F. Ariey, W. Hanpithakpong, S. J. Lee, P. Ringwald, K. Silamut, M. Imwong, K. Chotivanich, P. Lim, T. Herdman, S. S. An, S. Yeung, P. Singhasivanon, N. P. Day, N. Lindegardh, D. Socheat and N. J. White, N. Engl. J. Med., 2009, 361, 455–467 CrossRef CAS PubMed.
- N. Tangpukdee, C. Duangdee, P. Wilairatana and S. Krudsood, Korean J. Parasitol., 2009, 47, 93–102 CrossRef PubMed.
- S. J. Rogerson, P. Mkundika and M. K. Kanjala, J. Clin. Microbiol., 2003, 41, 1370–1374 CrossRef.
- A. Butykai, A. Orban, V. Kocsis, D. Szaller, S. Bordacs, E. Tatrai-Szekeres, L. F. Kiss, A. Bota, B. G. Vertessy, T. Zelles and I. Kezsmarki, Sci. Rep., 2013, 3, 1431 CAS.
- B. E. Barber, T. William, M. J. Grigg, K. Piera, T. W. Yeo and N. M. Anstey, J. Clin. Microbiol., 2013, 51, 1118–1123 CrossRef CAS PubMed.
- H. A. Dawoud, H. M. Ageely and A. A. Heiba, J. Egypt. Soc. Parasitol., 2008, 38, 329–338 CAS.
- G. F. Lima, J. E. Levi, M. P. Geraldi, M. C. Sanchez, A. A. Segurado, A. D. Hristov, J. Inoue, J. Costa-Nascimento Mde and S. M. Di Santi, Mem. Inst. Oswaldo Cruz, 2011, 106, 691–700 CrossRef CAS PubMed.
- R. C. She, M. L. Rawlins, R. Mohl, S. L. Perkins, H. R. Hill and C. M. Litwin, J. Travel Med., 2007, 14, 105–111 CrossRef PubMed.
- H. Noedl, K. Yingyuen, A. Laoboonchai, M. Fukuda, J. Sirichaisinthop and R. S. Miller, Am. J. Trop. Med. Hyg., 2006, 75, 1205–1208 CAS.
- G. T. Webster, K. A. de Villiers, T. J. Egan, S. Deed, L. Tilley, M. J. Tobin, K. R. Bambery, D. McNaughton and B. R. Wood, Anal. Chem., 2009, 81, 2516–2524 CrossRef CAS PubMed.
- B. R. Wood and D. McNaughton, Expert Rev. Proteomics, 2006, 3, 525–544 CrossRef CAS PubMed.
- B. R. Wood, S. J. Langford, B. M. Cooke, J. Lim, F. K. Glenister and D. McNaughton, FEBS Lett., 2003, 554, 247–252 CrossRef CAS.
- B. R. Wood, A. Hermelink, P. Lasch, K. R. Bambery, G. T. Webster, M. A. Khiavi, B. M. Cooke, S. Deed, D. Naumann and D. McNaughton, Analyst, 2009, 134, 1119–1125 RSC.
- L. Puskar, R. Tuckermann, T. Frosch, J. Popp, V. Ly, D. McNaughton and B. R. Wood, Lab Chip, 2007, 7, 1125–1131 RSC.
- A. J. Hobro, A. Konishi, C. Coban and N. I. Smith, Analyst, 2013, 138, 3927–3933 RSC.
- P. F. Mens, R. J. Matelon, B. Y. Nour, D. M. Newman and H. D. Schallig, Malar. J., 2010, 9, 207 CrossRef PubMed.
- D. M. Newman, J. Heptinstall, R. J. Matelon, L. Savage, M. L. Wears, J. Beddow, M. Cox, H. D. Schallig and P. F. Mens, Biophys. J., 2008, 95, 994–1000 CrossRef CAS PubMed.
- A. Khoshmanesh, M. W. Dixon, S. Kenny, L. Tilley, D. McNaughton and B. R. Wood, Anal. Chem., 2014, 86, 4379–4386 CrossRef CAS PubMed.
- P. Bassan, A. Kohler, H. Martens, J. Lee, H. J. Byrne, P. Dumas, E. Gazi, M. Brown, N. Clarke and P. Gardner, Analyst, 2010, 135, 268–277 RSC.
- P. Bassan, A. Kohler, H. Martens, J. Lee, E. Jackson, N. Lockyer, P. Dumas, M. Brown, N. Clarke and P. Gardner, J. Biophotonics, 2010, 3, 609–620 CrossRef CAS PubMed.
- E. C. Mattson, M. J. Nasse, M. Rak, K. M. Gough and C. J. Hirschmugl, Anal. Chem., 2012, 84, 6173–6180 CrossRef CAS PubMed.
- A. F. G. Slater, W. J. Swiggard, B. R. Orton, W. D. Flitter, D. Goldberg, A. Cerami and G. B. Henderson, Proc. Natl. Acad. Sci. U. S. A., 1991, 88, 325–329 CrossRef CAS.
- A. V. R. Warrier, P. K. Basu and P. K. Chaudhry, Defense Science Journal, 1995, 45, 229–232 Search PubMed.
- C. J. Hirschmugl and K. M. Gough, Appl. Spectrosc., 2012, 66, 475–491 CrossRef CAS PubMed.
- M. J. Nasse, B. Bellehumeur, S. Ratti, C. Olivieri, D. Buschke, J. Squirrell, K. Eliceiri, B. Ogle, C. Schmidt Patterson, M. Giordano and C. J. Hirschmugl, Vib. Spectrosc., 2012, 60, 10–15 CrossRef CAS PubMed.
- M. J. Nasse, M. J. Walsh, E. C. Mattson, R. Reininger, A. Kajdacsy-Balla, V. Macias, R. Bhargava and C. J. Hirschmugl, Nat. Methods, 2011, 8, 413–416 CrossRef CAS PubMed.
- P. Bassan, H. J. Byrne, F. Bonnier, J. Lee, P. Dumas and P. Gardner, Analyst, 2009, 134, 1586–1593 RSC.
- P. Bassan, H. J. Byrne, J. Lee, F. Bonnier, C. Clarke, P. Dumas, E. Gazi, M. D. Brown, N. W. Clarke and P. Gardner, Analyst, 2009, 134, 1171–1175 RSC.
- R. K. Reddy, M. J. Walsh, M. V. Schulmerich, P. S. Carney and R. Bhargava, Appl. Spectrosc., 2013, 67, 93–105 CrossRef PubMed.
- P. Bassan, M. J. Weida, J. Rowlette and P. Gardner, Analyst, 2014, 139, 3856–3859 RSC.
- E. B. Brauns, Appl. Spectrosc., 2014, 68, 1–4 CrossRef CAS PubMed.
| This journal is © The Royal Society of Chemistry 2014 |

