 Open Access Article
Creative Commons Attribution 3.0 Unported Licence
Parameters affecting ion intensities in transmission-mode direct analysis in real-time mass spectrometry
Lindsay P.
Harding
*,
Gareth M. B.
Parkes
* and
James D.
Townend
Department of Chemical Sciences, University of Huddersfield, Queensgate, Huddersfield, West Yorks, UK. E-mail: l.p.harding@hud.ac.uk; Fax: +44 (0)1484 472182; Tel: +44 (0)1484 472434
First published on 27th June 2014
Abstract
A survey of the effect of temperature, transmission module material and analysis time on ion intensities in transmission mode direct analysis in real time mass spectrometry is presented. Ion intensity profiles obtained for two related compounds are similar when analysed separately but are very different when analysed as a mixture.
Direct Analysis in Real Time mass spectrometry (DARTMS) has recently emerged as a powerful new ionisation technique for rapid analysis of samples with minimal preparation. Its mechanism has been reported in the literature, but in simple terms can be described thus: a reaction gas is passed through a chamber where a corona discharge produces ions, electrons and electronically or vibronically excited (metastable) atoms and molecules.1 The majority of the charged species are removed from the flow by grids within the source leaving only neutral species; the gas then passes across the sample where analytes are desorbed and ionised. The ionisation mechanism varies depending on the nature of the gas; helium was used in this study, and in this case protonated water clusters are formed (in positive ion mode) which subsequently undergo proton transfer reactions with analyte molecules in a CI-like process yielding, typically, [M + H]+ ions.
As may be expected, the temperature and flow rate of the gas stream affect the intensity of the analytical response obtained. To maintain a high throughput of samples it would be highly desirable to find a temperature which is suitable for a wide range of compounds; however, it is likely that optimum temperatures are compound-specific. Several studies have been carried out which highlight the importance of determining an optimum temperature on observed ion intensities when compounds are desorbed from a variety of surfaces such as glass melting point tubes, TLC plates and polyimide-coated silica.2–4
It has been reported that pseudo-separation of analytes in mixtures may be achieved on the basis of their boiling points, either intentionally or otherwise. Maleknia et al. carried out experiments to analyse VOCs in eucalyptus leaves and stems; it was observed that lower-boiling compounds (ambient to ∼100 °C) were detected at lower gas temperatures and higher-boiling compounds (∼200 °C) were observed at higher gas temperatures on direct analysis of the plant materials in separate experiments.5 Several papers report the use of gas temperature ramping to achieve desorption of the maximum number of analytes from mixtures.2a,6,7 Nilles and coworkers extended this principle by using gas temperature ramping to achieve low resolution separation of a mixture of analytes with the same nominal mass.8
The importance of positioning on sample temperatures, and therefore ion intensities, has been reported. Fernandez et al. measured the temperature at different points throughout the ion source and showed that this affects the ion intensities obtained with a model compound, dimethyl methyl phosphonate, sprayed from a capillary at fixed positions in the source region.9 Interestingly, these authors found that the highest ion intensities did not always correlate with the hottest parts of the sampling region. Samples at lower concentrations were found to have the highest intensities in the middle of the sampling region where ion transport distances were shorter, while higher concentrations gave improved ion yields near the DART source where the temperature was higher.
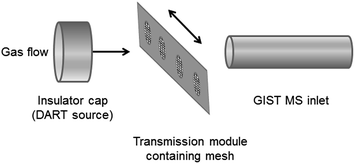
One of the main advantages of DARTMS is its amenability to a wide range of samples and sample introduction methods. Various adaptors are available commercially to introduce samples into the instrument, including glass capillary tubes (Dip-it Tips), TLC interfaces, tablet holders and tweezer-based sample holders. In addition, it is possible to laboratory-build attachments for the DART source, such as the autosamplers for analysis of cotton swabs reported by Grange.10 Recently, transmission mode DART mass spectrometry (TMDARTMS) has been developed; this is a technique whereby analyte solutions are deposited onto a fine mesh which is placed into the gas stream, which effectively passes through the sample (Fig. 1). This technique was first proposed in a study of the deposition of insecticide on treated bednets used to protect against malaria, in which a portion of the net was stretched across a purpose-built transmission module.11
TMDART has now been commercialised using metal meshes and automated systems are available for rapid sample throughput. However, as noted by Krechmer et al., finding an optimum temperature for desorption of compounds with a range of vapour pressures is difficult, as with other sample introduction methods. These authors investigated the thermal profiles of samples by acquiring mass spectra at different temperatures.6 In order to decrease the time taken to run these experiments, a system was used whereby the mesh was heated directly and the gas stream was at approximately ambient temperature, deconvoluting the desorption and ionisation steps.
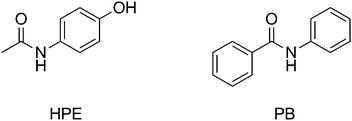
During normal operation of our laboratory-built TMDARTMS system it became apparent that the intensity of analyte ions was varying over time using isothermal conditions but that this effect was not as straightforward as a simple loss of intensity as the sample was exhausted. Therefore, we decided to carry out a systematic investigation into some physical and chemical parameters which may affect ion intensities. Physical parameters considered were transmission module material, gas temperature and analysis time. Investigation of chemical parameters involved the comparison of two chemically-similar model compounds, N-(4-hydroxyphenyl)ethanamide (HPE) and N-phenylbenzamide (PB) (Fig. 2, Table 1).
Results and discussion
Transmission module and temperature effects
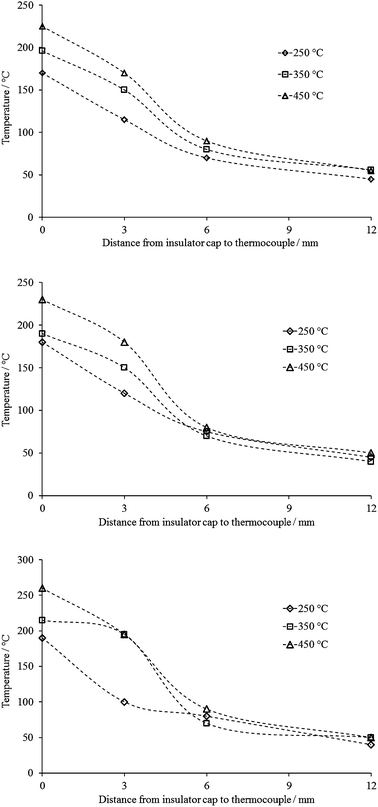 | ||
| Fig. 3 Graph of measured temperature vs. distance from the insulator cap using a flow rate of 1.5 L min−1 (top), 2.5 L min−1 (centre) 4.0 L min−1 (bottom). | ||
Therefore, in subsequent experiments, the position of the transmission module was carefully fixed at 3 mm from the insulator cap to minimise variations in the temperatures of the samples.
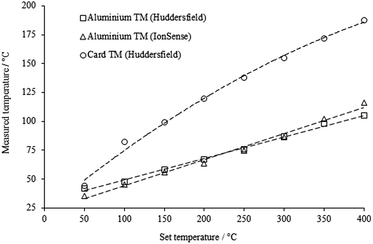
Both aluminium modules behaved very similarly; the measured temperature was related to the set temperature by a factor of approximately 0.2 over the range 50–400 °C, in both cases. Even at the highest set temperature (400 °C) the measured temperature only reached, on average, 105 °C (laboratory-built module) and 116 °C (manufacturer's module). However, the cardboard module behaved very differently; the measured temperature was ca. 0.4 times the set temperature, and the final temperature reached was 188 °C, which is a significant increase over the aluminium modules.
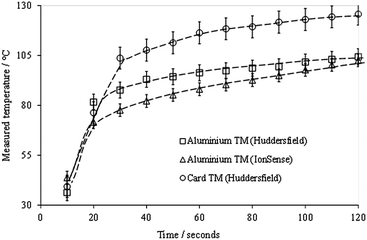
These results show that there is little difference in the initial rate of mesh heating between the different modules; however, the final temperature reached was significantly higher in the cardboard module (as expected), since the thermal conductivity of aluminium is significantly higher than that of cardboard (typically ∼230 W m−1 K−1 and <1 W m−1 K−1 respectively). The slight difference between the two aluminium modules may be explained by their different masses (IonSense 136 g; lab-built 112 g).
The temperature of the mesh can be seen to be still increasing slightly in all cases, even after two minutes' exposure to the gas stream. This is an interesting result which has obvious implications for automated experiments where the sample is only exposed to the gas stream for a few seconds; in these cases optimum ion intensities may not be reached, especially for higher-boiling components of mixtures, possibly resulting in relative suppression of these analytes.
Sample effects
Ion intensity profiles were then investigated using HPE and PB, both singly and as a mixture (5 μg of each compound was deposited onto the mesh in each experiment). The results of three replicate experiments for the two single analytes are shown in Fig. 6 (the intensities have been normalised for clarity).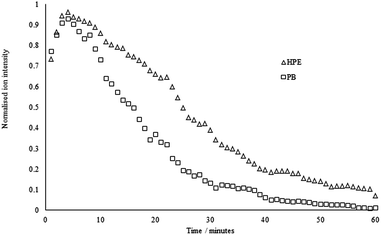 | ||
| Fig. 6 Normalised ion intensity profiles for HPE and PB (500 ppm individual samples), set temperature = 400 °C. | ||
The profiles in each case follow the same general pattern; there is an initial rise during the first 2–3 minutes that we attribute to the increasing temperature of the mesh within the transmission module. This is followed by a gradual decline as the material is consumed.
A mixture of HPE and PB was then analysed (5 μg of each compound); Fig. 7 shows the ion intensity profile for each analyte in the mixture.
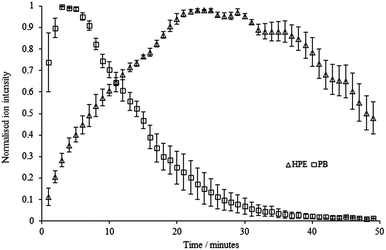 | ||
| Fig. 7 Normalised ion intensity profiles for HPE and PB (500 ppm of each in a mixture), set temperature = 400 °C. | ||
It is immediately obvious that the profile for HPE has changed considerably. PB has a maximum ion intensity at ca. 3–5 minutes, as before, whereas HPE does not reach its maximum until around 25 minutes. Therefore, any semi-quantitative comparison of ion intensities in such experiments would give results which were extremely time-dependent. At t = 1 min, the PB/HPE ratio is approximately 10![[thin space (1/6-em)]](https://www.rsc.org/images/entities/char_2009.gif) :
:![[thin space (1/6-em)]](https://www.rsc.org/images/entities/char_2009.gif) 1 whereas at t = 25 min it is approximately 1
1 whereas at t = 25 min it is approximately 1![[thin space (1/6-em)]](https://www.rsc.org/images/entities/char_2009.gif) :
:![[thin space (1/6-em)]](https://www.rsc.org/images/entities/char_2009.gif) 10, corresponding to a 100-fold difference in ratio. We are uncertain what the causes of this effect are, although it is reproducible. It is unlikely to be due to the melting points of the two compounds as they are very similar and our temperature experiments indicate that the sample does not reach the boiling/decomposition temperature for either analyte. More complex factors including their relative proton affinities, their affinity for the mesh surface and mutual interactions in the liquid phase may all play a role.
10, corresponding to a 100-fold difference in ratio. We are uncertain what the causes of this effect are, although it is reproducible. It is unlikely to be due to the melting points of the two compounds as they are very similar and our temperature experiments indicate that the sample does not reach the boiling/decomposition temperature for either analyte. More complex factors including their relative proton affinities, their affinity for the mesh surface and mutual interactions in the liquid phase may all play a role.
Conclusions
We have demonstrated that the transmission module, temperature and analysis time all have an effect on the observed ion intensity. In addition, there may be further complicating factors that impact both high-throughput analysis (due to the short time the sample is in the gas stream) and quantitative analysis of some mixtures (due to the large variation in ion ratios). Future studies will probe the extent of this effect. In addition, since these experiments used a 1![[thin space (1/6-em)]](https://www.rsc.org/images/entities/char_2009.gif) :
:![[thin space (1/6-em)]](https://www.rsc.org/images/entities/char_2009.gif) 1 ratio, the effect of varying the HPE/PB ratio will be probed.
1 ratio, the effect of varying the HPE/PB ratio will be probed.
Experimental
Mass spectrometer
Samples were analysed using a DART-100 source (KR Analytical, UK) with a Vapur interface and a GIST inlet attached to a Bruker HCT ion trap mass spectrometer (Bruker UK Ltd, Coventry, UK; typical resolution ≈ 500). The DART settings were as follows: discharge needle voltage 3000 V, discharge electrode voltage 400 V, grid electrode voltage 400 V. The helium flow rate was maintained at 1.5 L min−1 unless stated otherwise and the gas temperature was varied as described in the text. The DART-sample-inlet distance was fixed at 12 mm. Mass spectra were recorded in positive ion mode over a m/z range of 50–1000 Th, and processed using Bruker's DataAnalysis software. For ion intensity experiments, spectra were averaged over 0.1 minute intervals every 60 s.Transmission module and temperature effects
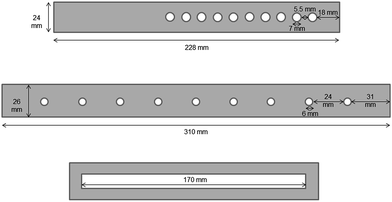
Temperature experiments were carried out using three different transmission modules: (a) JVL-2100 A (Rev 2, IonSense Inc., USA) which is constructed from aluminium; (b) a module laboratory-built to a similar design, also from aluminium and (c) a module made of high grade cardboard (Fig. 8). This latter was included since an alternative TMDART source, the ID-Cube, is widely used which incorporates the sample mesh in a disposable cardboard holder (OpenSpot sampling cards).A Comark 2001 digital thermometer was used (Comark Electronics Ltd, Sussex, UK) with a 0.5 mm stainless steel sheathed K-type thermocouple. For the experiments without mesh present, the probe was held between the two halves of each holder with its tip in the centre of the hole. For the temperature measurements with the mesh in place, the probe tip was woven into the mesh to ensure good contact, again with its tip in the centre of the hole.
Sample effects
The effect of the nature of the sample on ion intensity profiles was investigated using two chemically-similar compounds: N-(4-hydroxyphenyl)ethanamide, HPE (Sigma Aldrich, Dorset, UK) and N-phenylbenzamide, PB (Mersey Chemicals, Liverpool, UK) which were used as received.The following solutions were prepared for analysis using HPLC-grade methanol (Fisher Scientific, Loughborough, UK): HPE (500 ppm), PB (500 ppm), mixture of HPE and PB (500 ppm of each). Aliquots (10 μL, 5 μg of each compound) were spotted onto type 304 stainless steel mesh (Mesh UK, Marlow, UK) using an Eppendorf pipettor (10–100 μL), and allowed to dry prior to analysis using DARTMS.
Notes and references
- (a) R. B. Cody, J. A. Laramée and H. D. Durst, Anal. Chem., 2005, 77, 2297–2302 CrossRef CAS PubMed; (b) R. B. Cody, J. A. Laramée, J. M. Nilles and H. D. Durst, JEOL News, 2005, 40, 8–12 Search PubMed; (c) L. Song, S. C. Gibson, D. Bhandari, K. D. Cook and J. E. Bartmess, Anal. Chem., 2009, 81, 10080–10088 CrossRef CAS PubMed.
- (a) C. Y. Pierce, J. R. Barr, R. B. Cody, R. F. Massung, A. R. Woolfitt, H. Moura, H. A. Thompson and F. M. Fernández, Chem. Commun., 2007, 807–809 RSC; (b) C. Lapthorn and F. Pullen, Eur. J. Mass Spectrom., 2009, 15, 587–593 CrossRef CAS PubMed; (c) S. Yu, E. Crawford, J. Tice, B. Musselman and J.-T. Wu, Anal. Chem., 2009, 81, 193–202 CrossRef CAS PubMed.
- N. J. Smith, M. A. Domin and L. T. Scott, Org. Lett., 2008, 10, 3493–3496 CrossRef CAS PubMed.
- Y. Zhao, M. Lam, D. Wu and R. Mak, Rapid Commun. Mass Spectrom., 2008, 22, 3217–3224 CrossRef CAS PubMed.
- S. D. Maleknia, T. M. Vail, R. B. Cody, D. O. Sparkman, T. L. Bell and M. A. Adams, Rapid Commun. Mass Spectrom., 2009, 23, 2241–2246 CrossRef CAS PubMed.
- J. Krechmer, J. Tice, E. Crawford and B. Musselman, Rapid Commun. Mass Spectrom., 2011, 25, 2384–2388 CrossRef CAS PubMed.
- S. E. Edison, L. A. Lin, B. M. Gamble, J. Wong and K. Zhang, Rapid Commun. Mass Spectrom., 2011, 25, 127–139 CrossRef CAS PubMed.
- J. M. Nilles, T. R. Connell and H. D. Durst, Analyst, 2010, 135, 883–886 RSC.
- (a) G. A. Harris and F. M. Fernández, Anal. Chem., 2009, 81, 322–329 CrossRef CAS PubMed; (b) G. A. Harris, D. M. Hostetler, C. Y. Hampton and F. M. Fernández, J. Am. Soc. Mass Spectrom., 2010, 21, 855–863 CrossRef CAS PubMed; (c) G. A. Harris, C. E. Falcone and F. M. Fernández, J. Am. Soc. Mass Spectrom., 2012, 23, 153–161 CrossRef CAS PubMed.
- (a) A. H. Grange, Environ. Forensics, 2008, 9, 127–136 CrossRef CAS; (b) A. H. Grange, Environ. Forensics, 2008, 9, 137–143 CrossRef CAS.
- J. J. Pérez, G. A. Harris, J. E. Chipuk, J. S. Brodbelt, M. D. Green, C. Y. Hampton and F. M. Fernández, Analyst, 2010, 135, 712–719 RSC.
- P. Di Martino, P. Conflant, M. Drache, J.-P. Huvenne and A.-M. Guyot-Hermann, J. Therm. Anal., 1997, 48, 447–458 CrossRef CAS; M. Sacchetti, J. Therm. Anal. Calorim., 2001, 63, 345–350 CrossRef.
- E. Schnitzler, K. Lençone and M. Kobelnik, Exact and Soil Sciences, Agrarian Science and Engineering, 2002, 8, 91–100 Search PubMed.
- M. A. R. Matos, M. S. Miranda, V. M. F. Morais and J. F. Liebman, Mol. Phys., 2006, 104, 2855–2860 CrossRef CAS; P. Umnahanant and J. Chickos, J. Chem. Eng. Data, 2012, 57, 1331–1337 CrossRef.
- ChemSpider Database, Royal Society of Chemistry, Cambridge, UK, http://www.chemspider.com/Chemical-Structure.6900.html, accessed 29.7.13.
- Determined experimentally using a 1
![[thin space (1/6-em)]](https://www.rsc.org/images/entities/char_2009.gif) :
:![[thin space (1/6-em)]](https://www.rsc.org/images/entities/char_2009.gif) 1 mixture.
1 mixture.
| This journal is © The Royal Society of Chemistry 2014 |

