 Open Access Article
Creative Commons Attribution 3.0 Unported Licence
Using electron paramagnetic resonance to map N@C60 during high throughput processing
Simon R.
Plant†
* and
Kyriakos
Porfyrakis
Department of Materials, University of Oxford, Parks Road, Oxford OX1 3PH, UK. E-mail: s.r.plant@bham.ac.uk
First published on 10th June 2014
Abstract
The endohedral fullerene molecule, N@C60, is a candidate for molecular spin qubits (quantum bits) and spin probes owing to its exceptional electron spin properties. Advancements in the processing of N@C60 are key to obtaining samples of high purity on a reasonable timescale. We investigate enrichment by high throughput processing (flow rate of 18 L h−1 and operating pressure of 1.5–2 MPa) using high performance liquid chromatography (HPLC) as a means of scaling N@C60 production. We use detection by electron paramagnetic resonance (EPR) spectroscopy to map N@C60 during processing, and through the reconstruction of the peak position in the chromatogram, we are able to determine the retention time and relative purity of N@C60 without the need for its isolation. Based on this, we establish a procedure for time-efficient, high throughput processing to isolate N@C60 in high purity.
1 Introduction
High performance liquid chromatography (HPLC) offers a means of separating mixtures of endohedral fullerenes1 in solution, according to parameters such as mass, structural isomerism and polarizability. The technique is therefore particularly effective in isolating individual endohedral metallofullerenes2 owing to pronounced variations in size (mass and structure) of the fullerene cage, as well as variations in the encapsulated elements. It is also possible to isolate endohedral fullerenes such as N@C60 (ref. 3) – which is generated through the direct ion bombardment of C60 – using recycling HPLC,4,5 and this is in spite of a yield of 10−5 to 10−4 (N@C60/C60) in the starting material and a mass difference of only 2% between the two molecules. N@C60 is paramagnetic, exhibiting narrow EPR (electron paramagnetic resonance) linewidths, and has been selected as a model spin system in which to demonstrate EPR techniques.6 Prompted by proposals for a scalable quantum computing architecture,7,8 N@C60 has been investigated extensively as a molecular spin qubit (quantum bit),9–13 utilising the long decoherence time (e.g. 0.25 ms at 170 K (ref. 14)) of its electron spin. EPR investigations of N@C60 incorporated into nanostructures,15 liquid crystals16–18 and crystalline matrices19,20 have additionally highlighted its potential as a spin probe. N@C60 has also been used for single-molecule transistors,21,22 enabling the measurement of spin excitations from electron tunnelling spectra.In order to avoid the fullerene cluster formation that may influence both the spin lattice relaxation (T1) and phase decoherence (T2) times, experiments require the preparation of dilute solutions of N@C60 in high purity (>50%). Samples of high purity are also required for schemes that have recently been developed to synthesize N@C60–N@C60 dimers.23,24 Such molecules represent isolated pairs of molecular electron spin centres that can permit the investigation of controlled spin–spin coupling and may also enable the demonstration of quantum entanglement of the electron spins. Although there is a demand for super-milligram quantities of N@C60, advancements in production, combined with analysis during the processing of N@C60, are needed. Chromatographic separation with inline EPR detection has been demonstrated before to discriminate between the paramagnetic metallofullerenes Y@C82 and Sc3@C82.25 HPLC-EPR has the advantage of detecting paramagnetic species amidst empty-cage fullerenes and diamagnetic metallofullerenes, but it has not been widely adopted as a general technique within the field. The drawback is in the selection of parameters for continuous-wave (CW) EPR detection: spectral resolution may be lost at the expense of improved signal-to-noise ratio, a relatively large spectral window may be required to observe the line profile of both species and it is unlikely that a single set of optimal parameters can be used to detect multiple species simultaneously. However, CW-EPR detection is readily applicable to N@C60 as a single set of optimized parameters can be used.
Here, we introduce high-throughput HPLC (flow rate of 18 L h−1) processing of N@C60, which has a capacity of up to 17 times that of previous reports. We use EPR detection to map N@C60 during processing, and through the reconstruction of the peak in the chromatogram, we are able to determine precisely the retention and relative purity of N@C60 as a function of time, without the need for its isolation. This allows us to establish a procedure for time-efficient, high throughput processing in order to isolate N@C60 in high purity.
2 Experimental section
C60 powder (99.5+%) was supplied by the MER corporation. The toluene was HPLC grade (99.8%) purchased from Fisher. N@C60 was produced by the ion bombardment of sublimated C60 with ionized nitrogen at a beam energy of 40 eV.26 This method yields a soot consisting of N@C60:C60 in the ratio of typically 1![[thin space (1/6-em)]](https://www.rsc.org/images/entities/char_2009.gif) :
:![[thin space (1/6-em)]](https://www.rsc.org/images/entities/char_2009.gif) 105. The soot was dissolved in toluene and filtered to remove particles greater than 0.2 μm. Batches of fullerene soot containing 15N@C60 were produced using isotopically enriched nitrogen gas.
105. The soot was dissolved in toluene and filtered to remove particles greater than 0.2 μm. Batches of fullerene soot containing 15N@C60 were produced using isotopically enriched nitrogen gas.
The chromatographic separation of N@C60 and C60 was performed using an LC-250HS recycling HPLC apparatus connected to a Cosmosil 15PBB column (100 mm × 500 mm), using injection volumes of 170 mL, which is the maximum loading capacity of the HPLC apparatus. The maximum flow rate of 300 mL min−1 was used throughout, at an operating pressure of 1.5–2 MPa, in order to minimize the retention time of C60 on the column. The UV detector wavelength was fixed at 312 nm during processing. Thereafter, a LC-908W HPLC apparatus connected to a Cosmosil 5PBB column was used for the isolation of high purity N@C60. EPR measurements were made using a continuous-wave (CW) Magnettech Miniscope MS200 spectrometer operating at X-band (∼9.5 GHz) and equipped with a rectangular TE102 cavity. For comparative studies, the acquisition parameters were identical for all measurements: microwave power of 0.32 mW, modulation amplitude of 0.02 mT, sweep width of 3.50 mT, sweep time of 90 s and 20 scans. This enabled a direct comparison of the relative line intensities of the samples. Optical absorbance was measured using a JASCO V-570 spectrophotometer at a wavelength of 495 nm in ambient conditions.
3 Results and discussion
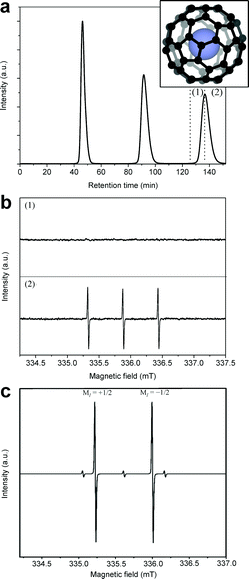
A comparison of the chromatographic columns used previously for N@C60 enrichment shows that HPLC processing is limited to typical injection volumes of 10 mL and flow rates of 18 mL min−1 at a preparative scale.5,27,28 With the aim of increasing throughput, we introduced a new apparatus offering maximum injection volumes of 170 mL and flow rate of 300 mL min−1 coupled to a new chromatographic column with a loading capacity of 1 L. The stationary phase of the chromatographic column consists of 15 μm silica particles functionalized with pentabromobenzyl (PBB) groups. The size of the particles within the stationary phase was selected so as to maintain an operating pressure of 1.5–2 MPa at maximum flow rate. The general procedure is to inject the as-produced mixture of N@C60/C60 into the column, and after the sample elutes, to divide it into two fractions. The first fraction corresponds to the first half of the peak in the chromatogram; the second fraction corresponds to the second half of the peak (as denoted in Fig. 1(a)). Due to the delay in the retention time of N@C60 in the column, the majority of N@C60 within the sample elutes in the second fraction. We can regard fraction 1 as being ‘spin-depleted’, and fraction 2 as being ‘spin-enriched’. Fraction 1 contains (mostly) C60 and is discarded. The remainder of the sample is then injected at time intervals, so that all of the material reaches the same purity before proceeding to stage 2. In stage 2, fraction 2 is injected through the column and the procedure is repeated.In general, locking the sample in recycling mode during processing by HPLC affords increased separation between the retention times of N@C60 and C60 when eluting from the column. Fig. 1(a) shows a typical chromatogram for an N@C60 and C60 mixture as it passes through the 15PBB column for 3 cycles, whereby the sample is collected during the third cycle. The reasons for collecting the sample during the third cycle were two-fold. (1) It was evident from the chromatogram that the third peak would tail into the fourth due to peak broadening, indicating that the fraction 2 component could become de-enriched after the third cycle. (2) The capacity of the solvent reservoir is 10 L; 7.5 L of toluene were required to collect fractions 1 and 2, shown in Fig. 1(a), at the third cycle. Collecting the sample on subsequent cycles may well have exhausted the toluene in the reservoir.
This procedure proved effective in containing the N@C60 within fraction 2 as evidenced by the EPR spectra shown in Fig. 1(b), which reveals the characteristic triplet of 14N@C60. (The more abundant isotope of nitrogen, 14N, was used to produce the N@C60 used in these initial studies.) At this flow rate, the retention time of C60 is circa 45 minutes. Consequently, one injection lasting 3 cycles takes ∼152 minutes (as shown in Fig. 1). However, using the LC-250HS recycling HPLC apparatus, we are able to inject up to 170 mL at a time. Each sample has to pass through 6 stages of HPLC processing before it is pure enough to move to the next phase of the process.
As 15N@C60 was used in further work to demonstrate mapping in the chromatogram, Fig. 1(c) shows an example of an X-band CW-EPR spectrum of dilute 15N@C60 (dissolved in toluene and at room temperature) following several stages of enrichment. The 15N@C60 spin system consists of an S = 3/2 electron spin coupled to an I = 1/2 nuclear spin. The spectrum reveals the hyperfine lines (intense doublet) corresponding to the MI = +1/2 and MI = −1/2 nuclear spin states. The hyperfine lines of 14N@C60 (low intensity triplet), corresponding to the MI = ±1, 0 nuclear spin states of 14N, are visible above the baseline. The presence of 14N@C60 is due to the 14N content in the nitrogen gas when 15N@C60 is first synthesized.
3.1 Mapping N@C60 in the chromatogram
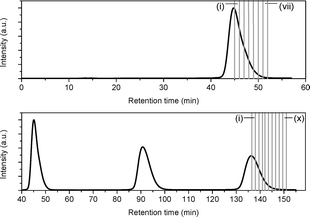
Due to the close retention times of N@60 and C60, it is not possible to resolve the peak corresponding N@C60 in the chromatogram directly during early processing. However, by collecting a larger number of sub-fractions and measuring the EPR spectra of a standard aliquot from each fraction, the N@C60 peak can be reconstructed and its position mapped. To this end, 170 mL of an as-produced 15N@C60/C60 mixture was injected into the 15PBB column, and after one cycle, the fraction corresponding to the second half of the peak was split into sub-fractions, where each sub-fraction was collected over a period of one minute (see Fig. 2). In a second experiment, we injected another 170 mL of the mixture into the column, and locked the sample in recycling mode, so that the sample passed through the column for a total of 3 cycles (also shown in Fig. 2). On the third cycle, we repeated the procedure for the first experiment, collecting 10 sub-fractions, where each sub-fraction was collected over a period of 1.5 minutes (with the exception of sub-fraction iv, which was collected over a period of 1 minute).An aliquot from each sub-fraction was taken and concentrated ten times. 0.15 mL of the solution was placed in a quartz tube, in order to carry out EPR measurements. As for Fig. 1(c), the most intense lines in the EPR spectra arise from 15N@C60, with the 3 lines corresponding to 14N@C60 observable just above the level of the baseline noise. These weak lines arising from 14N@C60 were disregarded for the purpose of this experiment; measurements were made on the lines corresponding to 15N@C60 only. The line intensity was determined by measuring the peak-to-trough amplitude of each of the two hyperfine lines in the spectrum and taking the average. As the linewidths are invariant between spectra, measuring the amplitude of the hyperfine lines offers a convenient method for quantitative analysis,29 because under this condition, the signal amplitude is proportional to the number of spins measured. Fig. 3(a) shows a plot of the line intensity as a function of time elapsed in the HPLC chromatogram for the 1st and 3rd cycles through the 15PBB column. This effectively maps the position of the peak corresponding to N@C60 in the chromatogram at cycles 1 and 3. The bars in the plot denote the sub-fractions corresponding to the chromatograms shown in Fig. 2. The data have been fitted with modified (skewed) Gaussian distributions, which are otherwise used for fitting chromatograms. It is evident from Fig. 3(a), in comparing the maxima of the reconstructed peaks, that the peak of N@C60 has shifted to the right by a time of 3 min 18 s after 3 cycles, while the intensity falls by approximately two-thirds. These data also indicate elution times of 1 min 18 s and 4 min 36 s (relative to the C60 peak in the chromatogram) for cycles 1 and 3, respectively. This compares favourably with the data for other chromatographic columns used for N@C60 processing on a preparative scale. Taking the ratio of the retention time of N@C60 to that of C60 provides a simple measure of the efficiency of the column. Based on reports for the 5PYE and 5PBB columns,5 these ratios are approximately 1.01 and 1.03, respectively. The ratio for the 15PBB column in the present work is 1.03 (based on analysis for both cycles 1 and 3), indicating that the column exhibits comparable efficiency in separating N@C60 from C60, based on peak maxima.
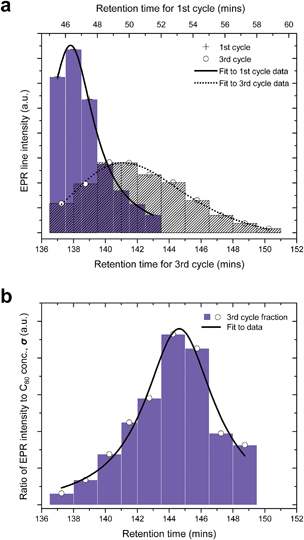 | ||
| Fig. 3 Mapping the position of the N@C60 peak in the chromatogram. (a) Plot showing EPR line intensity as a function of time elapsed in the HPLC chromatogram after cycles 1 and 3. The bars indicate the fractions collected corresponding to Fig. 2. (b) The evolution of the ratio of the EPR signal intensity and the concentration of C60 (σ) as a function of time elapsed in the HPLC chromatogram. | ||
Fig. 3(a) also confirms that the majority of N@C60 is contained in the second fraction. However for both cycles 1 and 3, a proportion of the N@C60 is retained within the first fraction. One motivation for this study was to assess the efficacy of collecting fraction 2 on the third cycle, rather than on the first. Whilst the separation in the elution times for N@C60 and C60 is enhanced at the third cycle (as measured by the peak maxima), the distribution changes due to peak broadening, and consequently its intensity is diminished. Significantly, the areas under the curves, proportional to the number of electron spins (and therefore to the quantity of N@C60) are comparable for cycles 1 and 3. Therefore, if one wishes to obtain purified N@C60 time-efficiently whilst keeping losses to a minimum, then it is recommended that one cycle through the 15PBB column is sufficient in future work. Alternatively, smaller quantities of higher purity N@C60 can be collected during the third cycle, as discussed below.
As a measure of sample purity, we introduce a figure of merit, σ, which is the relative spin concentration (spin centres with respect to C60). We determine σ by taking the ratio of the EPR line intensity to the concentration of C60, given that the line intensity is proportional to the number of spins and molar concentration of the sample is proportional to the number of C60 molecules. In order to calculate the concentration of C60 in each of the sub-fractions, several samples of C60 in HPLC grade toluene were prepared at known concentrations and the absorbance of each of these samples was measured. The molar absorption coefficient, ε, was extracted by plotting a calibration curve of absorbance against concentration for the aforementioned samples. The absorbance (at 495 nm) of each of the sub-fractions was measured, and the concentrations were calculated using Beer–Lambert's Law, A = εcl, where A is the absorbance, ε is the molar absorption coefficient (as stated above), c is the molar concentration and l is the pathlength. Fig. 3(b) shows a plot of σ as a function of the time elapsed in the HPLC chromatogram for cycle 3. The best fit to the data was achieved using a Lorentzian distribution. Fig. 3(b) reveals that the highest purity of N@C60 can be obtained from sub-fractions vi and vii, by collecting between circa 143 and 147 minutes.
3.2 Isolation of 15N@C60 in high purity
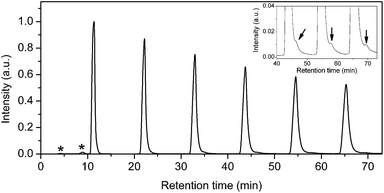
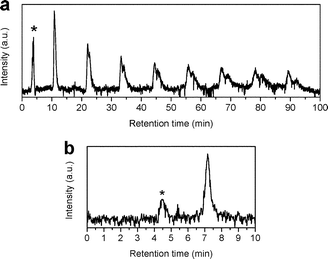
Two batches of 15N@C60/C60 mixtures were prepared using the 15PBB column. At the end of stage 6, the total volume of solution had reduced to <20 mL, which is <12% of the total injection capacity permitted by the LC-250HS recycling HPLC apparatus. Therefore, after stage 6, it is no longer advantageous to use the 15PBB for enrichment. It was appropriate to move to the LC-908W HPLC apparatus connected to a 5PBB column, for which the injection volume capacity is 10 mL and the retention time for C60 is ∼11 minutes for a flow rate of 18 mL min−1 at ambient temperature. Fig. 4 shows a typical chromatogram for a 15N@C60/C60 mixture passing through the 5PBB column (eluent: toluene, flow rate: 18 mL min−1, injection volume: 10 mL, ambient temperature). Firstly, minor impurities appear with retention times circa 4 and 9 minutes, which arise following concentration of the sample using a rotary evaporator, and these are discarded. The creation of these impurities may be limited by reducing the bath temperature of the rotary evaporator to <30 °C, which also reduces rate of evaporation thereby increasing the time required to concentrate samples. Recycling of the 15N@C60/C60 mixture through the 15PBB column is used in order to monitor the emergence of other impurities – an example being N2@C60 (ref. 28) – as marked by the arrow in the inset of Fig. 4. Such impurities were not removed, but were collected along with the second fraction when the sample was divided into two fractions (corresponding to the first and second halves of the peak) during the sixth cycle. N2@C60 was removed from the 15N@C60/C60 mixture using recycling HPLC at a later stage.The chromatogram from the final stage of processing is shown in Fig. 5(a). Recycling HPLC was used to separate C60 from 15N@C60 (eluent: toluene; flow rate: 18 mL min−1; column: 5PBB). The single peak in the chromatogram begins to split into two, corresponding to C60 and 15N@C60, during the second cycle. At the eighth cycle, two fractions were collected corresponding to these peaks. Due to the way the peaks corresponding to C60 and 15N@C60 overlap at the eighth cycle, this provided an 15N@C60 sample of >50% purity. This high purity 15N@C60 sample was then concentrated and injected through the Buckypriep-M column (eluent: toluene; flow rate: 18 mL min−1) in order to quantify the sample based on the integrated peak area (see Fig. 5(b)). Yields achieved by following the procedure set out here will be comparable with other procedures for the HPLC processing of N@C60.
4 Conclusions
We have introduced high throughput HPLC processing for the purification (enrichment) of N@C60, using flow rates of 18 L hour−1 and pressures of up to 2 MPa. The use of a high capacity HPLC apparatus permits injection volumes of 170 mL, which is up to 17× the injection volumes used in previous work. Further modifications of the HPLC apparatus may enable us to take advantage of the maximum loading capacity of the 15PBB column by injecting 1 L of sample solution per injection.Additionally, we have used electron paramagnetic resonance spectroscopy as a means to map N@C60 during high throughput processing, in order to determine the retention times and relative purity without the need for its isolation. Mapping the peak in the chromatogram has enabled us to demonstrate that the 15PBB column itself has a comparable efficiency to the 5PYE and 5PBB columns used previously, and it has allowed us to develop a procedure for the time-efficient, high throughput enrichment of N@C60.
The goal of the present work was to obtain the largest absolute quantities of N@C60 at the highest possible purity on a reasonable timescale. Therefore, we conclude the most time-efficient means of purifying N@C60whilst minimizing losses is to use the high capacity apparatus to pass a sample containing N@C60 through the 15PBB column for one cycle, and then to collect the fraction corresponding to the second half of the peak in the chromatogram. The process is then repeated 6 times until the same sample has been enriched sufficiently to move to a smaller column, such as the 5PBB, whereby the sample is injected through the column in recycling mode, ultimately permitting the isolation of high purity N@C60. Alternatively, we have shown that, in order to collect smaller quantities of high purity N@C60 efficiently (without the constraint to minimize losses), the following route is possible. The sample containing N@C60 is injected into the high capacity HPLC system, locked in recycling mode for 2 cycles, and then at the 3rd cycle, the N@C60-rich sample is collected between circa 143 and 147 minutes. The collected sample is concentrated and the procedure is repeated until the required purity has been reached.
The method of scaled processing demonstrated here improves the feasibility of utilising N@C60 for applications, such as for spin probes or molecular qubits.
Acknowledgements
We thank Andrew Briggs for supporting this work, and Hippolyte Queudet for his assistance. S. R. P. acknowledges support from EPSRC. K. P. is also supported by EPSRC (EP/K030108/1).References
- A. A. Popov, S. Yang and L. Dunsch, Chem. Rev., 2013, 113, 5989–6113 CrossRef CAS PubMed
.
- H. Shinohara, Rep. Prog. Phys., 2000, 63, 843–892 CrossRef CAS
.
- T. Almeida Murphy, Th. Pawlik, A. Weidinger, M. Höhne, R. Alcala and J.-M. Spaeth, Phys. Rev. Lett., 1996, 77, 1075–1078 CrossRef
.
- P. Jakes, K.-P. Dinse, C. Meyer, W. Harneit and A. Weidinger, Phys. Chem. Chem. Phys., 2003, 5, 4080–4083 RSC
.
- M. Kanai, K. Porfyrakis, G. A. D. Briggs and T. J. S. Dennis, Chem. Commun., 2004, 210–211 RSC
.
- J. J. L. Morton, A. M. Tyryshkin, A. Ardavan, K. Porfyrakis, S. A. Lyon and G. A. D. Briggs, J. Chem. Phys., 2005, 122, 174504 CrossRef PubMed
.
- W. Harneit, Phys. Rev. A: At., Mol., Opt. Phys., 2002, 65, 032322 CrossRef
.
- S. C. Benjamin, A. Ardavan, G. A. D. Briggs, D. A. Britz, D. Gunlycke, J. Jefferson, M. A. G. Jones, D. F. Leigh, B. W. Lovett, A. N. Khlobystov, S. A. Lyon, J. J. L. Morton, K. Porfyrakis, M. R. Sambrook and A. M. Tyryshkin, J. Phys.: Condens. Matter, 2006, 18, S867–S883 CrossRef CAS
.
- C. Meyer, W. Harneit, B. Naydenov, K. Lips and A. Weidinger, Appl. Magn. Reson., 2004, 27, 123–132 CrossRef CAS
.
- J. J. L. Morton, A. M. Tyryshkin, A. Ardavan, K. Porfyrakis, S. A. Lyon and G. A. D. Briggs, Phys. Rev. Lett., 2005, 95, 200501 CrossRef
.
- J. J. L. Morton, A. M. Tyryshkin, A. Ardavan, S. C. Benjamin, K. Porfyrakis, S. A. Lyon and G. A. D. Briggs, Nat. Phys., 2006, 2, 40–43 CrossRef CAS
.
- G. W. Morley, J. van Tol, A. Ardavan, K. Porfyrakis, J. Zhang and G. A. D. Briggs, Phys. Rev. Lett., 2007, 98, 220501 CrossRef
.
- R. M. Brown, A. M. Tyryshkin, K. Porfyrakis, E. M. Gauger, B. W. Lovett, A. Ardavan, S. A. Lyon, G. A. D. Briggs and J. J. L. Morton, Phys. Rev. Lett., 2011, 106, 110504 CrossRef
.
- J. J. L. Morton, A. M. Tyryshkin, A. Ardavan, K. Porfyrakis, S. A. Lyon and G. A. D. Briggs, J. Chem. Phys., 2006, 124, 014508 CrossRef PubMed
.
- T. Wakahara, T. Kato, K. Miyazawa and W. Harneit, Carbon, 2012, 50, 1709–1712 CrossRef CAS PubMed
.
- P. Jakes, N. Weiden, R.-A. Eichel, A. Gembus, K.-P. Dinse, C. Meyer, W. Harneit and A. Weidinger, J. Magn. Reson., 2002, 156, 303–308 CrossRef CAS
.
- C. Meyer, W. Harneit, K. Lips, A. Weidinger, P. Jakes and K.-P. Dinse, Phys. Rev. A: At., Mol., Opt. Phys., 2002, 65, 061201 CrossRef
.
- G. Liu, M. C. Gimenez-Lopez, M. Jevric, A. N. Khlobystov, G. A. D. Briggs and K. Porfyrakis, J. Phys. Chem. B, 2013, 117, 5925–5931 CrossRef CAS PubMed
.
- B. Naydenov, C. Spudat, W. Harneit, H. I. Süss, J. Hulliger, J. Nuss and M. Jansen, Chem. Phys. Lett., 2006, 424, 327–332 CrossRef CAS PubMed
.
- J. Yang, P. Feng, A. Sygula, W. Harneit, J.-H. Su and J. Du, Phys. Lett. A, 2012, 376, 1748–1751 CrossRef CAS PubMed
.
- N. Roch, R. Vincent, F. Elste, W. Harneit, W. Wernsdorfer, C. Timm and F. Balestro, Phys. Rev. B: Condens. Matter Mater. Phys., 2011, 83, 081407(R) CrossRef
.
- J. E. Grose, E. S. Tam, C. Timm, M. Scheloske, B. Ulgut, J. J. Parks, H. D. Abruña, W. Harneit and D. C. Ralph, Nat. Mater., 2008, 7, 884–889 CrossRef CAS PubMed
.
- B. J. Farrington, M. Jevric, G. A. Rance, A. Ardavan, A. N. Khlobystov, G. A. D. Briggs and K. Porfyrakis, Angew. Chem., Int. Ed., 2012, 51, 3587–3590 CrossRef CAS PubMed
.
- S. R. Plant, M. Jevric, J. J. L. Morton, A. Ardavan, A. N. Khlobystov, G. A. D. Briggs and K. Porfyrakis, Chem. Sci., 2013, 4, 2971–2975 RSC
.
- S. Stevenson, H. C. Dorn, P. Burbank, K. Harich, Z. Sun, C. H. Kiang, J. R. Salem, M. S. DeVries, P. H. M. van Loosdrecht, R. D. Johnson, C. S. Yannoni and D. S. Bethune, Anal. Chem., 1994, 66, 2680–2685 CrossRef CAS
.
- K. Lips, M. Waiblinger, B. Pietzak and A. Weidinger, Phys. Status Solidi A, 2000, 177, 81–91 CrossRef CAS
.
- A. Weidinger, M. Waiblinger, B. Pietzak and T. Almeida Murphy, Appl. Phys. A: Mater. Sci. Process., 1998, 66, 287–292 CrossRef CAS
.
- T. Suetsuna, N. Dragoe, W. Harneit, A. Weidinger, H. Shimotani, S. Ito, H. Takagi and K. Kitazawa, Chem.–Eur. J., 2002, 8, 5079–5083 CrossRef CAS
.
-
G. R. Eaton, S. S. Eaton, D. P. Barr and R. T. Weber, Quantitative EPR, Springer, Vienna, 2010 Search PubMed
.
Footnote |
| † Present address: Nanoscale Physics Research Laboratory, School of Physics and Astronomy, University of Birmingham, Birmingham, B15 2TT, UK. |
| This journal is © The Royal Society of Chemistry 2014 |

