 Open Access Article
A purge and trap integrated microGC platform for chemical identification in aqueous samples†
Muhammad
Akbar
a,
Shree
Narayanan
a,
Michael
Restaino
b and
Masoud
Agah
*a
aVT MEMS Lab, Bradley Department of Electrical and Computer Engineering, Virginia Tech, Blacksburg, Virginia 24061, USA. E-mail: agah@vt.edu
bDepartment of Engineering Science and Mechanics, Virginia Tech, Blacksburg, Virginia 24061, USA
First published on 19th May 2014
Abstract
The majority of current micro-scale gas chromatography (μGC) systems focus on air sampling to detect volatile organic compounds (VOCs). However, purging the VOCs from a water sample using microsystems is an unchartered territory. Various organic compounds used in everyday life find their way to water bodies. Some of these water organic compounds (WOCs) persist or degrade slowly, threatening not just human existence but also aquatic life. This article reports the first micro-purge extractor (μPE) chip and its integration with a micro-scale gas chromatography (μGC) system for the extraction and analysis of water organic compounds (WOCs) from aqueous samples. The 2 cm × 3 cm μPE chip contains two inlet and outlet ports and an etched cavity sealed with a Pyrex cover. The aqueous sample is introduced from the top inlet port while a pure inert gas is supplied from the side inlet to purge WOCs from the μPE chip. The outlets are assigned for draining water from the chip and for directing purged WOCs to the micro-thermal preconcentrator (μTPC). The trapped compounds are desorbed from the μTPC by resistive heating using the on-chip heater and temperature sensor, are separated by a 2 m long, 80 μm wide, and 250 μm deep polydimethylsiloxane (OV-1) coated μGC separation column, and are identified using a micro-thermal conductivity detector (μTCD) monolithically integrated with the column. Our experiments indicate that the combined system is capable of providing rapid chromatographic separation (<1.5 min) for quaternary WOCs namely toluene, tetrachloroethylene (PCE), chlorobenzene and ethylbenzene with a minimum detection concentration of 500 parts-per-billion (ppb) in aqueous samples. The proposed method is a promising development towards the future realization of a miniaturized system for sensitive, on-site and real-time field analysis of organic contaminants in water.
Introduction
Volatile organic compounds (VOCs) are emitted by a wide variety of products including solids and liquids.1 Prolonged exposure to VOCs can cause serious health effects including liver, kidney, and nervous system diseases and can even cause cancer.2–7 Similar effects have been reported for various aquatic organisms.8–10 Different analytical techniques for their detection have been reported in the literature.11–13 Microscale gas chromatography (μGC) provides a better solution with reduced size, low power consumption, and can lead to perform a handheld analysis of complex VOCs.14,15 μGC systems usually consist of an injector/preconcentrator, a separation column and a detector all developed using micro-electromechanical system (MEMS) technology.13,16–22 μTPC is one of the important components which allows the trace level detection of VOCs by accumulating them over a period of time. The trapped VOCs are then released in the form of a concentrated plug through a thermal desorption process. The separation column is coated with a stationary phase to separate the VOCs into individual components for final detection by the detector. Several reports have been published for applications of the μGC system related to homeland security, biomedical diagnostics and real-time environmental analysis.23–25 On the other hand, the detection of VOCs in aqueous matrices has not received adequate attention among the μGC community due to incompatibility of the system with aqueous matrices.26 Water is found to saturate the adsorbent in the μTPC by capturing available adsorption sites and also damage most common polymer based stationary phases resulting in changes in the retention time, selectivity and column bleeding. Extinguishing the most widely used flame ionization detector (FID) and a decrease in the sensitivity of electron capture detectors (ECDs) has also been reported.27,28 The United States Environmental Protection Agency (EPA) has specified a list of water organic compounds (WOCs) with their maximum contamination level (MCL). At levels above the specified MCL (usually in ppb), the presence of WOCs in aqueous media poses serious threat to human and aquatic life as shown in Table 1. The current methods for the identification of WOCs rely on removing them from the aqueous sample prior to analysis using a bench-top GC system. These methods include solid-phase micro-extraction (SPME), purge and trap, and hollow fiber membranes. They cannot be used for on-site monitoring of the aqueous sample and rely on transporting the sample to the laboratories. Currently, commercially available FROG-4000TM from Defiant Technologies and Water Analysis Surety Prototype (WASP) from Sandia National Laboratories are capable of performing field analysis of water contamination. Nevertheless, the systems are large, expensive, require a trained technician and rely on the conventional purge and trap mechanism. Thus, there still remains a demand for the development of a light weight, less power hungry, inexpensive independent system capable of extracting and detecting WOCs from aqueous media.| Contaminants | Potential health effect | Contamination sources | Amount recovered (ng) | Recovery | log(Kow) | MCL |
|---|---|---|---|---|---|---|
| Toluene | Nervous system, liver problems | Petroleum factories | 5.7 | 23% | 2.75 | 1 mg l−1 |
| PCE | Liver problems; increased risk of cancer | Discharge from factories and dry cleaners | 5.4 | 18% | 2.57 | 5 μg l−1 |
| Chlorobenzene | Liver and kidney problems | Discharge from chemical and agricultural chemical factories | 9 | 25% | 2.86 | 0.1 mg l−1 |
| Ethylbenzene | Liver and kidney problems | Petroleum refineries | 18.7 | 38% | 3.14 | 0.7 mg l−1 |
Previously, our group followed the direct injection method for monitoring water contamination. This approach requires additional time for removing the trapped water contents from the μTPC adsorbent (dry purge time).29 Additionally, we also reported microscale headspace sampling as a possible technique to extract WOCs,30 however, better sensitivity can be achieved through the purge and trap method.31 This paper describes fluidic integration of μGC components with our newly developed μPE chip for analyzing WOCs. The results indicate that this hybrid integrated system successfully extracted and separated four WOCs at 500 ppb concentration. This is the first realization of an easily deployable microsystem for on-site water monitoring.
Method description
General operation
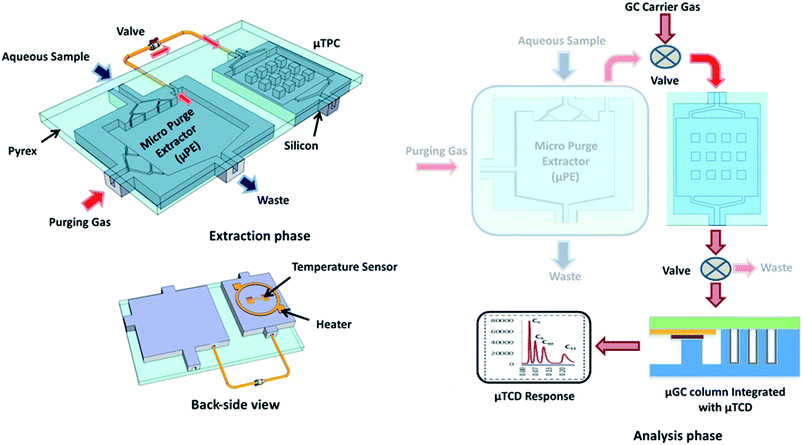
Fig. 1 shows a block diagram explaining the proposed μGC experimental setup including the μPE for extraction of WOCs from the aqueous sample. The μPE device contains two inlets, one for the aqueous sample to be analyzed and one for a pure inert gas to purge the WOCs. The distribution network for aqueous sample entrance provided at the top of the chip is used to uniformly spread the sample inside the chip. Similarly, the multiple inlets for purging gas are intended to enhance the interaction between two phases (air and water) inside the chip and to facilitate the removal of WOCs from the streaming water. The chip also contains two outlets; one is used for water waste and one for directing the purged WOCs to the trap (μTPC). The outlet for directing WOCs to the μTPC is provided at the top corner of the μPE chip. The setup is operated in two phases namely; (1) the extraction phase and (2) the analysis phase. During the extraction phase, two microfabricated chips (μPE and μTPC) are connected in a tandem configuration using a valve while the μPE chip is maintained vertically (see the ESI† video) to prevent water from entering into the μTPC chip via the air outlet. With the vial connected to the sample inlet, the aqueous solution is introduced into the μPE chip using purified nitrogen. High purity nitrogen gas is supplied through the air inlet of the μPE chip trapping WOCs on the adsorbent surface in the μTPC chip. The analyzed mass is calculated from the sample concentration and the volume of water collected during the purged time. During the analysis phase, the μPE is taken offline and the μTPC is connected in series with the μGC column with the embedded μTCD detector using a six port switching valve. Helium is used as a carrier gas while the outlet of the column is connected to the FID of a commercial Agilent HP7890 GC system for verification purposes. The sensor on the backside of the μTPC is used to monitor the temperature profile of the chip when heated. A voltage applied to the heater on the backside of the μTPC heats it up from room temperature to 150 °C. The desorbed WOCs are separated by the μGC column. A 40 mA current is sourced into a Wheatstone bridge with two resistors of the μTCD in each of its arms. The differential voltage measured across the two resistors enables the detection of WOCs which is fed into a Keithley 2700 and recorded on a LabVIEW program.μTPC on-chip sensor calibration
For accurately measuring the temperature reached during the desorption process, the on-chip heater was calibrated by placing the μTPC in a commercial GC oven and measuring the resistance for different temperatures.μGC column validation
The efficiency of the coated column was evaluated with the μTCD switched to ON condition by applying an 8.3 V DC voltage. This voltage corresponds to a temperature of 95 °C. This was measured with helium flowing at the operating pressure of 12 psi, similar to the method we have previously reported.32 The metric commonly used for column performance is height equivalent to a theoretical plate (HETP),where L is the length of the column and N is the number of theoretical plates in the column. N is calculated experimentally from the peak retention time (tr) and the peak width at half height (w1/2).
The plate number was calculated over a range of column pressures with the constant split injection ratio of 150![[thin space (1/6-em)]](https://www.rsc.org/images/entities/char_2009.gif) :
:![[thin space (1/6-em)]](https://www.rsc.org/images/entities/char_2009.gif) 1 using chlorobenzene diluted to 2% (v/v) in hexane.
1 using chlorobenzene diluted to 2% (v/v) in hexane.
μTCD characterization
The separation and identification of the four WOCs using only the column and its μTCD (without the μPE and μTPC) was performed by installing the chip inside the GC oven with its inlet and outlet connected to the injector and the GC FID, respectively. A 0.1 μl volume of the sample containing the WOCs diluted to 2% (v/v) in hexane was injected into the μGC column for separation and identification of the four WOCs by the chip.Similarly, for μTCD response calibration, five samples (0.5%, 10%, 20%, 30%, and 40% (v/v) in hexane) for each WOC were prepared and tested. A 0.1 μl of each sample was injected three times in succession using the GC autosampler module with the split ratio maintained at 150![[thin space (1/6-em)]](https://www.rsc.org/images/entities/char_2009.gif) :
:![[thin space (1/6-em)]](https://www.rsc.org/images/entities/char_2009.gif) 1. By using the density, the mass for each WOC was calculated taking the split injection ratio into account.
1. By using the density, the mass for each WOC was calculated taking the split injection ratio into account.
Materials and instruments
Reagent grade WOCs listed in Table 1, solvents, and Tenax TA (80/100 mesh) used in this work were purchased from Sigma-Aldrich (St. Louis, MO) in >99% purity. AZ9260 photoresist and OV-1 were purchased from MicroChemicals (Germany) and Ohio Valley (Marietta, OH), respectively. Silicon wafers (4 in. dia., 500 μm thick, n-type, single side polished) and Borofloat wafers (4 in. dia., 700 μm thick, double side polished) were purchased from University Wafers and Coresix Precision Glass (Williamsburg, VA), respectively. Fused capillary tubes (200 μm outer dia., and 100 μm inner dia.) were purchased from Polymicro Technologies (Phoenix, AZ).Fabrication process
Fig. 2 summarizes the fabrication process for all the three MEMS components. We have previously reported the fabrication, characterization, and operation of the μTPC and the column integrated with the μTCD.11,16–21 Herein, we briefly discuss the fabrication of these two components in addition to the fabrication of our newly developed microfabricated purge extractor.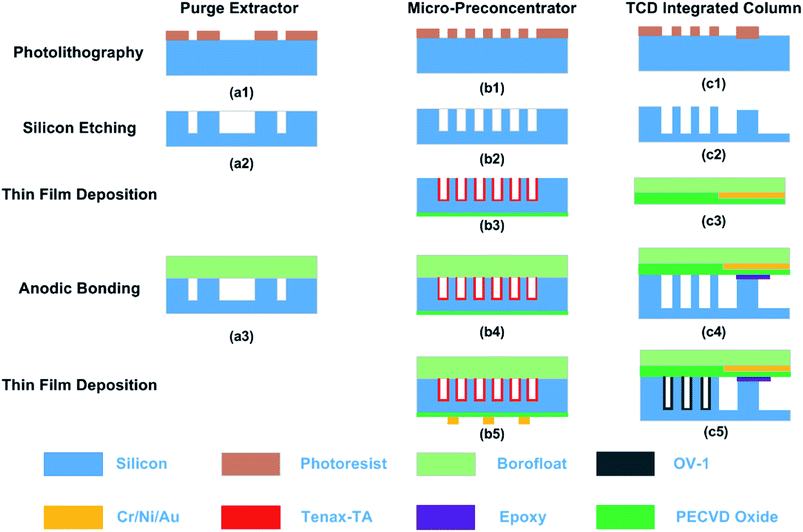 | ||
| Fig. 2 Fabrication procedure for μPE, μTPC and μGC column with a μTCD detector. The left column shows MEMS processes performed for fabricating these chips. | ||
μTPC and μPE chip
The fabrication of the μTPC was performed on a standard 4′′ wafer using MEMS processing technology. First, photolithography was performed to pattern micro-posts/fluidic ports. The wafer was then subjected to deep reactive ion etching (DRIE, Alcatel) to achieve a depth of ∼250 μm. After stripping the photoresist off the front-side, a 500 nm thick oxide layer was deposited on the backside and the wafer diced into individual chips. The chip was then filled with Tenax TA solution (10 mg ml−1 in dichloromethane) and allowed to evaporate to deposit a thin film (∼200 nm) of the polymer adsorbent on the cavity surfaces. The chip was then capped with a Borofloat wafer by anodic bonding. Following bonding, the chips were loaded onto the platen of an e-beam evaporator (PVD-250, Kurt Lesker) with the backside facing the crucible. The chips were masked by a stainless steel shadow mask patterned with the features defining the heater and the sensor. Following this, 40 nm/100 nm/25 nm of Cr/Ni/Au was deposited to get nominal resistances of 15 ohm and 250 ohm for the heater and the sensor, respectively. Finally, the devices were unloaded; the shadow masks removed off and fused capillary tubes epoxied into the inlet/outlet ports. The fabrication process of the μPE chip followed that of our μTPC but without the adsorbent coating and backside oxide/metal deposition.μGC column with embedded TCD
A two-step anisotropic etching of silicon was performed for hosting the feedthroughs and the microfluidic channel by spin coating the wafer with S1813. A shallow depth of 2–3 μm was achieved which prevented a contact between the metal interconnects on the Borofloat wafer and the walls of the separation column in silicon upon bonding. A 12 μm thick AZ9260 photoresist was patterned with a mask for subsequent deep etching of the channels resulting in 250 μm deep channels for the separation. Then, TCD resistors were fabricated on a glass substrate by utilizing a lift-off process of a 40 nm/100 nm/25 nm Cr/Ni/Au stack in the e-beam evaporator. After aligned anodic bonding of the diced detector on glass and the diced separation column on silicon, capillary tubes were epoxied into the inlet/outlet ports. The chip was static coated with polydimethylsiloxane by filling it with a solution of 10 mg ml−1 OV-1 in pentane, followed by carefully sealing one end with wax and pulling a vacuum at the open end. This procedure left a thin layer of OV-1 coating (∼250 nm) on the walls of the column channel. An SEM image of the Tenax TA and OV-1 coating is shown in Fig. 3. The optical image of all fabricated chips is shown in Fig. 4.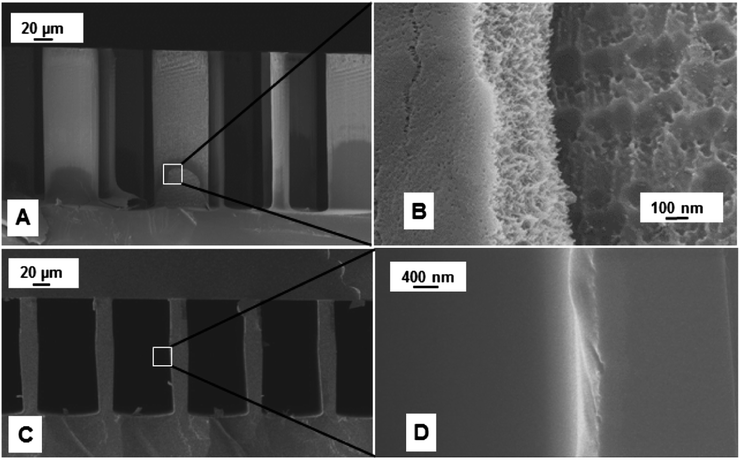 | ||
| Fig. 3 (A and B) SEM images showing Tenax TA coating on the sidewall of micro-posts inside the μTPC chip, and (C and D) polydimethylsiloxane coating on the interior wall of the column channel. | ||
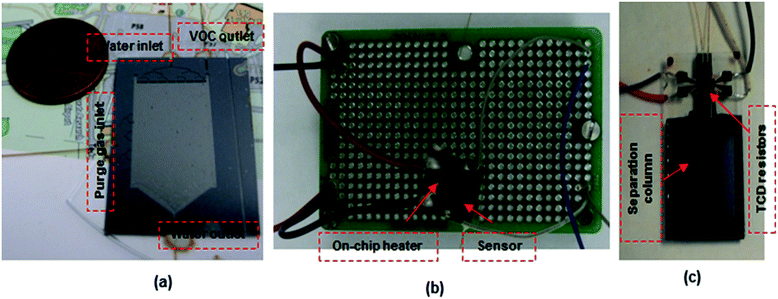 | ||
| Fig. 4 Optical image of fabricated (a) μPE, (b) μTPC and (c) μGC chip with embedded resistors utilized as the thermal conductivity detector for aqueous analysis. | ||
Aqueous sample preparation
To avoid changing the concentration of WOCs, a 24 ml cylindrical vial was filled completely with deionized (DI) water leaving no headspace. Both 1 ppm and 500 ppb solutions (v/v) were prepared in two steps. First, 1000 ppm (v/v) solution was made by adding 24 μl of each WOC to 24 ml of DI water. Second, the solution was further diluted 1![[thin space (1/6-em)]](https://www.rsc.org/images/entities/char_2009.gif) :
:![[thin space (1/6-em)]](https://www.rsc.org/images/entities/char_2009.gif) 24 and 1
24 and 1![[thin space (1/6-em)]](https://www.rsc.org/images/entities/char_2009.gif) :
:![[thin space (1/6-em)]](https://www.rsc.org/images/entities/char_2009.gif) 12 with DI water to achieve concentrations of 1 ppm and 500 ppb, respectively. The solution was analyzed immediately to avoid compromising the sample integrity. Before processing any sample, all parts of the equipment in contact with the sample were demonstrated to be interference free. This was accomplished through a blank run.
12 with DI water to achieve concentrations of 1 ppm and 500 ppb, respectively. The solution was analyzed immediately to avoid compromising the sample integrity. Before processing any sample, all parts of the equipment in contact with the sample were demonstrated to be interference free. This was accomplished through a blank run.
Results and discussion
Before evaluating the performance of the whole integrated purge and trap μGC system, the heating and sensing elements of the microfabricated preconcentrator, separation column, and the detector were calibrated and the separation performance of the column was evaluated.μTPC on-chip heater
A 12 V DC voltage was applied to the heater and the sensor resistance was measured until the resistance representing the desired temperature value was reached. The sensor resistance varied with the applied voltage due to ohmic heating. The final temperature of 150 °C was attained within 7 s representing a ramp rate of 20 °C s−1. This condition remained constant during the desorption process of the WOCs trapped on the Tenax TA polymer coating of the μTPC.μGC column and μTCD performance
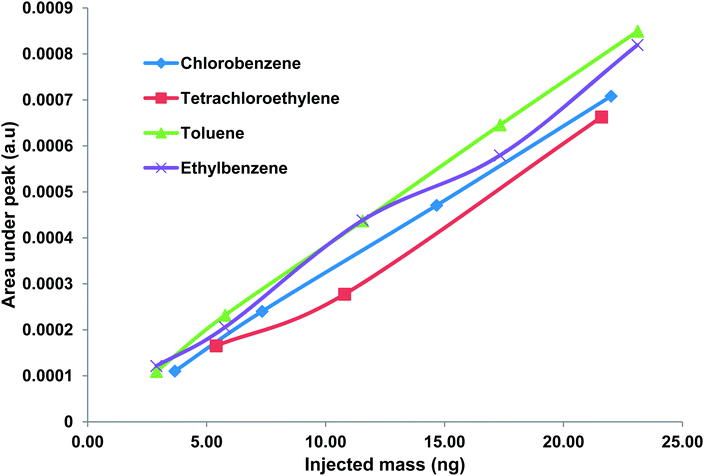
The maximum plate number (optimum condition) observed for the 2 m long column was about 6200 at 12 psi (flow rate 0.62 ml min−1). The column was operating at this optimum flow condition for further investigations.The separation and identification of the four WOCs was performed by the method described previously. FID was used to verify the chromatogram generated by the μTCD. WOCs were successfully separated and detected by the chip within 1.5 min. Next, a calibration curve showing the output of the μTCD as a function of the injected WOC concentration was obtained by the method described previously. The injected mass varied from about 3 ng to 23 ng for toluene, 5.4 ng to 43 ng for PCE, 3.7 ng to 29.3 ng for chlorobenzene and 3 ng to 23 ng for ethylbenzene. A calibration curve showing the average peak area under the μTCD signal obtained for three injections is shown in Fig. 5. It is worth-mentioning that the conventional TCD has a minimum detection limit of 1 ng.33 Results obtained indicate a unique response of the μTCD for each WOC with the relative standard deviation (RSD) less than 10% for all cases. The coefficient of determination (R2) was greater than 0.99 in all cases.
Microsystem evaluation
Following calibration and performance evaluation of each μGC unit, the μPE was put in place. The ability of the complete system comprising μPE and μTPC chips, separation column, and the thermal conductivity gas detector (μTCD) to continuously monitor WOCs in the aqueous sample was realized experimentally by the method explained earlier. The aqueous solution was introduced into the μPE chip using purified nitrogen at 10 psi. High purity nitrogen gas was supplied through the air inlet of the μPE chip trapping WOCs on the adsorbent surface with a flow rate maintained at 0.4 ml min−1 (5 psi) through the μTPC chip. The extraction period was varied for three discrete periods of 7, 14 and 21 min. The set of chromatograms in Fig. 6 was generated using 500 ppb and 1 ppm aqueous samples for two different extraction periods. The initial negative dip is due to the sample mixture passing under the reference detector. At this stage, the signal detector experiences the carrier gas and hence is constant. This results in a negative voltage output as explained before.19 As the sample mixture moves through the column, it is separated over time. When the individual components pass under the sample detector, the reference detector experiences the carrier gas and hence results in positive peaks corresponding to each eluted compound. The second peak is due to trace moisture extracted from the purge chip and is not seen on the FID signal which is insensitive to the trace water content. The increase in peak heights for all WOCs with the increase in extraction time was observed which clearly indicated the validation of the proposed approach. It is also evident that rapid chromatographic separation and detection of all four WOCs within 1.5 min is achieved at room temperature. The method precision was evaluated by three repetitive analyses for each test. After each analysis, the μTCP was heated to 150 °C (conditioning step) to prevent carry-over from the previous runs, following which a blank run was performed to confirm the same. The change in the detector response (area under the peak) with the purge time was then monitored for a sample containing four WOCs at 1 ppm concentration. The experiment was repeated thrice for three different purging times and the average value was plotted for each WOC. Fig. 7 shows that the peak area increases with purging time. The increase in the peak area was attributed to the increase in the quantity of nitrogen (inert gas used) that bubbled through the aqueous sample, and consequently, more quantity of WOC moved from the liquid to the vapor phase. Additionally, in streaming mode more fresh sample entered the μPE chip replacing the old one, thereby increasing the amount of WOC purged over time. The results in Fig. 7 indicate that ethylbenzene and chlorobenzene are purged easily from the aqueous sample as compared to PCE and toluene. This is due to their relatively high partition coefficient (Kow) value which is defined as the ratio of concentration of a compound in a hydrophobic solvent (usually octanol) to its concentration in water at equilibrium. In other words, it is a measure of hydrophobicity and depends on size, polarity and hydrogen bond strength of a compound. Hydrophilic compounds (with low partition coefficient) are held by a very strong dipole–dipole interaction and hydrogen bond in water and thus could not be easily purged from the sample. Increasing the temperature of the sample should increase the purged amount by supplying enough thermal energy to the molecule to break the dipole–dipole interaction.34 The sample analyzed during the purge time was collected to determine the percent recovery of each compound. Assuming that the trap is able to capture the entire purged amount, percent recovery is defined as the ratio of the amount that is collected for chromatographic analysis relative to the amount that was originally present in the aqueous sample. Table 1 summarizes the percent recovery for each compound at 1 ppm concentration. The percent recoveries are lower than those reported in the literature.35,36 This can be attributed to the fact that commercial purge and trap systems use high purging gas flow rates (normally 40 ml min−1) and also use traps consisting of a short length micro-bore tubing packed with the granular form of the adsorbent material. Such traps at the cost of high pressure drops and high power consumptions can provide higher adsorption capacity. It is notable that low recoveries have also been reported previously by Sandia National Laboratories in their bench-top (WASP) system described earlier due to the flow limitations in their setup.37 In addition, we have achieved the detection limit of 500 ppb which is comparatively higher than the commercial purge and trap systems. Part of this is attributed to small sample volumes (in μl) analyzed by the μPE chip when compared to the commercial purge and trap systems. Efforts are underway to improve the extraction efficiency and bring it up to par with the commercial systems. Nevertheless, the purpose of this article is to integrate all μGC components to automate the sampling of water and extract and identify WOCs in real world situations. Modification in design parameters and thermal manipulation for optimization of μPE chip performance will be described in a separate report.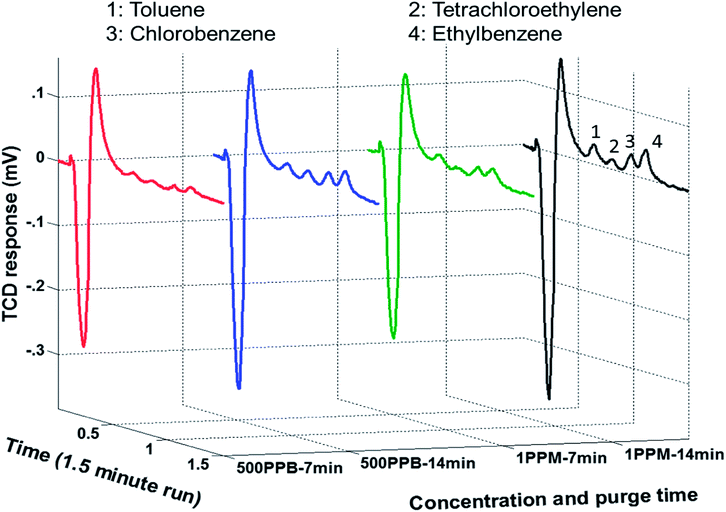 | ||
| Fig. 6 Set of chromatogram indicating increase in μTCD response with increase in purge time and concentration of WOCs. | ||
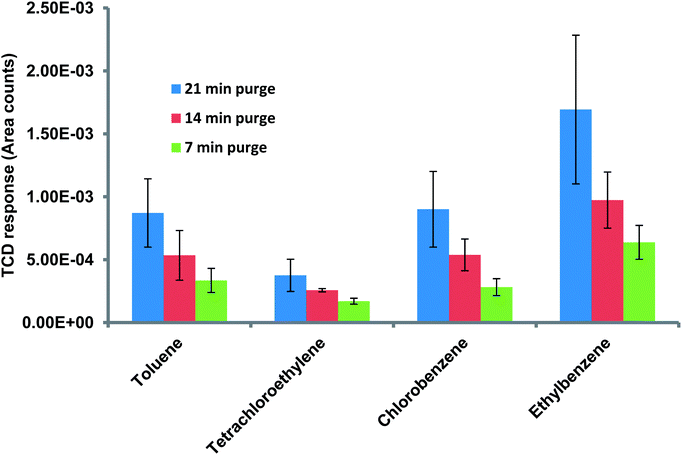 | ||
| Fig. 7 Graph showing the μTCD response variation with increasing purge time for a sample containing four WOCs at 1 ppm concentration. | ||
Conclusions
The first micro-scale version of a purging device for the extraction of WOCs from an aqueous sample has been described. The potential application of the chip for on-site monitoring of the aqueous sample when equipped with all necessary μGC components has also been discussed. We have first characterized the performance of the μGC column with the μTCD turned ON and explored the optimum conditions for the μGC column. Next, we have obtained a calibration curve indicating the change in μTCD response to different amounts of individual WOCs (in the absence of the μPE and μTPC). We have shown that fixed volume samples of water spiked with known concentrations of the WOCs can be extracted using the μPE chip and subsequently trapped on the μTPC. We have finally determined the percentage recovery of each compound thereby successfully demonstrating the ability of the complete system in analyzing WOCs in an aqueous sample.We expect to enhance the recovery of analytes by modifying the design of the μPE chip and integrating temperature programming ability on this chip. In future work, in addition to the overall chip size, the design parameters including the location of the inlets and outlets, the configuration of the fluidic ports (distributed versus single) and their widths, and the inclusion of pillars and their associated shapes and arrangements will be thoroughly studied to improve the recovery of WOCs. Other parameters including the mode of operation (streaming solution versus steady solution), flow rate of the sample to purging gas in streaming mode and temperature manipulation for purging high boiling point organic compounds (semi-VOCs) as external controllable parameters on recovery of WOCs will also be considered.
Acknowledgements
This research has been supported by the National Science Foundation (NSF) under CAREER Award no. ECCS-0747600 and NIOSH Grant 5R21OH010330. All the FESEM images were taken at Virginia Tech Institute for Critical and Applied Science, Nano Scale Characterization and Fabrication Laboratory (ICTAS-NCFL). Fabrication of the devices was performed at Virginia Tech Microfabrication Cleanroom Facilities.Notes and references
- U. E. Oswer, Draft Guidance for Evaluating the Vapor Intrusion to Indoor Air Pathway from Groundwater and Soils (Subsurface Vapor Intrusion Guidance), US Environmental Protection Agency, 2002 Search PubMed.
- K. S. Betts, Environ. Health Perspect., 2010, 118, A173 CrossRef PubMed.
- P. Burkhardt-Holm, T. Wahli and W. Meier, Ecotoxicol. Environ. Saf., 2000, 46, 34–40 CrossRef CAS PubMed.
- P. A. Jones, V. A. Baker, A. J. E. Irwin and L. K. Earl, Toxicol. in Vitro, 1998, 12, 373–382 CrossRef CAS.
- T. Nishihara, J. Nishikawa, T. Kanayama, F. Dakeyama, K. Saito, M. Imagawa, S. Takatori, Y. Kitagawa, S. Hori and U. Hideo, J. Health Sci., 2000, 46, 282–298 CrossRef CAS.
- D. Pobel, E. Riboli, J. Cornée, H. Bertrand and M. Guyader, Eur. J. Epidemiol., 1995, 11, 67–73 CrossRef CAS.
- S. R. Corporation and C. Associates, Toxicological Profile for N-nitrosodimethylamine, 1989, p. 755 Search PubMed.
- H. Ishibashi, M. Hirano, N. Matsumura, N. Watanabe, Y. Takao and K. Arizono, Chemosphere, 2006, 65, 1019–1026 CrossRef CAS PubMed.
- M. F. Kirby, A. J. Smith, J. Rooke, P. Neall, A. P. Scott and I. Katsiadaki, Aquat. Toxicol., 2007, 81, 233–244 CrossRef CAS PubMed.
- F. Lahnsteiner, B. Berger, F. Grubinger and T. Weismann, Aquat. Toxicol., 2005, 71, 297–306 CrossRef CAS PubMed.
- B. Alfeeli, V. Jain, R. K. Johnson, F. L. Beyer, J. R. Heflin and M. Agah, Microchem. J., 2011, 98, 240–245 CrossRef CAS PubMed.
- J. J. Johnston, D. A. Goldade, D. J. Kohler and J. L. Cummings, Environ. Sci. Technol., 2000, 34, 1856–1861 CrossRef CAS.
- C.-J. Lu, W. H. Steinecker, W.-C. Tian, M. C. Oborny, J. M. Nichols, M. Agah, J. A. Potkay, H. K. L. Chan, J. Driscoll, R. D. Sacks, K. D. Wise, S. W. Pang and E. T. Zellers, Lab Chip, 2005, 5, 1123–1131 RSC.
- W. R. Collin, G. Serrano, L. K. Wright, H. Chang, N. Nuñovero and E. T. Zellers, Anal. Chem., 2013, 86, 655–663 CrossRef PubMed.
- J. H. Seo, J. Liu, X. Fan and K. Kurabayashi, Lab Chip, 2013, 13, 851–859 RSC.
- M. Akbar and M. Agah, J. Microelectromech. Syst., 2013, 22, 443–451 CrossRef CAS.
- M. Akbar, D. Wang, R. Goodman, A. Hoover, G. Rice, J. R. Heflin and M. Agah, J. Chromatogr. A, 2013, 1322, 1–7 CrossRef CAS PubMed.
- M. Akbar, D. Wang, H. Shakeel, J. R. Heflin and M. Agah, The 17th International Conference on Solid-State Sensors, Actuators and Microsystems: Transducers & Eurosensors XXVII, 2013 Search PubMed.
- S. Narayanan, B. Alfeeli and M. Agah, IEEE Sens. J., 2012, 12, 1893–1900 CrossRef.
- H. Shakeel and M. Agah, J. Microelectromech. Syst., 2013, 22, 62–70 CrossRef CAS.
- D. Wang, H. Shakeel, J. Lovette, G. W. Rice, J. R. Heflin and M. Agah, Anal. Chem., 2013, 85, 8135–8141 CrossRef CAS PubMed.
- T. Sukaew, H. Chang, G. Serrano and E. T. Zellers, Analyst, 2011, 136, 1664–1674 RSC.
- S. K. Kim, H. Chang and E. T. Zellers, Anal. Chem., 2011, 83, 7198–7206 CrossRef CAS PubMed.
- J. H. Seo, S. K. Kim, E. T. Zellers and K. Kurabayashi, Lab Chip, 2012, 12, 717–724 RSC.
- J. H. Seo, J. Liu, X. Fan and K. Kurabayashi, Anal. Chem., 2012, 84, 6336–6340 CrossRef CAS PubMed.
- E. R. Kuhn, LCGC North Am., 2002, 20, 474–478 CAS.
- K. Grob and A. Habich, J. High Resolut. Chromatogr., 1983, 6, 11–15 CAS.
- U. R. Bernier, C. L. Bray and R. A. Yost, J. Microcolumn Sep., 2000, 12, 226–235 CrossRef CAS.
- B. Alfeeli and M. Agah, 14th International Conference on Miniaturized Systems for Chemistry and Life Sciences, 2010, 1721–1723 Search PubMed.
- M. Akbar and M. Agah, IEEE Sensors, 2012, 915–918 Search PubMed.
- M. Careri, G. Mori, M. Musci and P. Viaroli, J. Chromatogr. A, 1999, 848, 327–335 CrossRef CAS.
- S. Narayanan and M. Agah, J. Microelectromech. Syst., 2013, 22, 1166–1173 CrossRef.
- H. M. McNair and J. M. Miller, Basic gas chromatography, John Wiley & Sons, 2011 Search PubMed.
- C.-W. Lee and C. P. Weisel, J. Anal. Toxicol., 1998, 22, 1–5 CrossRef CAS.
- E. Martínez, S. l. Lacorte, I. Llobet, P. Viana and D. Barceló, J. Chromatogr. A, 2002, 959, 181–190 CrossRef.
- J. M. Warner and R. K. Beasley, Anal. Chem., 1984, 56, 1953–1956 CrossRef CAS.
- A. N. Irwin, C. D. Mowry and T. T. Borek III, Research into the variables affecting purge and trap collection for a portable field trihalomethane testing unit, 2006, 1–32 Search PubMed.
Footnote |
| † Electronic supplementary information (ESI) available. See DOI: 10.1039/c4an00254g |
| This journal is © The Royal Society of Chemistry 2014 |

