 Open Access Article
Creative Commons Attribution 3.0 Unported Licence
Single cell growth rate and morphological dynamics revealing an “opportunistic” persistence†
Bing
Li
a,
Yong
Qiu
*a,
Andrew
Glidle
b,
Jon
Cooper
b,
HanChang
Shi
a and
HuaBing
Yin
*b
aEnvironmental Simulation and Pollution Control State-key Joint Laboratory, School of Environment, Tsinghua University, Beijing 100084, China. E-mail: qiuyong@tsinghua.edu.cn
bDivision of Biomedical Engineering, School of Engineering, University of Glasgow, Glasgow G12 8LT, UK. E-mail: huabing.yin@glasgow.ac.uk
First published on 2nd April 2014
Abstract
Bacteria persistence is a well-known phenomenon, where a small fraction of cells in an isogenic population are able to survive high doses of antibiotic treatment. Since the persistence is often associated with single cell behaviour, the ability to study the dynamic response of individual cells to antibiotics is critical. In this work, we developed a gradient microfluidic system that enables long-term tracking of single cell morphology under a wide range of inhibitor concentrations. From time-lapse images, we calculated bacterial growth rates based on the variations in cell mass and in cell number. Using E. coli and Comamonas denitrificans to amoxicillin inhibition as model systems, we found the IC50 determined via both methods are in a good agreement. Importantly, the growth rates together with morphological dynamics of individual cells has led to the discovery of a new form of persistence to amoxicillin. Normal cells that are sensitive to amoxicillin gain persistence or recover from the killing process, if they have had an opportunity to utilise the cytoplasm released from lysed cells close-by. We term this acquired persistence in normal growing cells “opportunistic persistence”. This finding might shed new insights into biofilm resistance and the effect of antibiotics on environmental microbes.
Introduction
Bacterial persistence has been well known since 1940s when it was found that high doses of antibiotics were unable to kill all the cells in an isogenic population – a small fraction of cells “persist”.1 When recultured, these persister bacteria regrew to form a similarly isogenic population that likewise could not be completely killed. In recent years, this situation has been compounded by the intensive use of antibiotics which has led to widespread bacterial resistance. This is becoming a serious threat to public heath.2–4 Furthermore, the rapid accumulation of antibiotics in the environment is now imposing dramatically increased stress on nature's microbes.Currently, conventional bacterial growth inhibition tests are commonly used as a standard measure of the adverse effects of antibiotics. Two widely used methods include optical density (OD) measurement5–7 and plate dilution methods.8 The former is an indirect measure of cell density, based on the assumption that cell dry mass is proportional to light absorbance, whereas the latter counts the viability of cells. Both methods quantify the antibiotic potency as the half maximal inhibitory concentration (IC50)9 or minimum inhibitory concentration (MIC).10 However, discrepancies in growth parameters derived from two methods exist and are dependent on bacteria species and culture conditions.11–13 Furthermore, both methods are end-point measurements, and involve manual operation. This significantly limits their use for investigating heterogeneous responses to antibiotic stress,14 especially in respect of subpopulations, such as persister cells, whose formation changes in a fluctuating environment.15
Microfluidics has become an attractive tool for single cell analysis.16–20 Trapping bacterial cells on chip using geometrical barriers15,20,21 or with agarose gel22 has been demonstrated, allowing time-lapse observations of single cells. Through in situ tracking of growth rates of individual cells, persister cells were identified from normal growing cells.15 The powerful capability of microfluidics in controlling microflows have been explored in many cases, including the creation of a single cell chemostat,23 programmable delivery of culture medium,15 and the generation of concentration gradients for various investigations.24–26
Recently, we have developed a simple, gradient microfluidic system for rapid bacterial growth inhibition testing.27 It employs the assembly of a polydimethylsiloxane (PDMS) chip and a thin agarose membrane to establish steady concentration gradients of inhibitors over a monolayer of bacteria. The system enables long-term tracking of morphological dynamics of individual bacteria under a wide range of inhibitor concentrations.
In this report we first illustrate this method using a model system with Escherichia coli (E. coli) and amoxicillin. We calculated bacterial growth rates based on the variations in cell mass and in cell number, and evaluated their effectiveness for assessing antibiotic inhibition potency. The growth rates, together with morphological dynamics of individual cells, were used to quantitatively evaluate individual responses to the stress. This led to the discovery of a new form of persistence in the amoxicillin killing process. Interestingly, the behaviour was also found in a naturally occurring bacteria Comamonas denitrificans – an environmental denitrifying bacterium.
Materials and methods
Microfluidic chip for single-layer cell culture
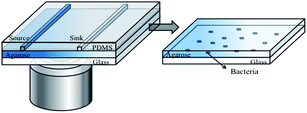
The microfluidic device developed in this study is shown in Fig. 1. It contains an assembly of a coverslip glass, a thin agarose gel membrane and a PDMS chip (Fig. 1). A monolayer of bacteria were trapped and grew between the agarose membrane and the coverslip. The PDMS chip was made by replica moulding as follows. Briefly, a mixture of PDMS oligomer and curing agent (Sylgard 184, Dow Corning) in a ratio of 10![[thin space (1/6-em)]](https://www.rsc.org/images/entities/char_2009.gif) :
:![[thin space (1/6-em)]](https://www.rsc.org/images/entities/char_2009.gif) 1 was cast against a master to give a chip thickness of ∼5 mm. This was cured at 70 °C overnight. The chip consists of two parallel channels at a distance of 1 mm apart. The length, width and depth dimensions of each channel are 13 mm × 500 μm × 500 μm.
1 was cast against a master to give a chip thickness of ∼5 mm. This was cured at 70 °C overnight. The chip consists of two parallel channels at a distance of 1 mm apart. The length, width and depth dimensions of each channel are 13 mm × 500 μm × 500 μm.
The thin agarose gel membrane was made from a 2% agarose solution (Sigma-Aldrich) in deionised water. The solution was autoclaved and stored at 4 °C prior to use. The sterilised agarose gel solution was melted and cast between two clean coverslips separated by a 250 μm thick PDMS spacer. Within 20 minutes at room temperature, the membrane formed. After removal of the top coverslip and the PDMS spacer, the formed membrane was slid onto the channel side of an upturned PDMS chip. All the components were sterilised prior to use.
To form the monolayer of bacteria, 3 μL of a bacterial suspension (OD600 in the range of 0.05–0.08) was dispensed onto the centre of the agarose gel membrane, and immediately covered with a coverslip. This led to a monolayer of bacteria being trapped between the gel membrane and a coverslip substrate (Fig. 1, enlarged view). The whole assembly was clamped in a plastic holder made in house. The operation was performed in a biological safety hood.
Bacterial strains and chemicals
E. coli (ATCC 25922, ATCC, USA) was used as the model bacteria because of the abundance of reference information available. Prior to inhibition experiments, E. coli were cultured in Luria–Bertani (LB) broth in a shaker at 150 rpm at 37 °C. When the optical density of a bacterial suspension at 600 nm (OD600) reached about 0.6–0.8, indicating the exponential growth stage, bacteria were harvested by centrifugation at 5000 rpm for 1 min, washed three times with phosphate buffer saline (PBS) and re-suspended in fresh LB broth. The bacterial suspension was diluted to reach an OD600 value of about ∼0.08 for inhibition tests on the microfluidic device.Comamonas denitrificans (ATCC 700936, ATCC, USA) is a denitrifying bacterium isolated from activated sludge known for its unique properties of reducing nitrate to nitrogen gas both in aerobic and anaerobic conditions.16 It can be used in a toxicity assay of wastewater. Prior to inhibition experiments, bacteria were cultured in nutrient broth in a shaker at 150 rpm under 30 °C. The following procedures are same as E. coli for the tests on the microfluidic device.
Amoxicillin (MW = 419.46 Da, Sigma-Aldrich) was prepared as a 2.0 g L−1 stock solution in deionised water and then diluted in LB broth or nutrient broth to the required concentration.
On-chip bacterial growth inhibition tests
On chip inhibition tests were conducted by delivering “source” and “sink” solutions through the two parallel channels in the chip (Fig. 1). The solutions were continuously delivered into the chip at a speed of 5 μL min−1 (i.e. linear velocity of 0.33 mm s−1 within the source and sink channels) by a syringe pump (NE-4000, New Era Pump Systems Inc.). The continuous flow culture provided constant nutrient supply and removal of metabolic waste. A solution of 5 mg L−1 amoxicillin in the appropriate broth for each bacteria was used as the “source” and a blank broth as the “sink”. All experiments were performed at room temperature (∼22 °C), in line with a commonly found habitat temperature for bacteria in the environment. At least three replicate experiments were conducted for each of the conditions reported below.Image and data processing
Time-lapse image acquisition was carried out using an inverted fluorescence microscope (Zeiss AxioObserver Z1) equipped with an automated stage and a 40× objective lens. Images were captured using a CCD camera (Photometrics Cascade II). Bright field images of the monolayer of bacteria were taken during the inhibition tests on chip. Large areas of the device (e.g. 1.5 mm × 1.5 mm) were imaged by tiling. A Matlab program was applied to stitch tiled pictures together to cover the whole area between the two channels. All the images were processed with ImageJ. Auto-contrast was applied to bright field images, which gave rise to clearly defined cell edges. For calculating cell areas, bright field images were first background subtracted and then converted into binary (black and white) images. Finally, the areas of each colony were calculated using the ‘analyzing particle’ function in ImageJ with a circularity parameter of 0–1 and particle size from 0–infinity, with the answers being given in terms of the number of pixels. Cell numbers within the colonies were counted manually.Calculation of bacterial growth rates
Bacterial growth rate is defined as the increment ratio of a population, which can be measured by the increment in cell mass or in viable cell number. Since bacteria grow as a non-confluent monolayer on chip, cell mass in a colony can be considered to be directly proportional to the colony's area.28 Therefore, in the exponential increment phase of the bacteria, the growth rates of the bacteria from cell mass can be determined by eqn (1).29ln![[thin space (1/6-em)]](https://www.rsc.org/images/entities/char_2009.gif) RM = ln(S/S0) = μM(t − tM) RM = ln(S/S0) = μM(t − tM) | (1) |
The growth rates from the exponential increment in cell number (RN) can be calculated by eqn (2), which is independent of cell morphological variations.
ln![[thin space (1/6-em)]](https://www.rsc.org/images/entities/char_2009.gif) RN = ln(N/N0) = μN(t − tN) RN = ln(N/N0) = μN(t − tN) | (2) |
Evaluation of inhibition response and IC50
Inhibition rates were commonly used to characterize the inhibitory response for different levels of exposure to an inhibitor, and were determined by the reduced specific growth in comparison to a control (eqn (3)).30| IR = (μ0 − μC)/μ0 | (3) |
| IR = a/[1 + (C/C0)b] | (4) |
Results and discussion
Growth rates from cell number and cell mass without antibiotic inhibition
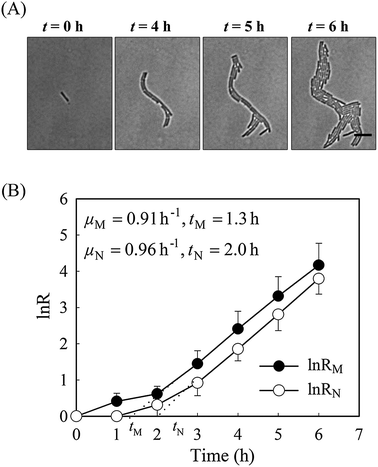
It is well known that bacteria can change their morphology under environmental stress,14 thus we evaluated the growth parameters based on both cell mass and on viable cell number in normal growth medium first. Time-lapse images of a monolayer of bacteria trapped between a porous agarose gel membrane and a cover glass were collected for 6 hours. As a consequence of having a single-layer culture, high resolution images could be readily obtained during the course of the culture (Fig. 2). Individual cells within the colony were clearly distinguishable, allowing manual counting of cell number.Without amoxicillin (CAM = 0 mg L−1), no obvious morphological changes occurred during the course of culture. The majority of rod-like shaped cells maintain a constant width (Fig. S1, ESI†), although individual length varies between 3 to 11 μm due to cell division. The specific growth rate from cell mass μM is 0.91 h−1, similar to that from cell number (μN = 0.96 h−1), suggesting that the two methods are comparable for calculating the growth rates. The lag time calculated from cell numbers, tN, is 2.05 h. This is longer than that calculated from cell mass measurements, tM (1.35 h). This discrepancy reflects the influence of cell generation on the two methods of calculating growth rates. During the process of cell generation, cell mass increases continuously whereas cell numbers increase periodically, after cell division.
Quantification of antibiotic inhibition based on cell number and on cell mass
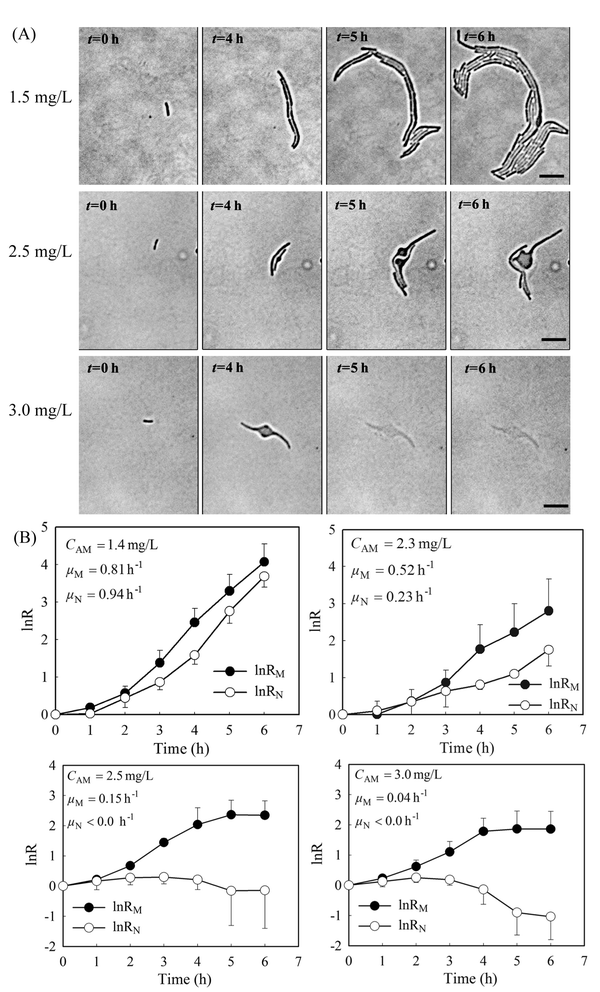
Previously, we showed that a stable gradient of amoxicillin forms 20 minutes after delivery of the “source” (i.e. 5 mg L−1 amoxicillin solution) and the “sink” (a blank medium) solutions to the microfluidic channels in the PDMS chip.27 At a constant flow rate of 0.33 mm s−1, the gradient profile was stable for hours to days (Fig. S2 and Video 1, ESI†), allowing long-term evaluation of antibiotic inhibition on cells. The overall image of the bacterial monolayer between the two channels obtained via tiling provided the spatial distribution of bacteria, and thus enabled quantitative evaluation of amoxicillin's effect for the whole range of concentrations within the gradient.Cell morphology variations were observed under amoxicillin inhibition, showing dependency on both amoxicillin concentrations and time scales. A hierarchical process of elongation (i.e. filamentation), bulging, lysis and dissolution was found during the killing process (Fig. 3A). This phenomenon showed that cell division could be inhibited prior to the inhibition of metabolic activity. Therefore, the numbers of cells did not increase despite the continuous increase in total cell mass within a colony. This led to a discrepancy in calculating the growth rate from cell number μN and that from cell mass μM.
As shown in Fig. 3B, with the increase of amoxicillin concentrations and period of treatment, both growth rates decreased and the deviations between them became increasingly apparent. Since the variations were prominent in the late period of treatment, growth rates between time 4 h and 6 h were given for comparison (Fig. 3B). At a low concentration (e.g. CAM = 1.4 mg L−1), growth rates of μN (0.94 h−1) and μM (0.81 h−1) are still comparable. At higher concentrations (e.g. CAM = 2.3 mg L−1), μN (0.23 h−1) reduced to about 40% value of μM (0.52 h−1). A further increase of amoxicillin concentration led to substantial cell lysis and a rapid reduction in cell generation after 3 hours exposure and consequently a decay stage in the growth curve (i.e. the negative increment region in Fig. 3B, CAM = 2.5 mg L−1). In contrast, the growth curve derived from cell mass (even at CAM = 3.3 mg L−1) does not have such an abrupt transition. This is principally because the time required for a lysed cell to be dissolved leads to a gradual loss in cell mass. This suggests that growth curves from cell number could reflect the inhibitory function of antibiotic more dramatically and rapidly.
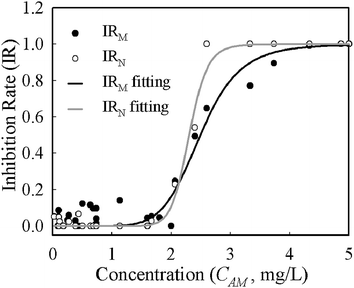
Despite growth rates based on mass and numbers having different absolute values for the same conditions, the deviations were systematic across the whole range of concentrations. The half maximal inhibitory concentration (IC50) is often used to describe the effectiveness of an inhibitor and was derived from the logistic function (eqn (4)) fitting of concentration–inhibition rate curves (Fig. 4). The inhibition curve from cell number (IRN) was slightly sharper than that from cell mass (IRM), implying its higher sensitivity in the characterisation of bacterial response to antibiotic inhibition. The IC50 derived from the IRN and IRM curves are 2.33 mg L−1 and 2.50 mg L−1 respectively. This shows that quantifications of antibiotic inhibition by both methods are in a good agreement.
Single cell growth rates and morphological dynamics revealing a new form of persistence
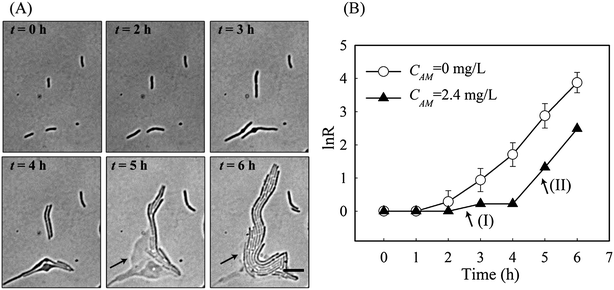
Via tracking single cell morphological variations, it became apparent that individual cells responded differently to the same antibiotic stress. According to the morphology of a cell and its growth rates (i.e. μN and μM), we were able to categorise cell responses to amoxicillin into five states, namely (1) fast, uninhibited normal growth; (2) elongation growth (moderately reduced μN); (3) slow growth (significantly reduced μM and μN), (4) bulge–lysis transition (very low μM and negative μN), and (5) cell dissolution. It was found that the majority of cells adopted states 1 & 2 at concentrations far below IC50 whereas states 4 & 5 prevailed at higher concentrations (CM > 3.3 mg L−1).Interestingly, the five states were concurrently adopted by adjacent cells at concentrations close to IC50. Several representative examples, designated by the numbers in Fig. 5A, were exposed to an amoxicillin concentration of 2.4 mg L−1. Cell-1 & cell-2 underwent the complete sequence in the killing process, as was observed for the majority of cells. Cell-3 shows a significantly reduced growth (i.e. state 3) throughout the 6 h antibiotic treatment, without any obvious morphological variations, indicating that it is a possible persister in the population.15
The most surprising phenomenon occurred with cell-4 where the killing process was stopped and replaced by re-growth. There, as shown in Fig. 5A, cell-4 survived the first 4 h of antibiotic treatment by elongation growth with a slow growth rate (region I in Fig. 5B). However, lysis of the adjacent cells, cell-1 & cell-2, occurred during this time. Since amoxicillin acts by damaging the cell wall, cytoplasm is released into the surrounding area. This appears to be utilised by cell-4 and its colony (arrows in Fig. 5A). Fast re-growth of cell-4's colony was observed after time 5 hours, and had a growth rate equivalent to that without amoxicillin inhibition (region II in Fig. 5B). This phenomenon was observed in several other places at the concentrations close to IC50 (Fig. S3, ESI†).
It should be noted that the observed phenomenon can not be described as the phenotype switch of a type II persister cell into a normal growing cell, since a type II persister cell grows at a rate that is an order of magnitude slower than a non-persister cell.15 Cell-4 grew/divided at a comparable rate to cell-1 & cell-2 during the first 3 h of exposure, and showed its susceptibility to amoxicillin inhibition by filamentation at time 4 h – all indicating it is most likely to be a normal cell and is sensitive to amoxicillin inhibition.
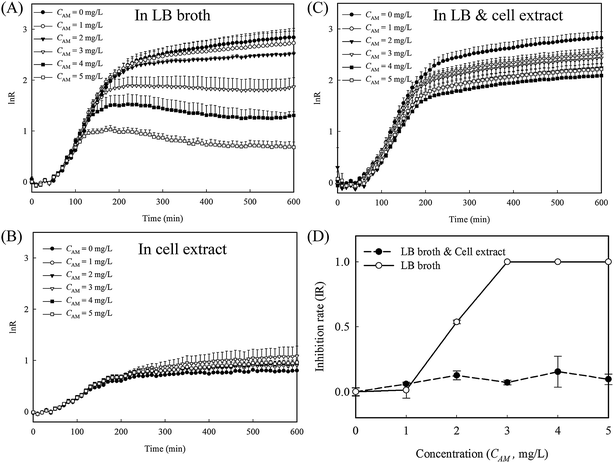
To evaluate whether the released cytoplasm played a role in the fast re-growth of cell-4's colony, inhibition tests with and without cell lysate extract from lysed E. coli were conducted in 96 well plates (protocol detailed in the ESI†). A series of amoxicillin concentrations in three different culture mediums, namely LB broth, cell extract in PBS, and a mixture of LB broth and the cell extract at a ratio of 1![[thin space (1/6-em)]](https://www.rsc.org/images/entities/char_2009.gif) :
:![[thin space (1/6-em)]](https://www.rsc.org/images/entities/char_2009.gif) 1, were used. In LB broth, the reduction in the growth rates is clearly proportional to the amoxicillin concentrations (Fig. 6A and S4A, ESI†). In cell extract, the overall cell growth rate is substantially lower than that in LB medium (Fig. 6B and S4B, ESI†). However, no obvious inhibition was observed for all the amoxicillin concentrations, suggesting the cell extract enhanced cell persistence. In the mixture of cell extract and LB, the growth curves at all the amoxicillin concentrations match well to that in LB only without amoxicillin (Fig. 6C and S4C, ESI†) – a phenomenon that may explain the restored growth rate of cell's 4 colony (region II in Fig. 5B). In contrast to the sigmoidal shaped curve from LB broth, the inhibition rates from LB & cell extract were low and constant across all concentrations (Fig. 6D), demonstrating that cells in these conditions have higher persistence to amoxicillin.
1, were used. In LB broth, the reduction in the growth rates is clearly proportional to the amoxicillin concentrations (Fig. 6A and S4A, ESI†). In cell extract, the overall cell growth rate is substantially lower than that in LB medium (Fig. 6B and S4B, ESI†). However, no obvious inhibition was observed for all the amoxicillin concentrations, suggesting the cell extract enhanced cell persistence. In the mixture of cell extract and LB, the growth curves at all the amoxicillin concentrations match well to that in LB only without amoxicillin (Fig. 6C and S4C, ESI†) – a phenomenon that may explain the restored growth rate of cell's 4 colony (region II in Fig. 5B). In contrast to the sigmoidal shaped curve from LB broth, the inhibition rates from LB & cell extract were low and constant across all concentrations (Fig. 6D), demonstrating that cells in these conditions have higher persistence to amoxicillin.
Taken together, this finding, suggests that bacterial persistence can be gained by normal cells that are sensitive to antibiotics if an opportunity rises. The opportunity is closely linked with the precise response of nearby cells to the antibiotic stress. Clearly, the opportunity of utilising the cytoplasm released from lysed cells close-by seems pivotal. We term this acquired persistence in normal growing cells as an “opportunistic persistence”.
Implication to environmental bacteria
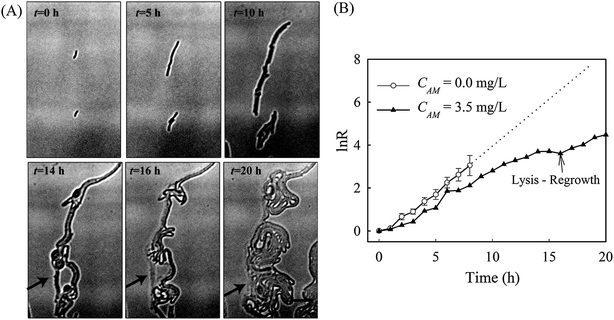
Denitrification is a major process in the global nitrogen cycle. In the last decade, Comamonas denitrificans was identified in various ecosystems and wastewater treatment plants as being a bacteria that plays active roles in the process.32,33 Similar to E. coli, in the absence of amoxicillin inhibition (i.e. CAM = 0 mg L−1), Comamonas denitrificans growth rates μM (0.40 h−1) and μN (0.44 h−1) were comparable. Time lapse tracking the growth of Comamonas denitrificans under an amoxicillin concentration gradient established on chip was carried out for 20 hours. The occurrence of the killing process, i.e. filamentation–bulge–lysis, was observed at different concentrations during the course of treatment (Fig. 7). The concentration–inhibition rate curves from both cell number (rapid, <8 h) and cell mass (∼20 h) were obtained as described above (Fig. S5, ESI†). The derived IC50 from cell number is 3.6 mg L−1 and from cell mass is 3.8 mg L−1.Interestingly, the stimulated re-growth of the inhibited cells was also observed in Comamonas denitrificans at concentrations close to IC50 after 15 h amoxicillin treatment. As shown in Fig. 8A, some cells in the colony (indicated by the arrow) were lysed and dissolved at time 16 h. This was followed by a revival of fast growth of the remaining cells in the colony. As a result, rather than a continuous decline in the growth rate after 16 h, an increase in the growth rate was observed at longer period of antibiotic treatment (e.g. at time 20 h), as shown in Fig. 8B.
It is well known that Comamonas denitrificans tends to deposit polysaccharides and form a biofilm in the environment.34,35 Thus, the inhibition of amoxicillin to Comamonas denitrificans in the environment might depend on the structure of its biofilm. In particular, the bacteria density within the film can be vital since it determines the spatial distance between adjacent cells and the penetration of antibiotics (which may consequently vary in concentration across the film). Antibiotic resistance of biofilms is complicated36 and a detailed discussion is beyond the scope of this work. However, it seems clear that the inhibitory function of bacterial membrane targeting antibiotics, such as amoxicillin, may be compromised by the existence of “opportunistic persistence” in the bacterial community in biofilms.
Conclusions
Growth rates calculated from the increment in cell mass and in cell number are widely used in the microbiological community. Via tracking single cell morphological variations, we have shown that there is negligible difference between the growth rates evaluated from both methods at optimised growth condition. However, deviations are found when substantial morphological variations occur due to antibiotic stresses. These deviations are systematic, and consequently the IC50 values evaluated by both methods are in a good agreement.Enabled by the quantification of the growth rates and morphological dynamics of individual cells, the most surprising finding in this work is that sensitive bacteria can acquire persistence during amoxicillin treatment if an opportunity arises. Such an “opportunistic” persistence is characterised by fast re-growth of inhibited bacteria, which by chance were able to utilise the cytoplasm leaked from lysed cells in a close proximity. As a result, the killing process was stopped, i.e. the inhibition of amoxicillin is compromised. Such phenomenon was observed in both E. coli and an environmental bacteria Comamonas denitrificans.
The discovery highlights the importance of studying the heterogeneity of bacterial populations and their existence as a community in the resistance to antibiotic stresses.
Acknowledgements
We thank the financial support from Environmental Simulation and Pollution Control State-key Joint Laboratory (12L01ESPC), Tsinghua University Initiative Scientific Research Program (no. 20121087922) and from EPSRC (EP/H04986X/1 and EP/J009121/1).References
- J. W. Bigger, Lancet, 1944, 2, 497–500 CrossRef.
- R. Koczura, J. Mokracka, L. Jablonska, E. Gozdecka, M. Kubek and A. Kaznowski, Sci. Total Environ., 2012, 414, 680–685 CrossRef CAS PubMed.
- M. Habash and G. Reid, J. Clin. Pharmacol., 1999, 39, 887–898 CrossRef CAS PubMed.
- D. M. Livermore, Clin. Microbiol. Rev., 1995, 8, 557-584 Search PubMed.
- C. Begot, I. Desnier, J. D. Daudin, J. C. Labadie and A. Lebert, J. Microbiol. Methods, 1996, 25, 225–232 CrossRef.
- D. E. Contois, J. Gen. Microbiol., 1959, 21, 40–50 CrossRef CAS PubMed.
- P. Dalgaard, T. Ross, L. Kamperman, K. Neumeyer and T. A. McMeekin, Int. J. Food Microbiol., 1994, 23, 391–404 CrossRef CAS.
- C. a. L. S. Institute, http://www.clsi.org.
- J. S. Soothill, R. Ward and A. J. Girling, J. Antimicrob. Chemother., 1992, 29, 137–139 CrossRef CAS PubMed.
- J. M. Andrews, J. Antimicrob. Chemother., 2001, 48, 5–16 CrossRef CAS PubMed.
- E. G. Biesta-Peters, M. W. Reij, H. Joosten, L. G. M. Gorris and M. H. Zwietering, Appl. Environ. Microbiol., 2010, 76, 1399–1405 CrossRef CAS PubMed.
- P. Dalgaard and K. Koutsoumanis, J. Microbiol. Methods, 2001, 43, 183–196 CrossRef CAS.
- K. Francois, F. Devlieghere, A. R. Standaert, A. H. Geeraerd, I. Cools, J. F. Van Impe and J. Debevere, J. Appl. Microbiol., 2005, 99, 1503–1515 CrossRef CAS PubMed.
- N. Dhar and J. D. McKinney, Curr. Opin. Microbiol., 2007, 10, 30–38 CrossRef CAS PubMed.
- N. Q. Balaban, J. Merrin, R. Chait, L. Kowalik and S. Leibler, Science, 2004, 305, 1622–1625 CrossRef CAS PubMed.
- H. B. Yin and D. Marshall, Curr. Opin. Biotechnol., 2012, 23, 110–119 CrossRef CAS PubMed.
- H. B. Yin, N. Pattrick, X. L. Zhang, N. Klauke, H. C. Cordingley, S. J. Haswell and J. M. Cooper, Anal. Chem., 2008, 80, 179–185 CrossRef CAS PubMed.
- H. B. Yin, X. L. Zhang, N. Pattrick, N. Klauke, H. C. Cordingley, S. J. Haswell and J. M. Cooper, Anal. Chem., 2007, 79, 7139–7144 CrossRef CAS PubMed.
- M. R. Bennett and J. Hasty, Nat. Rev. Genet., 2009, 10, 628–638 CrossRef CAS PubMed.
- Z. Long, E. Nugent, A. Javer, P. Cicuta, B. Sclavi, M. C. Lagomarsino and K. D. Dorfman, Lab Chip, 2013, 13, 947–954 RSC.
- Y. Wakamoto, J. Ramsden and K. Yasuda, Analyst, 2005, 130, 311–317 RSC.
- J. Choi, Y. G. Jung, J. Kim, S. Kim, Y. Jung, H. Na and S. Kwon, Lab Chip, 2013, 13, 280–287 RSC.
- J. R. Moffitt, J. B. Lee and P. Cluzel, Lab Chip, 2012, 12, 1487–1494 RSC.
- T. Ahmed, T. S. Shimizu and R. Stocker, Nano Lett., 2010, 10, 3379–3385 CrossRef CAS PubMed.
- B. Z. Ji, M. Cusack, A. Freer, P. S. Dobson, N. Gadegaard and H. B. Yin, Integr. Biol., 2010, 2, 528–535 RSC.
- H. B. Yin, B. Z. Ji, P. S. Dobson, K. Mosbahi, A. Glidle, N. Gadegaard, A. Freer, J. M. Cooper and M. Cusack, Anal. Chem., 2009, 81, 473–478 CrossRef CAS PubMed.
- B. Li, Y. Qiu, H. B. Yin, A. Glidle, D. McIlvenna, Q. Luo, J. M. Cooper and H. Shi, Anal. Chem., 2014, 86, 3131–3137 CrossRef CAS PubMed.
- I. Wong, S. Atsumi, W. C. Huang, T. Y. Wu, T. Hanai, M. L. Lam, P. Tang, J. A. Yang, J. C. Liao and C. M. Ho, Lab Chip, 2010, 10, 2710–2719 RSC.
- J. F. Van Impe, F. Poschet, A. H. Geeraerd and K. M. Vereecken, Int. J. Food Microbiol., 2005, 100, 97–105 CrossRef CAS PubMed.
- M. L. Cabo, M. A. Murado, M. P. Gonzalez and L. Pastoriza, J. Appl. Microbiol., 1999, 87, 907–914 CrossRef CAS.
- C. Ritz, Environ. Toxicol. Chem., 2010, 29, 220–229 CrossRef CAS PubMed.
- L. Gumaelius, G. Magnusson, B. Pettersson and G. Dalhammar, Int. J. Syst. Evol. Microbiol., 2001, 51, 999–1006 CrossRef CAS PubMed.
- D. Patureau, E. Zumstein, J. P. Delgenes and R. Moletta, Microb. Ecol., 2000, 39, 145–152 CrossRef CAS PubMed.
- S. Andersson, G. K. Rajarao, C. J. Land and G. Dalhammar, FEMS Microbiol. Lett., 2008, 283, 83–90 CrossRef CAS PubMed.
- S. Andersson, G. Dalhammar, C. J. Land and G. K. Rajarao, Appl. Microbiol. Biotechnol., 2009, 82, 535–543 CrossRef CAS PubMed.
- C. de la Fuente-Nunez, F. Reffuveille, L. Fernandez and R. E. W. Hancock, Curr. Opin. Microbiol., 2013, 16, 580–589 CrossRef CAS PubMed.
Footnote |
| † Electronic supplementary information (ESI) available: Fig. S1: cell width variation without antibiotic treatment. Fig. S2 and Video 1: concentration gradient profiles of fluorescein during the first 8 h. Fig. S3: an example of resurrection of an inhibited E. coli cell at CAM = 2 mg L−1. Fig. S4: the growth curves of E. coli under different inhibition conditions in 96-well plates. Protocols for inhibition experiments with and without cell lysate extract. Fig. S5: concentration–inhibition rate curves for Comamonas denitrificans. See DOI: 10.1039/c4an00170b |
| This journal is © The Royal Society of Chemistry 2014 |

