 Open Access Article
Creative Commons Attribution 3.0 Unported Licence
Magnetic optical sensor particles: a flexible analytical tool for microfluidic devices†
Birgit
Ungerböck
,
Siegfried
Fellinger
,
Philipp
Sulzer
,
Tobias
Abel
and
Torsten
Mayr
*
Applied Sensors, Institute of Analytical Chemistry and Food Chemistry, Graz University of Technology, Stremayrgasse 9/3, 8010 Graz, Austria. E-mail: torsten.mayr@tugraz.at; Fax: +43 (0)316 873 32502; Tel: +43 (0)316 873 32504
First published on 27th February 2014
Abstract
In this study we evaluate magnetic optical sensor particles (MOSePs) with incorporated sensing functionalities regarding their applicability in microfluidic devices. MOSePs can be separated from the surrounding solution to form in situ sensor spots within microfluidic channels, while read-out is accomplished outside the chip. These magnetic sensor spots exhibit benefits of sensor layers (high brightness and convenient usage) combined with the advantages of dispersed sensor particles (ease of integration). The accumulation characteristics of MOSePs with different diameters were investigated as well as the in situ sensor spot stability at varying flow rates. Magnetic sensor spots were stable at flow rates specific to microfluidic applications. Furthermore, MOSePs were optimized regarding fiber optic and imaging read-out systems, and different referencing schemes were critically discussed on the example of oxygen sensors. While the fiber optic sensing system delivered precise and accurate results for measurement in microfluidic channels, limitations due to analyte consumption were found for microscopic oxygen imaging. A compensation strategy is provided, which utilizes simple pre-conditioning by exposure to light. Finally, new application possibilities were addressed, being enabled by the use of MOSePs. They can be used for microscopic oxygen imaging in any chip with optically transparent covers, can serve as flexible sensor spots to monitor enzymatic activity or can be applied to form fixed sensor spots inside microfluidic structures, which would be inaccessible to integration of sensor layers.
Introduction
The integration of luminescent chemical sensors into microfluidic devices is deemed considerably promising due to their features, which are advantageous for their application in microfluidic environments: they are easy to miniaturize, can be highly sensitive, generally do not consume the analyte under investigation and are relatively low-cost devices compared to other sensing technologies.A variety of microfluidic devices with integrated luminescent chemical sensors have already been developed. Commonly, the “off-chip-approach” is used, where microscale sensing materials are combined with macro-scale off-chip detection systems.1 The sensing material usually consists of a luminescent indicator dye immobilized in a polymer or sol–gel matrix, allowing adjustment of sensor performance and minimization of interference with other components of the investigated sample. Due to the flexibility of the matrices, these sensing materials have been integrated into microfluidic environments in different formats such as sensor layers2–8 or sensor beads,9–11 each of these formats exhibiting advantages as well as disadvantages. Microfluidic chips with integrated sensor layers are user friendly and probably the most convenient way to measure an analyte concentration. However, their integration is an additional step for the microfluidic chip processing. Sensor particles exhibit the advantage of simply adding them to the fluid in the microfluidic channels and therefore their use provides a possibility to avoid additional effort of chip development. However, they suffer from disadvantages like low light intensities at low channel depths.
Magnetic optical sensor particles, which have been published by Mistlberger et al.,12 represent a promising strategy to combine the advantages of sensor layers and sensor beads while reducing the disadvantages of each sensor format: on the one hand they can be simply added to the fluid in the microfluidic channels. On the other hand they can be collected inside a microfluidic channel from outside by a magnet, which allows the in situ generation of sensor spots with brightness independent of microfluidic channel depths. They can be combined with oxygen sensing, biosensing and pH sensing functionalities or be used as magnetic photodynamic therapy agents or stimuli-responsive magnetic optical sensors.
The applicability of magnetic chemical sensor particles to microfluidic devices has not been studied yet, although magnetic forces are utilized in various microfluidic applications13 and several reviews have summarized technical approaches of particle trapping14,15 or the application of magnetic particles with biological sensing or catalyzing functionalities16 in microfluidic devices. One important feature for magnetic particle manipulation is the size of the applied particles: on the one hand, they should be as small as necessary to prevent blocking of microfluidic components and interference with microfluidic flow characteristics. On the other hand, adequate accumulation properties, which strongly depend on the particle size, are absolutely essential for generation and stability of in situ sensor spots.
A further important evaluation criterion for the application of MOSePs is the reliability of the measurement method. This study investigates this aspect using the example of oxygen sensors. Although a variety of read-out methods for luminescent oxygen sensors exists, read-out of magnetic sensor particles has to be chosen carefully due to highly varying luminescence intensities between different magnetic sensor spots or even within one generated sensor spot. The measurement of luminescence lifetime τ is the most accurate method to reference for these variations of luminescence intensity. Thus fiber optic read-out is usually performed using lifetime based methods. Imaging applications, however, have been realized applying different measurement methods, mainly for cost reasons. Meier et al. compared different imaging methods including intensity imaging, referenced intensity imaging, luminescence lifetime imaging and ratiometric RGB imaging.17 They stated that lifetime imaging is the most accurate and precise method, while ratiometric imaging using the color channels of a RGB camera represents a less expensive read-out possibility, which is still adequate for certain sensor applications.
The aim of this study is to evaluate the applicability of MOSePs12 to microfluidic devices. Important features like accumulation characteristics and measuring reliability are investigated. Read-out possibilities of MOSePs are discussed critically by the example of oxygen sensors. Furthermore, new application possibilities of luminescent sensors – enabled through the use of MOSePs – are addressed. Interesting applications of magnetic sensor particles include microscopic imaging in any chip with optically transparent covers, parallel monitoring of multiple analytes, flexible sensor spots or their application to form fixed sensor spots inside microfluidic structures, which would be inaccessible to integration of sensor layers.
Materials and methods
Materials
PSMA93 (7% maleic anhydride; Mw = 224![[thin space (1/6-em)]](https://www.rsc.org/images/entities/char_2009.gif) 000 g mol−1) and glucose oxidase from Aspergillus niger (211 U mg−1) were obtained from Sigma Aldrich (http://www.sigmaaldrich.com); L-MNPs (polymer-coated magnetite nanoparticles “EMG1300” from MNP-kit) were purchased from FerroTec GmbH (http://www.ferrotec-europe.de). THF and glucose were obtained from Carl Roth GmbH (http://www.carl-roth.de); platinum(II)-5,10,15,20-tetrakis-(2,3,4,5,6-pentafluorphenyl)-porphyrin (PtTFPP), Macrolex Fluorescent Yellow (MFY) and Lumogen Red F300 (LR) were bought from Frontier Scientific (http://www.frontiersci.com), Simon and Werner GmbH (http://www.simon-und-werner.de) and Kremer Pigmente (kremer-pigmente.de), respectively; the oxygen-sensitive dyes PtTpTBPF18 and Ir(Cs)2(acac)19 were synthesized in our laboratory.
000 g mol−1) and glucose oxidase from Aspergillus niger (211 U mg−1) were obtained from Sigma Aldrich (http://www.sigmaaldrich.com); L-MNPs (polymer-coated magnetite nanoparticles “EMG1300” from MNP-kit) were purchased from FerroTec GmbH (http://www.ferrotec-europe.de). THF and glucose were obtained from Carl Roth GmbH (http://www.carl-roth.de); platinum(II)-5,10,15,20-tetrakis-(2,3,4,5,6-pentafluorphenyl)-porphyrin (PtTFPP), Macrolex Fluorescent Yellow (MFY) and Lumogen Red F300 (LR) were bought from Frontier Scientific (http://www.frontiersci.com), Simon and Werner GmbH (http://www.simon-und-werner.de) and Kremer Pigmente (kremer-pigmente.de), respectively; the oxygen-sensitive dyes PtTpTBPF18 and Ir(Cs)2(acac)19 were synthesized in our laboratory.
For investigation of formation and stability of in situ generated sensor spots, microfluidic chips were custom ordered from ix-factory (ix-factory.de), each exhibiting one powder blasted microfludic channel of 15 mm length and different depths and widths. Thin bottom flowcells from Micronit Microfluidics (http://www.micronit.com) were used for singlet oxygen experiments. Straight channel chips made from PMMA (product code: 01-0174-0138-01) were received from Microfluidic Chip Shop (http://www.microfluidic-chipshop.com).
NdFeB disc/cylinder and block magnets (material grade N38) were purchased from Chen-Yang Technologies (http://www.chenyang.de).
Sensing setup and data evaluation
Sensor signals of fiber optic measurements were read out using a Firesting oxygen meter (Firesting, http://www.pyro-science.com).Microscopic oxygen imaging was performed on a Zeiss Axiovert 25 CFL (http://microscopy.zeiss.com). A blue ultrabright LED with emission maximum at λ = 450 nm (Luxeon lambert emitter, blue, 5 W) was applied as an excitation light source and combined with a filter set-up consisting of Linos DT blue, Linos DC blue and Schott OG 515 (http://www.qioptiq.de; http://www.schott.com) as the excitation filter, dichromatic mirror and barrier filter, respectively. Image read-out was performed using a PCO SensiCam (http://www.pco.de) for rapid lifetime determination (RLD) as described by Moser et al.20 or using an AVT Marlin F-201C color camera (http://www.alliedvisiontec.com) for ratiometric imaging as already published elsewhere.4
Fitting was performed using OriginLab 8.6 (http://www.originlab.com). Original images were processed to oxygen images by Matlab R2008a (http://www.mathworks.com) using the respective calibration data.
Preparation of MOSePs
Synthesis of MOSePs was performed via an optimized nanoprecipitation method described by Mistlberger et al.12 In a typical synthesis, PSMA93 (53.4 mg), L-MNPs (10.7 mg) and dye (0.267 mg) were dissolved or dispersed in THF (5.0 mL). This “cocktail” was then added slowly (approximately 1 mL s−1) to deionized water (10 mL) under vortexing (1200 min−1). Under a stream of air, THF was evaporated from the mixture over a period of 25 min. Aggregates were removed by filtration through a syringe filter (Rotilabo, 0.8 mm). Different particle sizes were obtained by varying the polymer concentration from 0.2–1.2% (w/w) polymer–THF.Generally particle suspensions were diluted 1![[thin space (1/6-em)]](https://www.rsc.org/images/entities/char_2009.gif) :
:![[thin space (1/6-em)]](https://www.rsc.org/images/entities/char_2009.gif) 10 for application in microfluidic devices. Particle sizes were measured with a particle size analyzer Zetasizer Nano ZS.
10 for application in microfluidic devices. Particle sizes were measured with a particle size analyzer Zetasizer Nano ZS.
Sensor characterization
Full calibration of the MOSePs was performed outside the chip by flushing the particle suspension with gaseous air–nitrogen mixtures. For each measurement, they were recalibrated by determining τ0 and τair under deoxygenated and fully air-saturated conditions inside the microfluidic chip. As the calibration function shows slightly nonlinear behavior, the full calibration was then adapted to τ0/τair obtained from the recalibration.Microfluidic measurements
For operation under flow the chips were connected to a programmable syringe pump (TSE systems GmbH, http://www.tse-systems.com).To study the separation of different particle sizes from nanosensor dispersions, a custom ordered microfluidic chip from ix-factory (width: 4000 μm and depth: 300 μm) was filled with aqueous dispersions containing MOSePs with different particle diameters. Light intensities were observed during separation of the particles by a cylindrical magnet from outside the channel.
Separate luminescent spots were generated by using luminescent magnetic nanoparticles stained with Lumogen Red (3% (w/w) dye–polymer) and Macrolex Yellow (3% (w/w) dye–polymer). A microfluidic channel was filled with the first particle suspension, stained with Lumogen Red (LR), and particles were collected from outside by a magnet, which was placed next to the inlet. After removal of not-collected LR particles, a second magnet was placed next to the other inlet. Drops of a second particle dispersion, stained with Macrolex Yellow (MFY), were disposed at the second inlet to avoid accumulation of the MFY particles at the LR spot. Due to diffusion the particle suspension slowly seeped into the channel and MOSePs were collected by the second magnet. This procedure was repeated multiple times until sufficient luminescent intensity of the MFY spot was achieved (∼10 min). Images of the spots were acquired applying the color camera to determine the quality of separation.
Investigations on application of flexible sensor spots to determine the intensity loss during spot movement and to follow the oxidation reaction of β-D-glucose to hydrogen peroxide and δ-D-gluconolactone by molecular oxygen in the presence of glucose oxidase were performed inside a straight channel chip made from PMMA (width: 1000 μm, depth: 200 μm, and cover lid thickness: 175 μm). MOSePs stained with PtTpFPTBP (0.5% (w/w)) were collected to form a magnetic sensor spot inside a microfluidic channel and read-out by using a miniaturized phase fluorimeter. Two syringes containing a 20 g L−1 glucose solution and a 0.05 g L−1 GOX solution were mounted on syringe pumps (TSE systems; model 540060; http://www.tse-systems.com/) and connected to the microfluidic channel with a T-shaped connection piece. During the fluid flow of 60 μL min−1 (30 μL min−1 per syringe), the magnetic sensor spot and the optic fiber were moved along the channel (Fig. 1(E)).
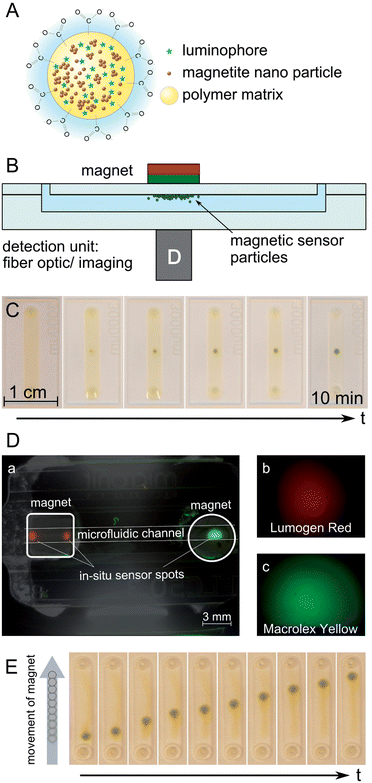 | ||
| Fig. 1 Concept of MOSePs in microfluidic devices. (A) Scheme of a magnetic particle with incorporated luminophores (adapted from Mistlberger et al.12). (B) Schematic cross-section of a chip with separated MOSePs. (C) Time course of particle separation. (D) Formation of multiple nanoparticle spots inside one microfluidic channel. (E) Movement of a magnetic sensor spot along a microfluidic channel. | ||
To integrate fixed sensor spots into a microfluidic channel made from glass, powder blasted microfluidic chips were filled with MOSePs stained with PtTpFPTBP (0.5% (w/w)) mixed with THF (1![[thin space (1/6-em)]](https://www.rsc.org/images/entities/char_2009.gif) :
:![[thin space (1/6-em)]](https://www.rsc.org/images/entities/char_2009.gif) 1). Different magnets were used to collect the swollen polymer particles. After several hours single sensor spots as well as sensor layers were formed. Full calibration of one sensor spot was performed inside the microfluidic chip by flushing it with gaseous air–nitrogen mixtures. For obtaining aqueous measuring curves the chip was flushed with deoxygenated and air-saturated water. Deaerated water was obtained by deoxygenation reaction of glucose (10 mg mL−1) with oxygen in the presence of glucose oxidase (0.05 mg mL−1).
1). Different magnets were used to collect the swollen polymer particles. After several hours single sensor spots as well as sensor layers were formed. Full calibration of one sensor spot was performed inside the microfluidic chip by flushing it with gaseous air–nitrogen mixtures. For obtaining aqueous measuring curves the chip was flushed with deoxygenated and air-saturated water. Deaerated water was obtained by deoxygenation reaction of glucose (10 mg mL−1) with oxygen in the presence of glucose oxidase (0.05 mg mL−1).
Results and discussion
Concept of magnetic sensor particles in microfluidic devices
The use of luminescence sensing methods in combination with magnetic bead manipulation paves the way for an advanced application of luminescence sensors in microfluidic devices. MOSePs can be separated from a magnetic particle dispersion to form in situ sensor spots – including the possibility to generate multiple spots inside one device – or can be transported along a microfluidic channel.The concept of MOSePs in microfluidic devices is presented in Fig. 1. Magnetite nanoparticles and luminescent dye molecules are incorporated into PSMA nanoparticles (Fig. 1(A)). These particles can be collected by a magnet, which is placed above a microfluidic channel, to form a magnetic sensor spot, while sensor signals are read-out from the opposite side of the chip (Fig. 1(B)). This assembly allows fiber optic as well as imaging sensor read-out. Fiber optic assemblies have also been realized with magnetic adapters, which allow read-out and separation from the same side.21 However, for microfluidic applications it turned out to be more convenient to use the two-sided separation/read-out approach because of limited available space.
Fig. 1(C) shows a photo-series of the separation of MOSePs from a homogeneous particle dispersion in water inside a microfluidic channel with a magnet placed underneath the chip. The particles are usually separated from the surrounding solution at a zero fluid flow within 10 min. In situ formed sensor spots exhibited around 10 times higher emission intensities than particle dispersions before separation was induced. After separation the surrounding solution showed no luminescence emission, indicating that a negligible portion of the magnetic particles was lost during this process. The shape of a sensor spot can be adjusted by the choice of the magnet shape reaching from small single sensor spots to sensor lines or covering the whole channel area for imaging applications. Particles are concentrated in regions of high magnet field density. Taking the added volume of the particles, an ellipsoidal shape of the generated spots and sphere packing into account, the height of the spots was calculated to range between 5 and 10 μm. Computational fluid dynamics simulation studies revealed that the formed sensing spots do not cause turbulences (S4†).
MOSePs can also be used to form multiple sensor spots, e.g. for different analytes inside one microfluidic channel. Fig. 1(D) shows the successful generation of separate luminescent spots. Their color values were recorded applying the color camera to determine the quality of separation. These color values indicate very good separation of the two spots. In this way MOSePs can be used to generate magnetic sensor spots, which are sensitive to different analytes or which expand the dynamic range of optical sensors (e.g. pH or temperature sensing particles or particles with higher oxygen sensitivity).
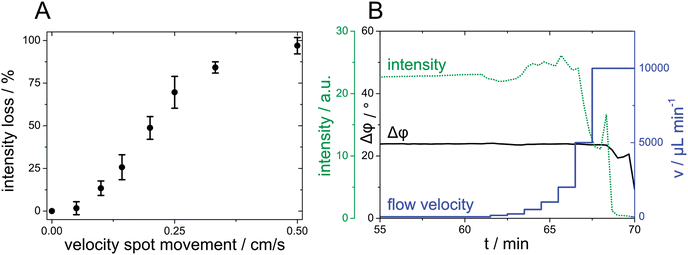
Magnetic sensor spots can be used as flexible sensor spots, because these spots follow the movement of a magnet outside a microfluidic channel after particle separation (Fig. 1(E)). A cylindrical magnet was slowly moved along the channel length at the backside of the microfluidic chip (total duration around 3 s). This allows for example to study the concentration of an analyte along a microfluidic channel. The perpetuation of spot size and of measurable intensity is decreased with increasing velocity of spot movement. Fig. 2(A) presents the relative intensity loss, when a magnetic sensor spot is moved along a 5 cm distance in a microfluidic channel at varying spot movement velocities.
Through providing these interesting features MOSePs enlarge the application possibilities of luminescent sensors: they can be used inside an arbitrary microfluidic chip with optically transparent covers, enable the formation of multiple sensor spots inside microfluidic devices, can be used as a flexible sensor spot inside one microfluidic channel or can be fixed after their integration to any position where information about a certain analyte is needed. Microfluidic applications of MOSePs will be discussed later.
Separation speed and stability of in situ sensor spots
Separation speed and stability of in situ sensor spots inside microfluidic channels play a critical role regarding their applicability in microfluidic devices, because these features determine the time for generating a magnetic sensor spot and influence the maximum flow velocity inside microfluidic channels.Separation speed
Theoretically, separation behavior is governed, inter alia, by the diameter of such a particle due to the directly proportional relationship between the velocity of a magnetic particle and the volume of this particle.To study the separation of different particle sizes from nanosensor dispersions, a microfluidic channel was filled with aqueous dispersions containing MOSePs of different hydrodynamic diameters. Light intensities were observed during separation of the particles by a cylindrical magnet from outside the channel. As expected from theory, the velocity of particles was shown to be proportional to the particle size. Particles with z-av = 159 nm showed higher separation speed than particles with z-av = 110 nm. Exemplary intensity curves illustrating the separation behavior of different particle sizes from a MOSeP dispersion are presented in the ESI (S1†).
This finding reveals that choosing a suitable particle size is an important factor leading to an optimized sensing set-up. On the one hand, adequate accumulation properties are absolutely essential for generation and stability of in situ sensor spots. These properties can be enhanced by increasing the particle diameter. On the other hand, magnetic particles should be as small as necessary to prevent the blocking of microfluidic components and interference with microfluidic flow characteristics. Also for imaging applications it is important to have particles with a size smaller than the resolution of the imaging set-up. For this study MOSePs with z-av = 159 nm were used for further application in microfluidic channels.
Stability of magnetic sensor spots
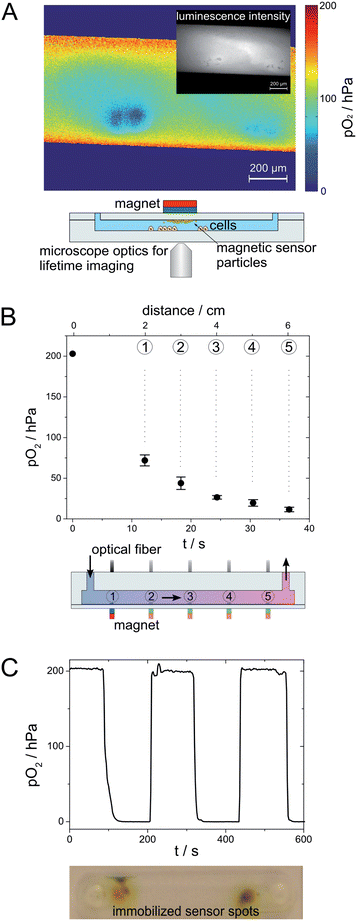
Magnetic sensor spots should be stable at flow rates typically applied in microfluidic applications ranging from v = 6–60 cm min−1.22 Otherwise sensor particles are washed out of the chip during measurements.The in situ formed sensor spots displayed suitable stability during investigation of different fluid velocities. In Fig. 2(B), a fluid flow with increasing flow velocity, starting from 100 μL min−1 (≙5.74 cm min−1), was applied to a microfluidic channel with a magnetic sensor spot. The flow velocity was increased to 2 mL min−1 (≙115 cm min−1) without loss of luminescence intensity – indicating excellent stability of the sensor spot. When the fluid velocity was then further increased to 5 mL min−1 (≙287 cm min−1), a drop of signal intensity was observed, whereas the measured phase shift Δφ was still stable (discussed later in detail). Fluid flows of 10 mL min−1 (≙574 cm min−1) led to complete elution of the in situ-formed sensor spot.
It is important to note that separation and sensor spot stability not only depend on the particle size, but also on the magnetic field strength. These parameters can be influenced by the choice of the magnet and by the thickness of the microfluidic cover lid influencing the distance between the magnet and the formed sensor spot,23 but was not investigated in detail during this study.
Sensor read-out
Several considerations have to be addressed in finding the most suitable sensing set-up for the respective measurement requirement. First, in some cases information about averaged values inside a microfluidic channel and in other cases more detailed information about the spatial distribution of the analyte may be needed. Second, MOSePs have to be adapted to the respective measurement requirement through the choice of the indicator dye. Third, the measurement method has to be chosen carefully, because the use of MOSePs entails a particular challenge due to highly varying luminescence intensities between different magnetic sensor spots or even within one generated sensor spot. Other considerations include a specification concerning accuracy and precision and the prize of the sensor set-up. A variety of measurement methods for luminescent sensors exists: in general, the measurement of luminescence lifetime is the most reliable method to reference for variations of luminescence intensity. However, luminescence lifetime imaging systems are expensive. Alternatively, ratiometric imaging using the color channels of a color CCD-camera is a less expensive, yet less accurate, read-out possibility. To show the flexibility of the presented analytical tool and to discuss different referencing schemes regarding their combination with MOSePs, magnetic particles for fiber optic read-out and imaging applications using different referencing possibilities were prepared and optimized in this study. Stern–Volmer plots and characteristic calibration data for different oxygen sensing systems are presented in the ESI (S2 and S3†).Fiber optic read-out
The fiber optic read-out represents a straightforward method for automatable oxygen sensing without the need for spatial resolution of oxygen values in a microscopic range. A benzo-porphyrin dye (PtTpFPTBP) was chosen for fiber optic read-out, which is known for its high photostability and phosphorescence emission in the NIR spectrum.18 It is compatible with a commercially available read-out system, which is based on lifetime measurement using the frequency domain method. The luminophore is excited by a sinusoidally modulated light source and the phase shift Δφ between excitation and emission, depending on the oxygen concentration, is recorded. The measured phase shift remains stable even if luminescence intensity exhibits high fluctuations as already shown in Fig. 2(B). The spectral characteristics of benzo-porphyrin dyes (absorption of red light and emission in the NIR region) especially fit the needs for biological applications because of the increased penetration depth in high scattering media such as cell cultures and because of reduced background due to lower scattering and autofluorescence.Microfluidic imaging
Highly varying intensities within one sensing spot due to varying numbers of luminescent particles make intensity based imaging insufficient. Thus MOSePs were combined with well-established referencing schemes – rapid lifetime determination (RLD) imaging or ratiometric RGB imaging. While RLD imaging is characterized by its precision and insensitivity to disturbances like light scattering, inhomogeneous illumination and dye bleaching, RGB imaging setups are incomparably cheap and simple, but limited to suppress certain interference.RLD imaging employing the indicator dye (Ir(Cs)2(acac))19 is recommended for short-term application with the need for high emission intensities due to the exceptional brightness but low photostability of Ir(Cs)2(acac). Particles employing PtTFPP and MFY were chosen for long-term RLD or RGB imaging applications, providing an adequate photostability with still high brightness due to the principle of light harvesting.24 The characteristics of this sensor chemistry and the choice of the dye system have already been discussed elsewhere.4
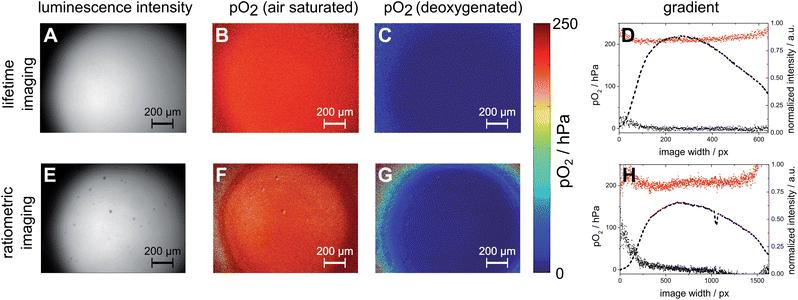
In order to address the reliability of lifetime imaging and ratiometric imaging, a magnetic sensor spot was generated inside a microfluidic channel and investigated using lifetime imaging and ratiometric imaging. Fig. 3 shows the results derived from this investigation. It is important to note that after pre-conditioning the MOSePs as described later, the particles had to be recalibrated for both RLD (lifetime) imaging as well as RGB (ratiometric) imaging by determining τ0 and τair. RLD (lifetime) imaging yielded homogeneous pO2 images for air saturated and deoxygenated images. Only in regions with very low emission intensities stronger deviations from expected results can be observed (Fig. 3(D)). Ratiometric imaging yielded pO2 images with stronger deviations than lifetime imaging over the image area (Fig. 3(H)). However, ratiometric imaging represents a simple and cheap method, which can be used in cases when the differences in oxygen levels are large enough to be determined by this method.
Pre-treatment for microscopic imaging applications
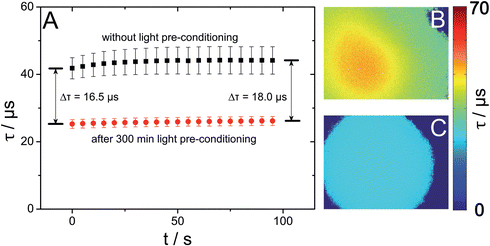
Reduced sample volume and hence a low number of analyte molecules inside a microfluidic channel lead to important aspects for microfluidic sensing devices: as already stated in the Introduction, optical sensors generally do not consume the analyte under investigation. However, highly reactive singlet oxygen is produced during the dynamic quenching process. Subsequent oxidation of sensor matrix components can lead to oxygen consumption severely affecting the oxygen concentration inside microfluidic devices. In our case this effect is further intensified by the high excitation light densities produced by using a fluorescent microscope, leading to an increased production of singlet oxygen.Actually, our investigations on oxygen consumption of a magnetic sensor spot employing the light harvesting system (PtTFPP and MFY) showed that the luminescence lifetime for air saturated DI water was 15 to 20 μs higher than expected from the calibration data recorded outside a microfluidic chip. It further increased during the measurement although no change of oxygen concentration was expected. Moreover, the lifetime images showed higher lifetimes in the middle of one image with decreasing lifetimes towards image areas with lower particle densities (Fig. 4(B)). When compared to particles homogeneously dispersed inside the microfluidic chip, the described effect was further intensified by concentrating the MOSePs to one sensor spot. A possible explanation for this might be that the accumulation of particles leads to an increased local production of singlet oxygen as well as reduced diffusion of oxygen to the inner part of the collected spot.
Enko et al.25 suggested reduced oxygen consumption via deactivation of singlet oxygen by adding physical quenching additives. However, the high volatility and water solubility make additives useless for nanoparticles. To make magnetic particles applicable to microfluidic imaging, they were pre-conditioned by continuous irradiation with a blue LED in order to saturate reactive binding sites of the polymer. As a consequence singlet oxygen can no longer react with these binding sites and returns to its ground state again without being consumed. After 300 min pre-conditioning the same investigation showed stable luminescence lifetime values over time (Fig. 4(A)) and homogeneous lifetime images with invariant values over the whole sensing spot area (Fig. 4(C)). The pre-conditioning also led to a decreased sensing sensitivity of approximately 75% compared to calibration data before pre-conditioning presented in the ESI (S2 and S3†). This means that recalibration after this procedure is necessary.
One general issue, which emerges from these findings, is that microfluidic oxygen measurements should be conducted carefully with regard to these outcomes, especially when MOSePs are applied in microfluidic channels and under extreme conditions with high light intensities on a fluorescence microscope. Whenever possible, excitation time and intensity should be reduced to a necessary minimum value to reduce production of singlet oxygen and to prevent subsequent reaction of singlet oxygen.
Microfluidic measurements and further applications
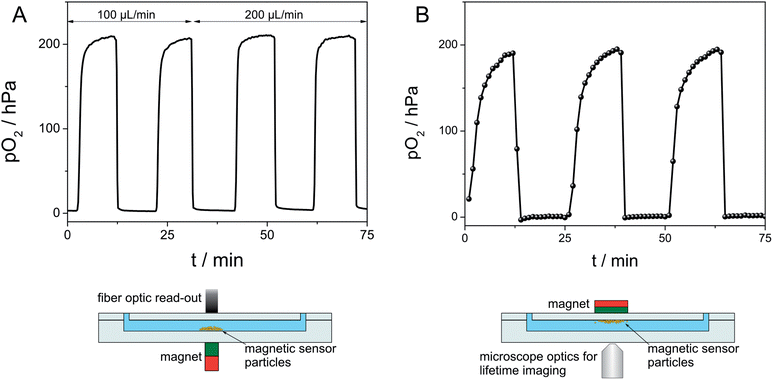
In this context it should be emphasised that the apparent response times in Fig. 5 do not display the actual sensor particle or sensor spot response time. The response time of a particle spot to a rapid change in oxygen concentration was reported by Mistlberger et al.12 to have a t90 of 1.4 s, while they assumed the response of single particles to be much faster. Thus magnetic sensor spots can be considered to respond in real-time.
Fig. 6(B) shows the principle of a flexible sensor spot applied in a microfluidic channel. When the magnet outside a microfluidic channel is moved along the channel length, the magnetic sensor spot follows the movement of the magnet inside the channel from one inlet to the other. The oxidation reaction of β-D-glucose to hydrogen peroxide and δ-D-gluconolactone by molecular oxygen in the presence of glucose oxidase was followed by measuring pO2 along the channel length by applying a flexible sensor spot. A glucose solution and a solution containing glucose oxidase were mixed short before the microfluidic inlet. Fig. 6(B) presents the obtained measured oxygen concentrations at distances d = 2, 3, 4, 5 and 6 cm from the mixing area (≙retention times of 12.2, 18.3, 24.4, 30.5 and 36.6 s).
Fixed sensor spots were integrated into a microfluidic channel made from powder blasted microfluidic glass chips. The addition of THF to a MOSeP suspension (1![[thin space (1/6-em)]](https://www.rsc.org/images/entities/char_2009.gif) :
:![[thin space (1/6-em)]](https://www.rsc.org/images/entities/char_2009.gif) 1) leads to swelling of the particles. These particles are transferred into a microfluidic chip and magnetically separated. The magnetic force acting on soft particle shells leads to particle adhesion to the channel wall. Different magnets were used to form single sensor spots as well as sensor layers, which can then be used without magnetic support.
1) leads to swelling of the particles. These particles are transferred into a microfluidic chip and magnetically separated. The magnetic force acting on soft particle shells leads to particle adhesion to the channel wall. Different magnets were used to form single sensor spots as well as sensor layers, which can then be used without magnetic support.
Fixed sensor spots were shown to behave similar to flexible sensor spots. A measuring curve with air saturated and deoxygenated water was recorded (Fig. 6(C)), exhibiting shorter response times compared to diffusion limited magnetic sensor spots. Furthermore, fixed sensor spots were stable beyond flow velocities of 2000 cm min−1.
Conclusion
Magnetic separation of MOSePs leads to the generation of in situ sensor spots with different shapes. These sensor spots can be moved along microfluidic channels following the position of a magnet outside the channel. An investigation of magnetic sensor spot stability towards different flow velocities showed reliable lifetime measurements up to flow velocities of 5 mL min−1 (≙287 cm min−1). Summing up, the in situ formed sensor spots were shown to be sufficiently stable at flow rates typically applied in microfluidic applications.MOSePs can be easily adapted to the respective measurement requirement. They enable fiber optic as well as imaging read-out by adapting luminescent indicators and referencing schemes to the respective measurement requirement. Fiber optic oxygen measurements as well as oxygen imaging inside microfluidic channels turned out to be straightforward. The measurement of luminescence lifetime was shown to be the most accurate and precise method to reference for these variations, while for imaging applications ratiometric imaging using the color channels of a RGB camera may be the less expensive but still adequate read-out possibility.
However, microscopic oxygen imaging with high excitation light intensities must be performed with caution paid to singlet oxygen production and subsequent reactions, which can lead to underestimated pO2 levels. Nevertheless, microscopic oxygen imaging was also reliably performed after preconditioning of the particle dispersion by irradiation with light.
MOSePs were also demonstrated to serve as useful tools for a variety of new and flexible applications inside microfluidic devices. They can be used for microscopic oxygen imaging applied in microfluidic cell culture, to form multiple separated sensor spots, e.g. for different analytes inside one microfluidic channel, serve as flexible sensor spots to study analyte gradients along a microfluidic channel or can be used to form fixed sensor spots inside microfluidic structures, which would otherwise be inaccessible to integration of sensor layers.
All these findings suggest that in general MOSePs are an interesting tool to be applied in microfluidic environments and can facilitate further integration and new applications of luminescent sensors in this research field.
Acknowledgements
Financial support by the European Union FP7 Project BIOINTENSE – Mastering Bioprocess integration and intensification across scales (Grant Agreement number 312148) is gratefully acknowledged.Notes and references
- B. Kuswandi, J. Nuriman, Huskens and W. Verboom, Anal. Chim. Acta, 2007, 601, 141–155 CrossRef CAS PubMed.
- V. Nock, R. J. Blaikie and T. David, Lab Chip, 2008, 8, 1300–1307 RSC.
- H. Zhu, X. Zhou, F. Su, Y. Tian, S. Ashili, M. R. Holl and D. R. Meldrum, Sens. Actuators, B, 2012, 173, 817–823 CrossRef CAS PubMed.
- B. Ungerböck, V. Charwat, P. Ertl and T. Mayr, Lab Chip, 2013, 13, 1593–1601 RSC.
- L. Gitlin, C. Hoera, R. J. Meier, S. Nagl and D. Belder, Lab Chip, 2013, 13, 4134–4141 CAS.
- S. Jezierski, D. Belder and S. Nagl, Chem. Commun., 2013, 49, 904–906 CAS.
- A. P. Vollmer, R. F. Probstein, R. Gilbert and T. Thorsen, Lab Chip, 2005, 5, 1059–1066 RSC.
- R. H. W. Lam, M.-C. Kim and T. Thorsen, Anal. Chem., 2009, 81, 5918–5924 CrossRef CAS PubMed.
- M. A. Acosta, P. Ymele-Leki, Y. V. Kostov and J. B. Leach, Biomaterials, 2009, 30, 3068–3074 CrossRef CAS PubMed.
- B. Ungerböck, A. Pohar, T. Mayr and I. Plazl, Microfluid. Nanofluid., 2013, 14, 565–574 CrossRef.
- D. Aigner, B. Ungerböck, T. Mayr, R. Saf, I. Klimant and S. M. Borisov, J. Mater. Chem. C, 2013, 1, 5685–5693 CAS.
- G. Mistlberger, K. Koren, E. Scheucher, D. Aigner, S. M. Borisov, A. Zankel, P. Pölt and I. Klimant, Adv. Funct. Mater., 2010, 20, 1842–1851 CrossRef CAS PubMed.
- N. Pamme, Lab Chip, 2006, 6, 24 RSC.
- M. A. M. Gijs, Microfluid. Nanofluid., 2004, 1, 22–40 CAS.
- J. Nilsson, M. Evander, B. Hammarström and T. Laurell, Anal. Chim. Acta, 2009, 649, 141–157 CrossRef CAS PubMed.
- M. A. M. Gijs, F. Lacharme and U. Lehmann, Chem. Rev., 2010, 110, 1518–1563 CrossRef CAS PubMed.
- R. J. Meier, L. H. Fischer, O. S. Wolfbeis and M. Schäferling, Sens. Actuators, B, 2013, 177, 500–506 CAS.
- S. M. Borisov, G. Nuss, W. Haas, R. Saf, M. Schmuck and I. Klimant, J. Photochem. Photobiol., A, 2009, 201, 128–135 CrossRef CAS PubMed.
- S. M. Borisov and I. Klimant, Anal. Chem., 2007, 79, 7501–7509 CAS.
- C. Moser, T. Mayr and I. Klimant, Anal. Chim. Acta, 2006, 558, 102–109 CrossRef CAS PubMed.
- G. Mistlberger, P. Chojnacki and I. Klimant, J. Phys. D: Appl. Phys., 2008, 41, 085003 CrossRef.
- H. A. Stone, A. D. Stroock and A. Ajdari, Annu. Rev. Fluid Mech., 2004, 36, 381–411 CrossRef.
- P. Zhang, S. Park and S. H. Kang, Chem. Commun., 2013, 49, 7298–7300 RSC.
- T. Mayr, S. M. Borisov, T. Abel, B. Enko, K. Waich, G. Mistlberger and I. Klimant, Anal. Chem., 2009, 81, 6541–6545 CrossRef CAS.
- B. Enko, S. M. Borisov, J. Regensburger, W. Bäumler, G. Gescheidt and I. Klimant, J. Phys. Chem. A, 2013, 117, 8873–8882 CrossRef CAS PubMed.
Footnote |
| † Electronic supplementary information (ESI) available. See DOI: 10.1039/c4an00169a |
| This journal is © The Royal Society of Chemistry 2014 |

