Imaging of RNAs in live cells with spectrally diverse small molecule fluorophores†
Tucker J.
Carrocci
and
Aaron A.
Hoskins
*
Department of Biochemistry, University of Wisconsin-Madison, 433 Babcock Dr., Madison, WI 53706, USA. E-mail: ahoskins@wisc.edu; Fax: +1-608-262-3453; Tel: +1-608-890-3101
First published on 28th October 2013
Abstract
We have developed new protein-based tags for use in imaging of RNAs in living cells. These tags are based on the MS2 phage coat protein fused to either E. coli dihydrofolate reductase or the SNAP tag. Labeled RNAs can be visualized with fluorophores spanning the visible spectra range.
Fluorescence light microscopy (e.g., epi-fluorescence, confocal, or STED imaging) is a powerful tool for studying the dynamics and localization of biomolecules in living cells. Proteins are routinely imaged by fusion to fluorescent proteins (FPs).1 On the other hand, RNA imaging in vivo is less straightforward due to the lack of intrinsically fluorescent motifs.2,3
Fusion of the MS2 bacteriophage coat protein to FPs (e.g., MS2-eGFP) has proven useful for studying the cellular dynamics of RNAs encoding MS2 stem loops.2,4,5 Binding of multiple MS2-FPs to the RNA results in a detectable fluorescence signal that is colocalized with the RNA. However, the MS2-FP fluorophores are often constitutively active resulting in high background fluorescence.4,5
Targeting organic fluorophores to RNAs represents a promising alternative strategy for fluorescent labeling. The fluorescence signal can be controlled by the addition of small molecules to the growth media. Furthermore, many organic dyes have higher quantum yields and extinction coefficients than FPs, making them brighter fluorophores.6
To extend the benefits of organic fluorophores to RNA imaging in live cells, we have developed small molecule-based RNA tags by fusion of the MS2 coat protein to either the Escherichia coli dihydrofolate reductase (MS2-eDHFR) or the SNAP tag (MS2-SNAP). We have used these fusions to image RNAs in live Saccharomyces cerevisiae (yeast) cells with a diverse range of fluorophores. The use of MS2-eDHFR or MS2-SNAP fusions significantly expands the repertoire of fluorophores available for imaging RNAs in live cells.
The eDHFR tag tightly binds fluorescent analogs of trimethoprim (TMP)7 while the SNAP tag reacts with fluorescent benzyl guanine (bG) or benzylchloropyrimidine (CP) derivatives to form a covalent adduct to the protein.8,9 Since both the eDHFR and SNAP tags have been used to image proteins in live cells,7,8,10 we reasoned that fusion of these tags to MS2 coat protein should also permit RNA imaging in presence of the respective small molecules.
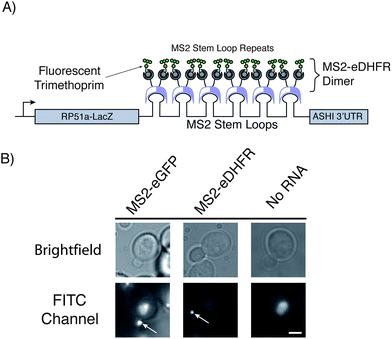
We coexpressed the MS2-eDHFR or MS2-SNAP proteins along with a reporter mRNA in yeast. The reporter mRNA encodes (5′ to 3′) a fusion of the RP51A and lacZ transcripts, 6 copies of the MS2 stem loop, and the 3′ untranslated region of the ASH1 mRNA (Fig. 1A).4 Because the MS2 coat protein binds its target RNA stem loop as a dimer, the reporter mRNA can be bound by up to twelve copies of the MS2 fusion protein. In budding yeast cells, the reporter mRNA localizes to the bud and can be observed as a punctate fluorescent particle using MS2-eGFP (Fig. 1B).4 The observation of a similar fluorescent signal in the presence of the MS2-eDHFR or MS2-SNAP tags and appropriate ligands would be indicative of RNA labeling.
 | ||
| Fig. 1 (A) Illustration depicting the reporter mRNA containing six copies of MS2 protein-binding stem loops. Fluorescent trimethoprim ligands are targeted to the mRNA by fusion of eDHFR to the MS2 protein. Each stem loop can bind one MS2-eDHFR dimer. This illustration represents the maximum possible number of proteins and fluorophores that can be targeted to the RNA. (B) Micrographs of living yeast cells. Visualization of the mRNA (white arrows) can be achieved with both MS2-eGFP as described in ref. 3 or by MS2-eDHFR after incubation with fluorescein-TMP. No particles were observed in the absence of the reporter mRNA after incubation with fluorescein-TMP and expression of MS2-eDHFR (far right). Images in the FITC channel have been adjusted to identical contrast settings. Images are of equal magnification and a scale bar (3 μm) is shown in the lower right image. | ||
In the presence of the reporter RNA and the MS2-eDHFR tag, fluorescent particles were observed at the yeast bud tip after incubation with fluorescein-TMP for 45 min. Fluorescein-TMP particles were observed in 29 ± 3% (±SD) of budding cells whereas 34 ± 5% of budding cells expressing MS2-eGFP showed particles (Table 1). Thus, MS2-eDHFR/fluorescein-TMP appears similarly as efficient in detecting the reporter RNA as MS2-eGFP.
| Expressed Protein | Reporter RNA | Number of budding cells | Number of localized fluorescent particles | % (±SD)a |
|---|---|---|---|---|
| a The error was calculated as the variance for a binomial distribution. b RNA particles were visualized after incubation with fluorescein-TMP. c RNA particles were visualized after incubation with fluorescein-bG. | ||||
| MS2-eGFP | − | 80 | 0 | 0 |
| MS2-eGFP | + | 87 | 30 | 34 ± 5 |
| MS2-eDHFRb | − | 311 | 0 | 0 |
| MS2-eDHFRb | + | 307 | 88 | 29 ± 3 |
| MS2-SNAPc | − | 103 | 0 | 0 |
| MS2-SNAPc | + | 97 | 37 | 38 ± 5 |
Cells lacking the reporter mRNA failed to produce localized particles when treated with fluorescein-TMP (Fig. 1B, Table 1). Consistent with previous observations,4 a small portion (∼10%) of budding cells expressing either MS2-eGFP or MS2-eDHFR was found to possess punctate fluorescence within the mother cell.
RNA particles labeled with fluorescein-TMP were readily detected by visual inspection of the microscopic images. Interestingly, the average integrated particle intensity for MS2-eDHFR labeled RNAs was lower than that for MS2-eGFP particles (1870 vs. 7435 AU, respectively). However, the distribution of MS2-eDHFR particle intensities was much sharper than that observed for MS2-eGFP (Fig. S1†).
It has previously been observed that two MS2 monomers can be fused to create a tandem dimer (tdMS2).11 tdMS2-eGFP fusions can display an increase in mRNA brightness and labeling uniformity when compared with MS2-eGFP in mammalian cells.12 To determine if these observations extended to TMP labeling of RNAs, we expressed a tdMS2-eDHFR fusion protein along with the reporter mRNA in yeast. We predicted that this reporter mRNA would be capable of binding up to six copies of tdMS2-eDHFR (Fig. S2†) potentially resulting in half as many eDHFR molecules localized to each transcript when compared to MS2-eDHFR.
Cells expressing tdMS2-eDHFR also displayed fluorescent particles in the presence of the reporter mRNA and fluorescein-TMP (Fig. S2†). The brightness of the fluorescent particles observed with tdMS2-eDHFR (1593 AU) was near to those observed with MS2-eDHFR and showed a similar distribution (Fig. S2†). However, tdMS2-eDHFR particles potentially have only half the number of fluorescent TMP molecules bound to each transcript. This result may be indicative that TMP dye accumulation in yeast is limiting for the labeling reaction or intermolecular quenching between fluorescein-TMP molecules may be reducing the total fluorescence output. Further analysis of these observations will be required to extend the use of tdMS2-eDHFR fusions for quantitative imaging of RNA abundance.
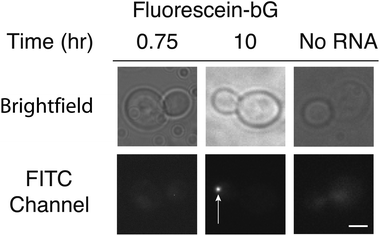
Given the success of RNA labeling with MS2-eDHFR fusions, we next attempted RNA labeling by covalent attachment of fluorescein-bG to MS2-SNAP proteins. Based upon previous studies,13 we treated yeast cells expressing MS2-SNAP with fluorescein-bG for 6–10 h. After this time, we observed fluorescent particles in the bud tip (Fig. 2, Table 1). No particles were observed in the absence of the reporter RNA (Fig. 2, Table 1). Incubation for shorter amounts of time (45 min) did not result in fluorescent particles (Fig. 2). These results indicate that while both MS2-eDHFR and MS2-SNAP can both be used to image RNAs in live yeast, longer incubation times with the small molecule fluorophores are required for MS2-SNAP imaging.
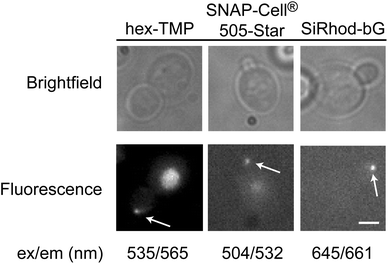
A major advantage of the MS2-eDHFR and MS2-SNAP tags is the ability to spectrally tune the fluorescent signal by switching the derivative of TMP or bG used for labeling. Incubation of cells expressing MS2-eDHFR and the reporter RNA with a red-shifted fluorescein-TMP derivative (hexachlorofluorescein-TMP, hex-TMP) produced fluorescent particles in the bud tip (Fig. 3). Control experiments also showed that some yeast cells exhibited fluorescence in the bud neck in the presence of hex-TMP but absence of the reporter mRNA (data not shown). Despite similar chemical structures, fluorescein-TMP and hex-TMP appear to have unique localization properties in live yeast.
RNAs could also be labeled using the MS2-SNAP tag with red-shifted fluorophores that are structurally distinct from the dihydroxyxanthene/fluorescein scaffold. The rhodamine derivatives Dy505 (SNAP-Cell® 505-Star) and silicon rhodamine (SiRhod)-bG14 both produced fluorescent particles localized to the bud tip in yeast expressing the MS2-SNAP tag and reporter mRNA (Fig. 3). Neither SNAP-Cell® 505-Star nor SiRhod-bG produced particles in the absence of the reporter mRNA (data not shown). SNAP-Cell®505-Star is recognized by MS2-SNAP via a CP ligand rather than bG. This indicates that fluorescent derivatives of both CP and bG can be used to label MS2-SNAP proteins for RNA visualization in living yeast. In sum, our results show that the MS2-eDHFR and MS2-SNAP proteins can be used to fluorescently label RNAs in vivo using a set of ligands that span from blue-green to near-infrared wavelengths.
Small molecule fluorophore labeling with MS2-eDHFR and MS2-SNAP tags offers several practical advantages for visualizing RNAs in vivo. One obvious benefit is that the fluorescent signal is uncoupled from the MS2-eDHFR or MS2-SNAP protein: fluorescence can be controlled in these experiments by addition of a fluorophore. Cellular RNAs are not fluorescent until the fluorophore is added, and unlike fluorescent proteins, no additional cloning or molecular biology steps or personnel hours are necessary to change the wavelength at which the RNA is monitored. As we have demonstrated, RNAs can be visualized at different fluorescence wavelengths simply by incubating the same cells with different small molecules. The microscopic observation wavelength is theoretically only limited by the ability to chemically synthesize cell-permeable small molecule conjugates for intracellular labeling.
The use of red-shifted fluorophores such as SiRhod for RNA imaging is also experimentally advantageous. These fluorophores can be excited with limited interference from cellular components (e.g., flavin) that contribute to background autofluorescence when GFP is imaged (Fig. S3†). In addition, long wavelength excitation may potentially induce fewer phototoxic effects that result from intense and prolonged illumination with photodamaging blue light.15 These attributes will make the MS2-eDHFR and MS2-SNAP proteins valuable additions to the RNA imaging toolkit and will enable future microscopy experiments in RNA transport, localization, and turnover. In particular, we believe that these methods will provide a foundation for multi-color pulse-chase experiments of RNA dynamics during cell growth. Such experiments will prove useful for understanding RNA-based regulation.
Acknowledgements
We would like to thank Rob Singer (Albert Einstein College of Medicine) and Ivan Correa (New England Biolabs) for donating reagents and helpful discussions. We thank the Tom Martin laboratory (U. Wisconsin) for microscope access. We thank Jacquelyn Turri for preliminary work on this project. This work was made possible by startup funds from the University of Wisconsin-Madison, WARF, and the Department of Biochemistry. AAH is funded by a K99/R00 award (GM086471) and the Beckman Young Investigators program. TJC is supported by the NIH Biotechnology Training Program at U. Wisconsin-Madison (5T32GM08349).References
- B. N. G. Giepmans, S. R. Adams, M. H. Ellisman and R. Y. Tsien, Science, 2006, 312, 217–224 CrossRef CAS PubMed.
- S. Tyagi, Nat. Methods, 2009, 6, 331–338 CrossRef CAS PubMed.
- J. S. Paige, K. Y. Wu and S. R. Jaffrey, Science, 2011, 333, 642–646 CrossRef CAS PubMed.
- E. Bertrand, P. Chartrand, M. Schaefer, S. M. Shenoy, R. H. Singer and R. M. Long, Mol. Cell, 1998, 2, 437–445 CrossRef CAS.
- D. R. Larson, D. Zenklusen, B. Wu, J. A. Chao and R. H. Singer, Science, 2011, 332, 475–478 CrossRef CAS PubMed.
- Z. Chen, V. W. Cornish and W. Min, Curr. Opin. Chem. Biol., 2013, 17, 637–643 CrossRef CAS PubMed.
- L. W. Miller, Y. Cai, M. P. Sheetz and V. W. Cornish, Nat. Methods, 2005, 2, 255–257 CrossRef CAS PubMed.
- A. Keppler, S. Gendreizig, T. Gronemeyer, H. Pick, H. Vogel and K. Johnsson, Nat. Biotechnol., 2003, 21, 86–89 CrossRef CAS PubMed.
- X. Sun, A. Zhang, B. Baker, L. Sun, A. Howard, J. Buswell, D. Maurel, A. Masharina, K. Johnsson, C. J. Noren, M.-Q. Xu and I. R. Corrêa Jr, ChemBioChem, 2011, 12, 2217–2226 CrossRef CAS PubMed.
- M. A. McMurray and J. Thorner, Curr. Biol., 2008, 18, 1203–1208 CrossRef CAS PubMed.
- D. S. Peabody, Arch. Biochem. Biophys., 1997, 347, 85–92 CrossRef CAS PubMed.
- B. Wu, J. A. Chao and R. H. Singer, Biophys. J., 2012, 102, 2936–2944 CrossRef CAS PubMed.
- C. Chidley, H. Haruki, M. G. Pedersen, C. Fellay, S. Moser and K. Johnsson, Chimia, 2011, 65, 720–724 CrossRef CAS.
- G. Lukinavičius, K. Umezawa, N. Olivier, A. Honigmann, G. Yang, T. Plass, V. Mueller, L. Reymond, I. R. Corrêa, Z.-G. Luo, C. Schultz, E. A. Lemke, P. Heppenstall, C. Eggeling, S. Manley and K. Johnsson, Nat. Chem., 2013, 5, 132–139 CrossRef PubMed.
- D. R. Rines, D. Thomann, J. F. Dorn, P. Goodwin and P. K. Sorger, in Live Cell Imaging A Laboratory Manual, ed. R. D. Goldman, J. R. Swedlow and D. L. Spector, Cold Spring Harbor Laboratory Press, Cold Spring Harbor, NY, 2nd edn, 2010, pp. 333–350 Search PubMed.
Footnote |
| † Electronic supplementary information (ESI) available. See DOI: 10.1039/c3an01550e |
| This journal is © The Royal Society of Chemistry 2014 |


