The B-13 hepatocyte progenitor cell resists pluripotency induction and differentiation to non-hepatocyte cells
Emma A. Fairhalla, Michelle A. Charlesa, Karen Wallaceab, Claire J. Schwabc, Christine J. Harrisonc, Marco Richterd, Stefan A. Hoffmannd, Keith A. Charltonb, Katrin Zeilingerd and Matthew C. Wright*a
aInstitute of Cellular Medicine, Newcastle University, Newcastle Upon Tyne, UK. E-mail: M.C.Wright@ncl.ac.uk
bSchool of Medical Sciences, University of Aberdeen, Aberdeen, UK
cLeukaemia Research Cytogenetics Group, Northern Institute for Cancer Research, Newcastle University, Newcastle Upon Tyne, UK
dBerlin-Brandenburg Center for Regenerative Therapies (BCRT), Charité Universitätsmedizin Berlin, Germany
First published on 24th June 2013
Abstract
The rat pancreatic “B-13” acinar cell is a stable progenitor cell line that differentiates into hepatocyte-like cells (B-13/H cells) in 2D un-coated plastic culture with simple culture media in response to glucocorticoid exposure. Examination of cytochrome P450 indicated that the expression of a range of genes were similar to freshly isolated hepatocytes and that these gene products were functional on the basis of spectrophotometrically-detectable reduced carbon-monoxide haemoprotein and metabolism of several drugs. Since normal hepatocytes readily de-differentiate under similar conditions, we hypothesized that B-13 cells have undergone a variety of alterations that stabilise a progenitor phenotype and restrict differentiation to hepatocytes only (which if capitulated in human cells, could generate a readily accessible supply of functional human hepatocytes in vitro). To examine this hypothesis, the B-13 karyotype; pluripotency-inducing transcription factor expression and forced over-expression of these factors in B-13 cells were examined. B-13 cells were also injected into NOD/SCID mice and engraftment and differentiation assessed by RT-PCR, Western blotting, immunohistochemistry and fluorescent in situ hybridization (FISH). B-13 cells expressed four pluripotency-inducing transcription factors c-Myc, Klf4, Oct4 and Sox2 with only c-Myc expression maintained after glucocorticoid treatment. Over-expression of the pluripotency-inducing transcription factors blocked B-13/H formation in response to glucocorticoid. Injection of B-13 cells into NOD/SCID mice resulted in their engraftment to the pancreas and liver, with restricted differentiation to hepatocytes in the liver. The cells did not engraft to any other tissues examined. The ability of B-13 cells to specifically generate functional hepatocytes in vitro in response to glucocorticoid is therefore associated with genetic rearrangements that may facilitate expression of genes associated with plasticity (without leading to pluripotency), which are repressed by glucocorticoid treatment.
Introduction
There is currently considerable effort directed towards generating human hepatocytes from stem cells since these would have both basic science (e.g. drug metabolism and toxicity screening) and clinical (e.g. incorporation into bio-artificial liver devices) applications).1 However, embryonic stem cells (ESCs) and induced pluripotent stem cells have so far failed in their ability to generate cells with comparable function to human hepatocytes in vitro,2–4 even after forced over-expression of liver transcription factors.5One alternative to using stem cells as a source for hepatocytes, is to use progenitor cells. In the liver, a bi-potential population of progenitor cells located within the ductal regions of the lobule is known to exist although harnessing this resource to generate hepatocytes in vitro has yet to be realised because there is little understanding of how to control their differentiation in vitro.6 The pancreas – which is developmentally closely related to the liver – also contains a ductal progenitor cell.7 The rat pancreatic progenitor “B-13” cell line appears to be related to this pancreatic ductal progenitor cell. Critically however, B-13 cells appear to be the only cells capable of generating functional hepatocytes (referred to as B-13/H cells) in vitro.8–11 B-13 differentiation into hepatocytes is achieved in a highly cost-effective manner, requiring the addition of a simple glucocorticoid hormone treatment.1,8–11 B-13/H cells are formed on a simple plastic sub-stratum and, in contrast to normal primary hepatocytes, they remain differentiated for at least several weeks.1
This contrasts markedly with normal primary rat hepatocytes cultured under the same conditions, which lose most hepatic functions within 2–3 days of isolation.1
Over the last few years, we have attempted to place the B-13 glucocorticoid response into a physiological context, since a human equivalent would have significant scientific and clinical value. We have shown that treating rats with a synthetic glucocorticoid results in the appearance of acinar cells which stain positive for the expression of hepatocyte markers.12 In mice with high circulating levels of endogenous glucocorticoid (that gives rise to Cushing's disease-like symptoms by adulthood), a large proportion of the acinar pancreas expressed genes normally restricted to hepatocytes.13 In a third of these mice, malabsorption developed because of a loss in pancreatic exocrine function.1,13
We hypothesized that the uniquely effective differentiation of B-13 cells to B-13/H cells is associated with genetic alterations in the cells that have resulted in a stable progenitor phenotype for at least 17 years (the cells were first derived in the mid 1990s14) and an ability to overcome the three hurdles required to generate hepatocytes in vitro. The data in this paper show that B-13/H cells express similar levels of cytochrome P450 to normal hepatocytes, and that the cytochrome P450 proteins have incorporated protoporphyrin IX and functionality. The B-13 cells which generate these cells had a range of cytogenetic alterations but these alterations did not result in cells that could proliferate in the absence of anchorage in vitro. The data also indicate that B-13 cells retain an apparent bias in their ability to engraft into tissues, engrafting to any significant extent only into the pancreas (the probable tissue of origin15) and the liver.
Results
B-13 cells give rise to B-13/H cells in response to glucocorticoid with comparable hepatocyte levels of functional cytochrome P450
Previous reports have demonstrated that B-13 cells undergo a re-programming in gene expression that results in the expression of a variety of genes associated with hepatocytes.1,8–11Fig. 1 confirms these data in cells used in the current studies, demonstrating an early induction of Sgk1 mRNA expression prior to an induction in Cebp-α and Cebp-β, which increased prior to and simultaneously respectively with the increase in the expression of hepatocyte marker Cyp2e1, Cps1 and albumin mRNAs (Fig. 1A). The increased expression of Cyp2e1, Cps1 and Cepb-β (and other markers, not shown) was observed in the majority of cells by day 14 of treatment with DEX (Fig. 1B) and to detectable levels of carbon monoxide reduced haemoprotein (Fig. 1C) that are similar to those found in freshly isolated rat hepatocytes (Table 1). Functional drug metabolising activity in B-13/H cells was confirmed through the addition of a range of drugs to the culture media and detection of metabolites (Fig. 1D). | ||
| Fig. 1 Production of B-13/H cells with functional drug metabolising activity. A, Quantitative RT-PCR for the indicated transcript after treatment with 10 nM DEX as indicated (↑), B-13/H = 14 days of treatment. Note, x-axis is on a log 10 scale. Data are the mean and standard deviation of 3 separate experiments. B, Immunocytochemistry for the indicated protein in B-13 and B-13/H cells, typical of at least 10 separate experiments. C, Reduced carbon monoxide versus reduced spectrum of B-13/H cells, typical of at least 3 separate experiments. B-13 cells did not contain detectable levels of either P420 or CYP450 (see Table 1). D, Metabolism of phenacetin, diclofenac, midazolam and bupropion to paracetamol, and hydroxylated products respectively. Data are the mean and standard deviation of 3 separate experiments. | ||
| Cells | [DEX] | Total CYP450 pmol mg−1 protein | Total CYP420a pmol mg−1 protein |
|---|---|---|---|
| Cell samples were washed in 1× PBS and stored as pellets at −80 °C until analysis. All data are the mean and standard deviation of at least 3 separate preparations. n/a, not applicable. n/d, not detectable.a Assumes haemoprotein is all CYP420. | |||
| Hepatocytes (freshly isolated) | n/a | 244 ± 26 | 493 ± 23 |
| B-13 | — | n/d | n/d |
| B-13/H | 10 nM | 170 ± 29 | 400 ± 29 |
B-13 cells are male cells with chromosomal abnormalities that constitutively express pluripotency inducing transcription factors but do not grow in soft agar
B-13 cells were cloned from the AR42J cell line in the mid 1990s14 and have been extensively expanded in culture for at least 17 years. Since this time, the cell line has retained both its proliferative capacity and differentiation response to glucocorticoid, suggestive of genetic alterations that confer a stable phenotype. To confirm if any genetic changes have occurred, the B-13 karyotype was therefore compared to cultured rat liver myofibroblasts (as a normal control) and the human hepatoma HepG2 cancer cell line (as with B-13 cells, both were similarly proliferative under the culture conditions outlined in the methods section). Analysis of each cell karyotype is summarized in Table 2. These data show that liver myofibroblasts had 42 chromosomes per cell (the normal rat diploid complement of chromosomes) whereas B-13 cells had 84 chromosomes and were near-tetraploid. In contrast, cancer HepG2 cells had an abnormal and variable number of chromosomes compared to a normal human cell. Fig. 2A shows a typical karyotype from B-13 cells and illustrates that there were a number of structural abnormalities evident, resulting in the identity of several chromosomes being ambiguous (Table 3).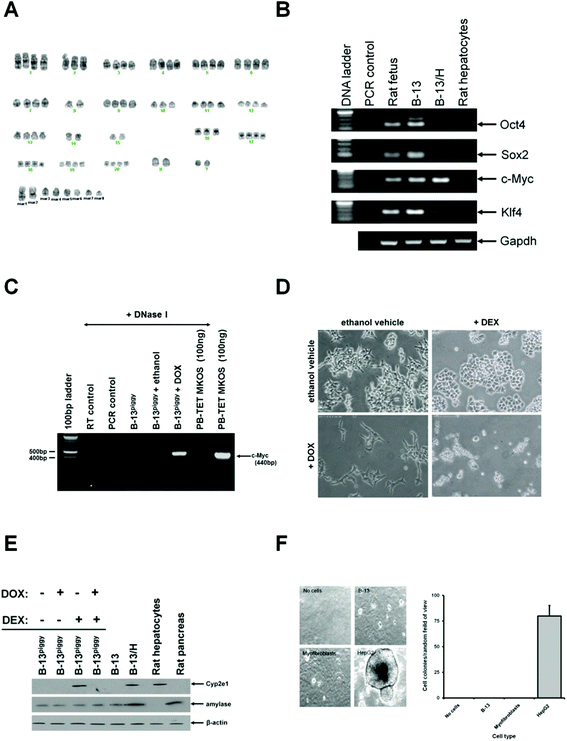 | ||
| Fig. 2 B-13 karyotype, pluripotency and growth characteristics in soft agar. A, Karyotype from a B-13 cell after analysis using CytoVision® Molecular Devices) software – identifiable chromosomes are as indicated below each grouping. B, RT-PCR for the indicated transcript, RT control, amplification in the absence of RNA template. C, RT-PCR for mouse c-Myc expression in B-13piggy cells after treatment as indicated for 14 days. All RNA was pre-treated with DNase I (1 unit per μg RNA) followed by inactivation at 65 °C for 10 min prior to PCR amplification to exclude genomic DNA carryover and PCR amplification of genomic murine c-Myc transgene. Amplification from PB-TET-MKOS with or without DNase I treatment was used to confirm DNA digestion. RT control, amplification in the absence of input RNA; PCR control, amplification in the absence of DNA template. D, photomicrographs of B-13piggy cells treated as indicated for 14 days. E, Western blot for the indicated protein after treatment as indicated for 14 days. F, left – typical fields of view of the indicated cell line 14 days after seeding in soft agar, right – bargraph comparing the number of colonies observed for each cell line 14 days after seeding in soft agar. Data are the mean and standard deviation colonies observed from 3 separate experiments. *Significantly different number of colonies versus no cells control p > 0.05) using Student's t test two tailed). | ||
| Cell type | Spreads analysed | Number of chromosomes (observed per cell – mean ± SD) | Range (chromosomes per cell) min–max | Mode (chromosomes per cell) | Number of chromosomes per cell |
|---|---|---|---|---|---|
| B-13 | 17 | 82.4 ± 1.73 | 79–84 | 84 | 84 |
| Myofibroblasts | 11 | 41.6 ± 0.67 | 40–42 | 42 | 42 |
| HepG2 | 13 | 75.9 ± 6.01 | 68–83 | 80 | Variable |
| Chromosome no. | Copies positively identified/cell | Abnormalities | Unidentified – therefore presume marker chromosome (abnormality) | Comments |
|---|---|---|---|---|
| n/d = none detected. | ||||
| 1 | 4 | n/d | ||
| 2 | 3 | 1 | 1 chromosome appears to have a fragile site at 2q14 | |
| 3 | 4 | n/d | ||
| 4 | 4 | n/d | ||
| 5 | 4 | n/d | ||
| 6 | 4 | n/d | ||
| 7 | 4 | n/d | ||
| 8 | 2 | n/d | 2 | |
| 9 | 4 | n/d | ||
| 10 | 3 | n/d | 1 | |
| 11 | 4 | n/d | ||
| 12 | 4 | n/d | ||
| 13 | 4 | n/d | ||
| 14 | 2 | n/d | 2 | |
| 15 | 2 | n/d | 2 | |
| 16 | 3 | n/d | 1 | Marker 2? |
| 17 | 4 | n/d | ||
| 18 | 4 | n/d | ||
| 19 | 4 | All copies appear different | ||
| 20 | 4 | n/d | ||
| X | 2 | n/d | ||
| Y | 2 | n/d | ||
Since four transcription factors – c-Myc, Klf4, Oct4 and Sox2 – have been shown to induce pluripotency in cells,16,17 the effect of DEX on their expression was examined. Fig. 2B shows that all 4 transcription factors were detectable in B-13 cells and that expression of Klf4, Oct4 and Sox2 were suppressed in B-13/H cells, suggesting a potential role of these factors in B-13 cell phenotype and/or regulation in the differentiation to B-13/H cells. To test this hypothesis, B-13 cells were stably transfected with a construct encoding a transposase which catalyses the incorporation of piggybac vectors into genomic DNA. After generation of this cell line (B-13trans), B-13trans cells were transfected with PB-CA-rTA Adv and PB-TET-MKOS and cell lines stably transfected with these constructs isolated. To confirm stable piggybac-directed transgene expression, 3 B-13piggy cell lines were screened through treatment with doxycycline (DOX) to induce expression of the four mouse pluripotency-inducing transcription factors.16,17 RT-PCR was used to screen for murine c-Myc induction (note, amino acid-coding mouse and rat Klf4, Oct4 and Sox2 transcripts are highly homologous and primers could not distinguish between them). Fig. 2C demonstrates induction of c-Myc transgene expression after DOX treatment (after DNase I treatment of RNA to avoid amplification of genomic c-Myc DNA) in a line successfully generated through this strategy. Fig. 2D and E demonstrate that B-13piggy cells retained their response to DEX treatment and differentiated into B-13/H cells as determined morphologically and through induction of liver-specific gene expression. Treatment with DOX to induce expression of the pluripotency inducing transcription factors resulted in a change of B-13piggy to a more fibroblastic phenotype. DOX and DEX treatment resulted in significant cell death (Fig. 2D) with the surviving cells remaining resistant to differentiation into B-13/H cells (Fig. 2E). Note, that B-13 differentiation into B-13/H cells was also accompanied with ∼10–20% cell death (data not shown).
Normal cell proliferation requires anchorage to a sub-stratum. In contrast, tumourigenic cells proliferate without the requirement for anchorage to a substratum. Fig. 2F demonstrates that B-13 cells failed to proliferate in soft agar similarly to liver myofibroblasts, which both proliferated in serum-containing media in vitro. In contrast, the human hepatoma HepG2 cell line – used as a positive control – continued to proliferate in soft agar.
B-13r cells retain differentiation potential to form hepatocytes in vitro
To aid in the tracking of B-13 cells in NOD/SCID mice, B-13 cells were stably transfected with a construct that encodes the constitutive expression of a red fluorescent protein, to generate the B-13r cell line. Fig. 3A and B demonstrate that B-13r cells retained the morphological change and red fluorescent protein expression when converted into B-13/Hr cells through treatment with DEX, although the DsRed protein was localized less to the nucleus in B-13/Hr cells and was present to a greater degree in the cytoplasm when compared to B-13r cells. B-13r cells also retained their ability to differentiate into functional hepatocytes in response to DEX treatment at the level of mRNA (Fig. 3C) and protein (Fig. 3D). B-13/Hr cells retained a degree of pancreatic amylase expression (Fig. 3C and 3D) with the majority of B-13/Hr cells expressing liver markers albumin and Cyp2e1 compared to undetectable levels of expression of these genes in B-13r cells (Fig. 3C and 3D). DsRed fluorescence is therefore likely also to be expressed in B-13r cells which differentiate into B-13/Hr cells in vivo.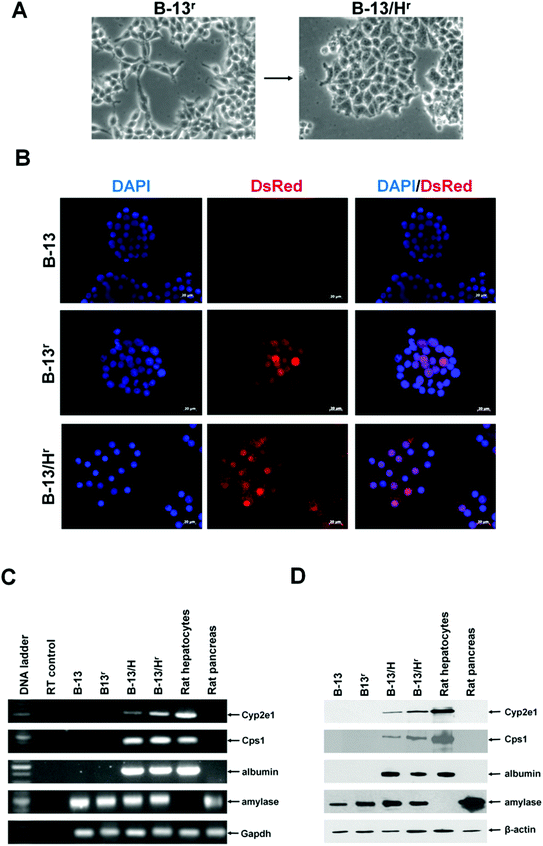 | ||
| Fig. 3 Generation of B-13r cells and differentiation to B-13/Hr cells in response to DEX in vitro. A, Typical light micrographs of parent B-13r cell line (upper) and B-13/Hr cells (lower) observed after 14 days treatment with 10 nM DEX. B, Fluorescence microscopy for the indicated cell type screening for DNA using DAPI staining) and DsRed expression. DAPI/DsRed panels are merged images. C, RT-PCR analysis for the indicated transcripts, RT control amplification in the absence of input RNA. D, Western blot for expression of the indicated proteins. All results presented are typical of at least 3 independent experiments. | ||
B-13r cells engraft into the pancreas and liver of female NOD/SCID mice
To determine whether B-13 cells engraft into tissues in vivo, B-13r cells were injected into female NOD/SCID mice. Using the DsRed transgene as a marker, B-13r cells were identified in both the liver and pancreas (Fig. 4A), but were not observed in any other tissues examined (lung, heart, brain, bone marrow, thymus, spleen, kidney and adipose tissue – data not shown). Since amylase expression is retained in B-13/Hr cells expressing hepatocyte markers in vitro (see Fig. 3C and 3D), expression of amylase was employed as a marker to screen tissues from NOD/SCID mice injected with B-13r cells. Using RT-PCR primers specific for the rat amylase transcript (rAmylase), Fig. 4B shows that B-13r cells engrafted into both the livers and pancreata of both control and paracetamol pre-treated mice, but not in other tissues. Interestingly, primers specific for the rat cyp2e1 transcript (rCyp2e1) show this transcript was detectable in the livers from several mice injected with B-13r cells, suggesting that the cells differentiate into B-13/Hr cells in the liver, but not in the pancreas (or any other tissue). The more quantitative determination by Western blotting of tissue extracts for amylase expression essentially confirms these data and indicates significant engraftment of B-13r cells into the liver but not other tissues (Fig. 4C). Fig. 4D further confirms these observations, showing typical immunohistochemical staining in liver for amylase expression and comparative results in lung and heart. There was also no evidence of B-13r engraftment using amylase as a probe in bone marrow, brain, thymus, spleen, kidney and adipose tissue (data not shown). Despite the fact that paracetamol injures the centrilobular region of the liver lobule – zone 3 of the acinus,18 B-13 cells consistently engrafted into the periportal region of the lobule in both control and paracetamol pre-treated mice.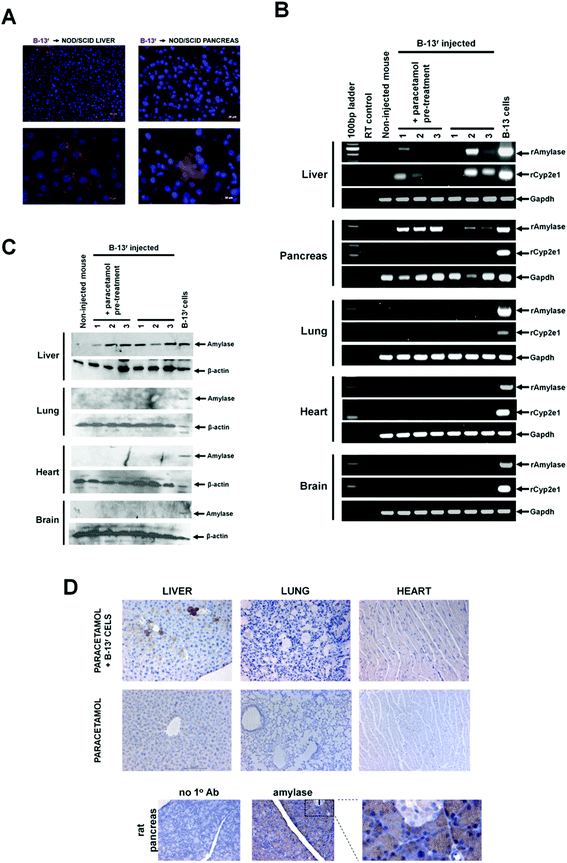 | ||
| Fig. 4 B-13r cells engraft into the pancreas and liver of NOD/SCID mice. A, Tissue sections from liver and pancreata from NOD/SCID mice injected with B-13r cells. Sections were stained with DAPI and analysed for the presence of DsRed positive cells. No DsRed positive cells were observed in tissue sections from mice that had not been injected with B-13r cells. B, RT-PCR for rat amylase (rAmylase) and rat cyp2e1 (rCyp2e1) in NOD/SCID mice (mouse numbers refer to individual recipient mice) tissues after injection of B-13r cells, RT control, amplification in the absence of input RNA. C, Western blot for amylase expression in NOD/SCID mice (mouse numbers refer to individual recipient mice) tissues after injection of B-13 cells as outlined in methods section. D, Immunohistochemical staining for amylase in tissues from female NOD/SCID mice (upper panels) treated as indicated. Lower panels, rat pancreas tissue demonstrating specific staining for amylase in acinar tissue. No 1o Ab, staining performed without addition of primary anti-amylase antibody. I, islet, with region expanded to right. | ||
The cytogenetic data in Fig. 2A suggests that the B-13 cell line was derived from a male rat since all the chromosomal spreads examined contained two Y chromosomes (since the cells were tetraploid). Fig. 5A and 5B confirm that B-13 cells are male cells since a sequence of DNA present only on the rat Y chromosome was amplified from DNA isolated from either B-13 cells or male rats (but not from DNA isolated from female rats) and Y chromosome FISH bound only to cultured B-13 or male rat cells respectively. Fig. 5C and 5D confirm using FISH, that B-13r cells engrafted into the liver since cells within the female liver contain the Y chromosome. Serial sections show that the number of cells containing the Y chromosome is spread over a greater area of the lobule than the cells which stain for amylase. This suggests that the in vivo hepatic environment is required to fully repress amylase expression as B-13r-derived cells are found further from the portal tract. Furthermore, it suggests that B-13r cells differentiate into B-13/Hr cells in vivo without compromising the health of the mice.
 | ||
| Fig. 5 Confirmation of B-13r cell engraftment in the liver and evidence for differentiation to B-13/Hrin vivo. A, PCR amplification from DNA isolated from B-13 cells, male or female rats. Primer sequences which specifically anneal to sequences within the indicated chromosome are given in Table 3. PCR control, amplification in the absence of DNA template. B, FISH analysis for the Y chromosome in B-13 cells and in liver myofibroblasts isolated from male or female rats. “− probe”, procedure undertaken in the absence of Y probe as a control. White arrow indicates high magnification view on right of panel. C, Y chromosome FISH in liver sections prepared from the indicated sex and species, demonstrating that FISH is specific for male rat cells and that the probe does not hybridise to female rat cells or male NOD/SCID cells. D, Serial sections immunostained for amylase (left) and Y chromosome FISH (right) in a liver section from a paracetamol-treated NOD/SCID mouse injected with B-13 cells. E, DAPI and albumin stained sections of liver from PBS control of B-13r injected NOD/SCID mice imaged for the indicated marker. | ||
To confirm that engrafted B-13r cells differentiate into hepatocytes in vivo, liver sections from NOD-SCID mice were examined for the expression of DsRed and albumin by fluorescence microscopy. Fig. 5E indicates that DsRed cells also stained positive for albumin (supporting data from Fig. 4B), suggesting B-13 cells differentiate in B-13/Hr cells in vivo.
Discussion
These data demonstrate that B-13 cells generate functional hepatocyte-like B-13/H cells in vitro in response to glucocorticoid treatment. Quantitative RT-PCR confirm for the first time that Sgk1 mRNA induction is one of the earliest events associated with glucocorticoid treatment in B-13 cells and that Cebp-β expression correlates with the expression of hepatic genes. Previous work has shown that ectopic expression of Cebp-β alone is sufficient to induce a B-13/H-like phenotype in B-13 cells.8 The data presented in this work however, reports a prior induction of Cebp-α, which may suggest that this transcription factor may control earlier events in hepatic differentiation.Data in this paper also demonstrate for the first time that B-13 cells have a number of chromosomal changes (but retain a 4n complement of chromosomes), a feature typical of many dividing cells that have been propagated for some time in vitro but have not undergone transformation, such as ESC lines.19 B-13 cells also expressed the four pluripotency inducing transcription factors, c-Myc, Klf4, Oct4 and Sox2. Previous data has shown that B-13 cells readily differentiate into hepatocytes but are resistant to de-differentiation (i.e. they maintain their hepatocyte progenitor phenotype) and do not differentiate into any other cell type.1,10 The data in this paper indicate that Klf4, Oct4 and Sox2 expression falls as B-13 cells differentiate into B-13/H cells and suggest that a suppression of at least Klf4, Oct4 and Sox2 is required for differentiation, since their forced over-expression completely blocked differentiation into B-13/H cells in response to DEX. Interestingly, the continued propagation of B-13piggy with transgene selection did not maintain the fibroblastic phenotype initially observed and there was a return to the B-13 phenotype and normal B-13/H formation in response to DEX (without loss of DOX-dependent c-Myc induction, data not shown). These observations suggest that the potential plasticity induced by over-expression of c-Myc, Klf4, Oct4 and Sox2 is counteracted by an unidentified factor(s) in B-13 cells, which may be essential for its progenitor status and restricted differentiation potential. The identification and controlled expression of this factor(s) will likely be important in controlling progenitor cells and hepatocyte production therefrom.
B-13 cells also did not grow in soft agar, indicating that they retain a requirement for anchorage-dependent growth and responsiveness to factors which prevent un-controlled cell growth. On this basis, the cells could be defined as un-transformed and potentially non-cancerous. This is supported by the fact that B-13 cells did not give rise to tumours (or teratomas) when injected into NOD/SCID mice, although longer periods of time (>1 year) would be required to fully test this hypothesis. Interestingly, the cells appeared to specifically engraft only in the liver and pancreas. Hepatic engrafted B-13 cells differentiated into hepatocytes and appeared to down regulate amylase expression (which is down-regulated but not lost when B-13 cells are converted to B-13/H cells in vitro) as the cells moved into the parenchyma. In contrast, on the basis of primer pairs selective for rat amylase and rat Cyp2e1 transcripts, B-13 cells did not differentiate into hepatocytes in the pancreas despite clear evidence (using the rat amylase-specific transcript PCR primer pairs) that B-13 cells engrafted into the pancreata of mice (the high levels of degradative enzymes present in acinar pancreas prevented an effective FISH analysis in pancreas tissue).
Of fundamental importance and utility, B-13 cells are readily propagated in simple culture media; are expanded on plastic culture ware and require a single chemical hormone to drive a change in differentiation.1,10 Furthermore, the majority (>80%) of B-13 cells differentiate into B-13/H cells and express a vast array of liver-specific or liver-enriched genes at quantitatively similar levels to hepatocytes freshly isolated from rats.1,10 The remaining cells retain a B-13 phenotype, which likely explains why this cell line remains in existence so long after its isolation (i.e. factors within the culture prevent some cells from differentiating from the progenitor phenotype). Although the B-13 response mirrors a pathophysiological response of the acinar pancreas to elevated – Cushing's disease levels – of glucocorticoid,13 the unique features of B-13 cell differentiation are likely dependent on some of the chromosomal changes that have occurred in this cell line. Yet these changes may not have transformed the cell into a fully neoplastic phenotype.
Hepatocytes are a valuable resource for screening drugs and chemicals for metabolism and toxicity.1 The B-13 cell alone could be a valuable tool in in vitro toxicity and genotoxicity testing, since it retains the ability to express drug and chemical metabolic activity in the B-13/H phenotype. Accordingly, the B-13 cell has considerable “3Rs” potential since safety testing can not only be performed in vitro, but be performed without the requirement for animal donors.
Materials and methods
Plasmid DNA constructs
The piggybac vectors PB-CA-rTA Adv and PB-TET-MKOS18,19 were supplied by Dr Andras Nagy (Samuel Lunenfeld Research Institute, Mount Sinai Hospital, Toronto, Canada). pCyL4320 was obtained from Wellcome Trust Sanger Institute (Cambridge, UK). The pDsRed2-C1 construct encoding a red fluorescent protein was purchased from Clontech.Cell isolation and culture
B-13 cells and the human hepatoma HepG2 cell line were routinely cultured in Dulbecco's minimum essential medium (DMEM) supplemented with 10% (v/v) foetal calf serum (FCS), 80 μg ml−1 penicillin and 80 μg ml−1 streptomycin. Rat liver myofibroblasts were generated from the culture activation of quiescent hepatic stellate cells essentially as previously described.21 Myofibroblasts were cultured in DMEM containing 4.5 g l−1 of glucose and supplemented with 16% (v/v) FCS, 80 μg ml−1 penicillin and 80 μg ml−1 streptomycin. Rat hepatocytes were prepared by collagenase perfusion essentially as previously described.9 All cells were incubated at 37 °C in an humidified incubator gassed with 5% CO2 in air. Dexamethasone (DEX) was purchased from the Sigma Chem Co. (Poole, UK) and was added to medium from 1000-fold concentrated ethanol vehicle solvated stocks, control cells were treated with 0.1% (v/v) ethanol alone as control. Cells treated for 14 days with DEX are referred to as B-13/H cells (B-13 cells with an hepatocyte phenotype).B-13 cells were transfected with a variety of plasmid constructs using effectene (Qiagen, Southampton, UK) and stably transfected lines generated through repeated selection and expansion with antibiotics. B-13 cells stably expressing a transposase (B-13trans) from the pCyL43 vector – required for the efficient incorporation of piggybac vectors into genomic DNA – were treated with puromycin (0.05–0.2 μg ml−1). B-13trans cells were then transfected with the piggybac vectors PB-CA-rTA Adv and PB-TET-MKOS and cells stably incorporating piggybac vectors into genome selected using G418 selection to generate B-13piggy. PB-CA-rTA Adv encoded the constitutive expression of the reverse tetracycline transactivator that is inhibited by doxycycline. PB-TET-MKOS is a piggybac vector encoding the 4 mouse pluripotency-inducing transcription factors c-Myc, Klf4, Oct4 and Sox2 under regulation of the tetO2 tetracycline/doxycycline inducible promoter. Piggybac transgene expression was induced through treatment with doxycycline (DOX) at 100 μg ml−1. B-13 cells stably expressing the DsRed fluorescent protein (B-13r) were generated by transfection with the pDsRed2-C1 construct followed by selection using G418 (200–500 μg ml−1).
For cultures in soft agar, cells were trypsinised from the standard cultures and re-suspended in media containing 0.35% (w/v) agarose and at a concentration of 2.5 × 10³ cells per ml for potential to grow in soft agar essentially as previously outlined.22 The cell/agarose mixture (1 ml per well) was overlaid onto a solidified base layer containing cell media and 0.5% (w/v) agarose. Once solidified, each well was supplemented with 500 μl of cell media to prevent drying out. The cells were then cultured for 2 weeks, with regular additions of fresh cell media, before staining each well with 500 μl of 0.005% (w/v) crystal violet for 1 hour. Colonies were imaged using an Optika microscope and images recorded using a BUC2-500c camera (Bestscope International Ltd).
RT-PCR and PCR
Total RNA was purified using Trizol (Invitrogen, Paisley, UK) and RT-PCR performed and analysed essentially as previously outlined.10 Foetal RNA was prepared from foetuses isolated and pooled from pregnant female rats at day 12 after conception (time from vaginal plug formation). Primer sequences for the amplification of rat cytochrome P450 2E1 (Cyp2e1), rat amylase, rat Cps1, rat albumin and glyceraldehyde-3-phosphate dehydrogenase (Gapdh) have been published previously.10 Other primer sequences are given in Table 4. Quantitative RT-PCR employed the use of an Applied Biosystems7500 Real-Time PCR machine, using SYBR® Green Jumpstart™ mastermix (Sigma-Aldrich, UK), with 2 μM forward and reverse primer. Primer sequences are given in Table 4.| Oligo ID | 5′–3′ sequence | An'ling conditions (°C) | Comments |
|---|---|---|---|
| RT-PCR | |||
| rc-MycUS | TCTCGGCCGCTGCCAAACTG | 58 | Will amplify rat c-Myc (NM_012603.2), generating a fragment of 204 bp. |
| rc-MycDS | TGGGCGAGCTGCTGTCGTTG | ||
| rKlf4US | GGCGGGCTGATGGGCAAGTT | 58 | Will amplify rat Klf4 (NM_053713.1), generating a fragment of 235 bp. |
| rKlf4DS | GCTGGGGTCCAGCGCTCAAG | ||
| rOct4US | TGGTGCAGGCCCGGAAGAGA | 58 | Will amplify rat Oct4 (NM_001009178.1), generating a fragment of 180 bp. |
| rOct4DS | TCCCCTTCTGGCGCCGGTTA | ||
| rSox2US | CTTCCCGGAGGCTTGCTGGC | 58 | Will amplify rat Sox2 (NM_001109181.1), generating a fragment of 105 bp. |
| rSox2DS | CGCGTAGCTGTCCATGCGCT | ||
| mc-MycUS | TTTCTCAGCCGCTGCCAAGCTGGTCTCG | 58 | Selectively amplifies mouse c-Myc (NM_001177352.1), 440 bp fragment over rat c-Myc (NM_012603.2) – 10 nucleotide mismatches between rat and mouse transcripts in primer hybridisation regions (see ESI Fig. 2). |
| mc-MycDS | GGGATGGAGATGAGCCCGACTCC | ||
| rAmylaseUS | TGTGGCTCGGGCAATAGTGCA | 62 | Selectively amplifies rat pancreatic amylase 2 (NM_031502.1) 497 bp fragment over mouse pancreatic amylases (NM_001190403.1, NM_001042711.2, NM_001160150.1, NM_001160152.1, NM_001160151.1, XM_003084551.2) – at least 5 and upto 12 nucleotide mismatches between rat and mouse transcripts in primer hybridisation regions. |
| rAmylaseDS | CCATTCCATTTGCGAATAACTGTGCCA | ||
| rCyp2e1US | CCTGAAAACTTCCTGATATC | 60 | Selectively amplify rat Cyp2e1 (NM_031543.1) 86 bp fragment over mouse cyp2e1(NM_021282.2) – 13 nucleotide mismatches between rat and mouse transcript in primer hybridisation regions. |
| rCyp2e1DS | TGATAGGAACTCTATATGCTTGGGT | ||
| Genomic DNA PCR | |||
| rXchromUS | CTCTGAAGACAGAAGATTAGA | 50 | Will amplify a 114 bp intronic sequence of the rat zinc finger protein X-linked (Zfx) gene (NM_001109017.1) specifically present on the X chromosome. |
| rXchromDS | TTGCCTTGGTCATGTGTC | ||
| rYchromUS | ATAGGTTTTCAGGTGTTGCCTGG | 55 | Will amplify a 243 bp intronic sequence of the rat testis-specific protein TSPY gene (AF074879.1) specifically present on the Y chromosome. |
| rYchromDS | TAATGAATGGTCAGAGAAAGCCAAC | ||
| genomCYP2E1US | AGAGGAGGGTGGACCAGTCCTGCACTCCT | 55 | Will amplify a 867 bp promoter sequence of the rat CYP2E1 gene (NW_047563.2) specifically present on rat chromosome 1. |
| genomCYP2E1DS | CTGGGGCTCCACTGTAAACTTGTAGGAATT TGCTG | ||
Genomic DNA was isolated from B-13 cells and rats as previously described13 and subjected to PCR analysis for the presence of a non-coding X chromosome-specific sequence within the ZFX zinc finger protein; a non-coding Y chromosome specific sequence (testis-specific protein TSPY gene) and a control non-coding, non-sex chromosome sequence (promoter region of the rat Cyp2e1 gene). For details of the primer sequences employed and the regions amplified, see Table 4.
Western blotting
Western blotting was performed essentially as previously outlined with antibodies described previously.10,11 Detection was achieved using an ECL kit (Amersham, UK).Immunohistochemistry
Cultured cells were prepared by permeabilising in ice-cooled methanol for 10 minutes before washing in 1× PBS and fixing in 2% w/v formaldehyde and 0.2% glutaraldehyde in 1× PBS pH 7.4. Tissues were fixed in formalin and processed for immunohistochemistry as previously outlined with antigen retrieval using 0.01 M citrate buffer.23 Non-specific binding of antibodies was blocked in all samples through incubation with 20% (v/v) bovine foetal calf serum (FCS) in 1× PBS for 20 minutes at room temperature. Samples were then incubated with primary antibodies diluted in 0.05% (v/v) FCS and left to incubate overnight at 4 °C. Samples were washed twice in 1× PBS before applying secondary antibodies for 1 hour at RT.Drug metabolism assays
Total spectrophotometric cytochrome P450 was determined as outlined.24 Drug metabolising activity of cells in culture was determined through the addition of phenacetin, diclofenac (both from Sigma-Aldrich, St. Louis, MO), bupropion (Toronto Research Chemicals, North York, Canada) and midazolam (Roche, Mannheim, Germany) as a cocktail with final concentrations in the medium of 26 μM, 9 μM, 100 μM and 3 μM respectively. Samples of media were taken at 1 and 3 hours after addition of substrates and frozen at −80 °C until analysis. The concentrations of metabolites were analysed at Pharmacelsus GmbH, Saarbrücken, Germany, as previously described.25 The formation rate of metabolites was calculated from the slope of the regression line of the concentration–time curve.25Karyotyping
For karyotyping, cells were expanded in culture to approximately 75% confluency and metaphase-arrest induced by adding 0.1 μg ml−1 colchicine in fresh media for 1 hour. The cells were then harvested by trypsinisation in EDTA (Sigma Chem Co, Poole, UK) and washed with 1× PBS (137 mM NaCl, 2.7 mM of KCl, 10 mM phosphate (pH 7.4)) and pelleted by centrifugation at 400 g for 5 minutes. The cell pellet was re-suspended in 0.075 M KCl added dropwise up to the volume of 10 ml before incubating the solution at 37 °C for 10 minutes. The cells were pelleted by centrifugation and re-suspended in 5 ml of ice cold fixative (3![[thin space (1/6-em)]](https://www.rsc.org/images/entities/char_2009.gif) :1 methanol–acetic acid) with continuous gentle mixing to avoid clumping. Centrifugation was repeated and the cells were re-suspended in 2 ml of fixative, this step was repeated twice. The cells were then incubated at −20 °C overnight, re-suspended in fresh fixative and then dropped onto an angled glass slide under humidified conditions and left to dry in air overnight. The slides were then incubated in trypsin solution for 15 seconds before immediate transfer to saline solution (0.9% (w/v) NaCl) and then two 5 minute washes prior to staining with Wright-Giesma staining solution (Sigma Chem Co, Poole, UK) for 4 minutes. The slides were then rinsed in distilled water, blot dried and mounted with coverslips using DPX prior to image analysis using a Zeiss Axioskop microscope with CytoVision® (Leica) software.
:1 methanol–acetic acid) with continuous gentle mixing to avoid clumping. Centrifugation was repeated and the cells were re-suspended in 2 ml of fixative, this step was repeated twice. The cells were then incubated at −20 °C overnight, re-suspended in fresh fixative and then dropped onto an angled glass slide under humidified conditions and left to dry in air overnight. The slides were then incubated in trypsin solution for 15 seconds before immediate transfer to saline solution (0.9% (w/v) NaCl) and then two 5 minute washes prior to staining with Wright-Giesma staining solution (Sigma Chem Co, Poole, UK) for 4 minutes. The slides were then rinsed in distilled water, blot dried and mounted with coverslips using DPX prior to image analysis using a Zeiss Axioskop microscope with CytoVision® (Leica) software.Injection of B-13r cells into NOD/SCID mice
Cultured B-13r cells were harvested by trypsinisation and washed in sterile 1× PBS before re-suspension at a concentration of 1 × 10⁶ ml−1 in 1× PBS and injection via the tail vein of 200 μl (2 × 10⁵ cells) into 10–12 week old female severe combined immune deficient (NOD/SCID) mice (PrkdcscidIl2rgtm1Wjl/SzJ also known as NOD scid gamma mice) bred in-house in the Comparative Biology Centre, Newcastle University. NOD/SCID mice were pre-treated with 20 mg kg−1 of paracetamol in 1× PBS by i.p. injection 3 days prior and on the day of cell injection, to stimulate a moderate level of liver damage. Tissues were examined 2 weeks after injection of cells.Fluorescence in situ hybridisation (FISH)
FISH was carried out essentially described,26 with some modifications. In brief, paraffin-embedded tissue sections were mounted onto coated slides and baked overnight at 55 °C. Slides were de-paraffinised in 3 changes of xylene at room temperature for 10 minutes before dehydrating in two changes of 100% ethanol for 5 minutes and air drying. Sections were then incubated in 0.2 M HCl for 20 minutes and subsequently washed twice in 2× saline-sodium citrate (SSC) buffer (1× SSC consists of 150 mM NaCl, 340 mM Na3Citrate pH 7.4) for 5 minutes, followed by incubation in 1 M NaSCN at 80 °C for 10 minutes before two further 5 minute washes in 2× SSC. Tissue digestion was performed by incubating sections at 37 °C overnight with 0.4% (w/v) pepsin in 0.001 M HCl. Sections were then washed twice in 2× SSC and air dried before re-fixation in 10% formalin in 1× PBS for 15 minutes. Slides were washed twice with 2× SSC and air dried before addition of 10 μl of RatIDetectTM Chr Y FISH paint probe (Cambio) and sections sealed with coverslips. The slides were then heated to 90 °C for 5 minutes to denature double stranded DNA and the probe hybridised overnight at 37 °C in an humidified environment. After hybridization, coverslips were removed by soaking in 2× SSC and sections subjected to post-hybridisation washes twice in 2× SSC/0.1% (v/v) Tween-20 at 45 °C followed by two washes in 0.5 X SSC/0.1% (v/v) Tween-20 at 45 °C. Slides were briefly rinsed in H2O and air dried in the dark prior to staining with 4′,6′-diamidino-2-phenylindole and anti-fade compound (Vectashield), coverslipping, sealing and microscopic examination using a Zeiss AxioImager microscope using excitation and emission wavelength of 611 and 631 nm respectively.Acknowledgements
Supported by an MRC ITTP PhD studentship (to EAF). The research leading to these results has also received funding from the European Union's Seventh Framework Programme (FP7/2007-2013) under grant agreement no. 287596 (see also http://www.D-LIVER.eu/).References
- K. Wallace, E. A. Fairhall, K. A. Charlton and M. C. Wright, AR42J-B-13 cell: an expandable progenitor to generate an unlimited supply of functional hepatocytes, Toxicology, 2010, 278, 277–287 CrossRef CAS.
- G. J. Sullivan, D. C. Hay, I. H. Park, J. Fletcher, Z. Hannoun and C. M. Payne, et al., Generation of functional human hepatic endoderm from human induced pluripotent stem cells, Hepatology, 2010, 51, 329–335 CrossRef CAS.
- P. Sancho-Bru, P. Roelandt, N. Narain, K. Pauwelyn, T. Notelaers and T. Shimizu, et al., Directed differentiation of murine-induced pluripotent stem cells to functional hepatocyte-like cells, J. Hepatol., 2011, 54, 98–107 CrossRef CAS.
- S. Sekiya and A. Suzuki, Direct conversion of mouse fibroblasts to hepatocyte-like cells by defined factors, Nature, 2011, 475, 390–393 CrossRef CAS.
- K. Takayama, M. Inamura, K. Kawabata, M. Sugawara, K. Kikuchi and M. Higuchi, et al., Generation of metabolically functioning hepatocytes from human pluripotent stem cells by FOXA2 and HNF1α transduction, J. Hepatol., 2012, 57, 628–636 CrossRef CAS.
- V. Cardinale, Y. Wang, G. Carpino, C. B. Cui, M. Gatto and M. Rossi, et al., Multipotent stem/progenitor cells in human biliary tree give rise to hepatocytes, cholangiocytes and pancreatic islets, Hepatology, 2011, 54, 2159–2172 CrossRef CAS.
- E. Wandzioch and K. S. Zaret, Dynamic signalling network for the specification of embryonic pancreas and liver progenitors, Science, 2009, 324, 1707–1710 CrossRef CAS.
- C. N. Shen, J. M. Slack and D. Tosh, Molecular basis of transdifferentiation of pancreas to liver, Nat. Cell Biol., 2000, 2, 879–887 CrossRef CAS.
- C. J. Marek, G. A. Cameron, L. J. Elrick, G. M. Hawksworth and M. C. Wright, Generation of hepatocytes expressing functional cytochromes P450 from a pancreatic progenitor cell line in vitro, Biochem. J., 2003, 370, 763–769 CrossRef CAS.
- K. Wallace, C. J. Marek, S. Hoppler and M. C. Wright, Glucocorticoid-dependent transdifferentiation of pancreatic progenitor cells into hepatocytes is dependent on transient suppression of WNT signalling, J. Cell Sci., 2010, 123, 2103–2110 CrossRef CAS.
- K. Wallace, Q. Long, E. A. Fairhall, K. A. Charlton and M. C. Wright, Serine/threonine protein kinase SGK1 in glucocorticoid-dependent trans-differentiation of pancreatic acinar cells to hepatocytes, J. Cell Sci., 2011, 124, 405–413 CrossRef CAS.
- K. Wallace, C. J. Marek, R. A. Currie and M. C. Wright, Exocrine pancreas trans-differentiation to hepatocytes – a physiological response to elevated glucocorticoid in vivo, J. Steroid Biochem. Mol. Biol., 2009, 116, 76–85 CrossRef CAS.
- K. Wallace, P. A. Flecknell, A. D. Burt and M. C. Wright, Disrupted pancreatic exocrine differentiation and malabsorption in response to chronic elevated systemic glucocorticoid, Am. J. Pathol., 2010, 177, 1225–1232 CrossRef CAS.
- H. Mashima, H. Shibata, T. Mine and I. Kojima, Formation of insulin-producing cells from pancreatic acinar AR42J cells by hepatocyte growth factor, Endocrinology, 1996, 137, 3969–3976 CrossRef CAS.
- N. W. Jessop and R. J. Hay, Characteristics of two rat pancreatic exocrine cell lines derived from transplantable tumours, In vitro, 1980, 16, 212 Search PubMed.
- K. Woltjen, I. P. Michael, P. Michael, R. Desai, M. Mileikovsky and R. Hämäläinen, et al., piggyBac transposition reprograms fibroblasts to induced pluripotent stem cells, Nature, 2009, 458, 766–770 CrossRef CAS.
- K. Kaji, K. Norrby, A. Paca, M. Mileikovsky, P. Mohseni and K. Woltjen, Virus-free induction of pluripotency and subsequent excision of reprogramming factors, Nature, 2009, 458, 771–775 CrossRef CAS.
- K. Wallace, A. D. Burt and M. C. Wright, Liver fibrosis, Biochem. J., 2008, 411, 1–18 CrossRef CAS.
- D. E. Baker, N. J. Harrison, E. Maltby, K. Smith, H. D. Moore and P. J. Shaw, Adaptation to culture of human embryonic stem cells and oncogenesis in vivo, Nat. Biotechnol., 2007, 25, 207–215 CrossRef CAS.
- J. Cadiñanos and A. Bradley, Generation of an inducible and optimized piggyBac transposon system, Nucleic Acids Res., 2007, 35, e87 CrossRef.
- M. C. Wright, R. Issa, D. E. Smart, N. Trim, G. I. Murray and J. N. Primrose, et al., Gliotoxin stimulates the apoptosis of human and rat hepatic stellate cells and enhances the resolution of liver fibrosis in rats, Gastroenterology, 2001, 121, 685–698 CrossRef CAS.
- C. J. Taylor, J. Qiao, N. C. Colon, C. Schlegel, E. Josifi and D. H. Chung, Integrin-linked kinase regulates phosphatase and tensin homologue activity to promote tumorigenesis in neuroblastoma cells, Surgery, 2011, 150, 162–168 CrossRef.
- E. L. Haughton, S. J. Tucker, C. J. Marek, E. Durward and V. Leel, et al., Pregnane X receptor activators inhibit human hepatic stellate cell transdifferentiation in vitro, Gastroenterology, 2006, 131, 194–209 CrossRef CAS.
- M. C. Wright, X. J. Wang, M. Pimenta, V. Ribeiro, A. J. Paine and M. C. Lechner, Glucocorticoid receptor-independent transcriptional induction of cytochrome P450 3A1 by metyrapone and its potentiation by glucocorticoid, Mol. Pharmacol., 1996, 50, 856–863 CAS.
- S. A. Hoffmann, U. Müller-Vieira, K. Biemel, D. Knobeloch, S. Heydel, M. Lübberstedt, A. K. Nüssler, T. B. Andersson, J. C. Gerlach and K. Zeilinger, Analysis of drug metabolism activities in a miniaturized liver cell bioreactor for use in pharmacological studies, Biotechnol. Bioeng., 2012, 109, 3172–3181 CrossRef CAS.
- B. M. Shearer, E. C. Thorland, A. W. Carlson, S. M. Jalal and R. P. Ketterling, Reflex fluorescent in situ hybridisation testing for unsuccessful product of conception cultures: a retrospective analysis of 5555 samples attempted by conventional cytogenetics and fluorescent in situ hybridization, Genet. Med., 2011, 13, 545–552 CrossRef.
| This journal is © The Royal Society of Chemistry 2013 |